DataFam Roundup: December 11–15, 2023
Welcome! Dig into this week's DataFam Roundup—a weekly blog that brings together community content all in one post. As always, we invite you to send us your content—and the DataFam content from your peers that have inspired you! Find the content submission form here. This will be the last DataFam Roundup of 2023—see you in 2024 for more data learnings, visualizations, and all things community content!
Community Highlight
To recognize new and consistent Tableau contributors—we’re excited to have a section within the weekly DataFam Roundup called the Tableau Community Highlight. Find out how to get involved.
Catherine Callahan, Sr Analytics Consultant @ Aimpoint Digital
Ohio, USA
Catherine Callahan is a Senior Analytics Consultant at Aimpoint Digital where she builds custom reports and teaches Tableau. Outside of work, Catherine is the database coordinator at LastHopeK9, a dog rescue in New England. Catherine is also a Cleveland Tableau User Group leader, loves participating in community projects, and sharing her data knowledge on social media.
One of Catherine’s notable contributions to the Tableau Community are #tinytableautips— a curated list of practical tips that encompass a wide range of topics, including keyboard shortcuts, reminders of lesser-known functionality, etc., making them relevant to a broad audience.
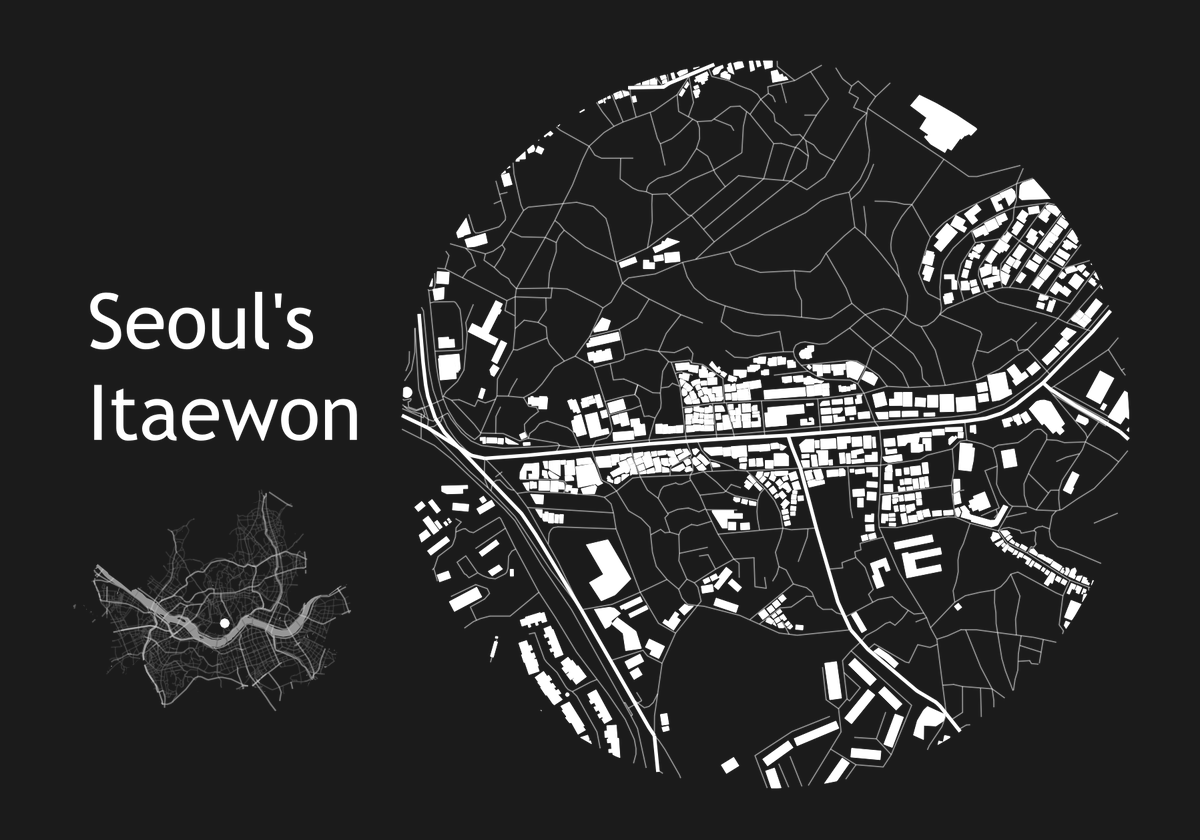
On Tableau Public, Catherine creates visualizations tied to her personal interests. She explores topics in popular culture including TV shows, musicals, and dog friendly neighborhoods as well as participating in community projects like Workout Wednesday.
Connect with Catherine on Linkedin, X, and Tableau Public.
DataFam content
Dive into content created by the Tableau Community:

-
Jennifer Dawes, Her Data: Grow Your Tableau Public Profile
-
CJ Mayes: The Intersection of Art, Design and Data With Damola
-
Ludovic Tavernier: How to create a reusable analytics pane with the nested dashboards technique in Tableau
-
Atif Khan, The Data Leadership Collaborative: 6 Things Slowing Data Integration – and 5 Questions You Should Be Asking
-
Brittany Rosenau: How to write submit a great feature request (aka Tableau Idea)
-
Bill Chen: Discover Taiwan with Data
-
Jim Dehner: Beyond Getting Started 10 Actions and Action Use Cases
-
Dennis Kao: How to create a circular map in Tableau Public
-
Rosario Gauna:
-
Will Sutton, The Information Lab: Build Your Own Tableau Certified Analyst Exam GPT
Team Tableau
-
Practice and Grow Your Data Skills with Tableau Community Projects
- Introducing Enhanced Stats on Tableau Public! Uncover hidden trends, track engagement, discover who you’re inspiring, and make your profile shine. Log in to view your stats: tabsoft.co/3SGRJ67
- Explore the 2024 Iron Viz Entries
- Transforming Ideas into Features: Tableau's Commitment to Community-Driven Innovation
Upcoming events and community participation
-
Apply or Nominate to Become a 2024 Tableau Visionary by 11:59 PM (PT), Thursday, January 11, 2024.
-
Fundamentals of Data Visualization: Friday, December 15, Get ready to level up your data visualization skills with Tableau.
-
#TableauNext 2024 Nominations: Nominate individuals who have significantly impacted the DataFam through their work with Tableau or Salesforce, but are not yet recognized as Visionaries, employees, or Ambassadors. Nominations close at 11:59 PM (ET) on December 29th.
-
Lights, Camera, Action: Tableau and IMDb Launch Data Visualization Campaign for Movie Lovers
-
2024 Iron Viz Qualifiers: Top 10 Results January 17, 2024, 9:00 AM (PT) Virtual Event - Find out the top 10 Tableau Public visualizations, including the 3 finalists selected to compete in the 2024 Iron Viz Championship.
-
READY TO SUPERCHARGE YOUR DATA SKILLS? The Information Lab has free, on demand training courses will help you to make sense of your data and take you from zero to data hero. Developed by our industry leading trainers, our expansive courses cover the basics to intermediate levels of Tableau, Alteryx and Tableau Prep! You can take advantage of the whole course or simply choose the modules you need to brush up on your skills. Start your data journey today by simply selecting your training course below.
-
Demystifying the way to learn Data Visualization! Are you looking for a way to learn Data Visualization and feeling lost? We all have been there and I am going to help you understand the fundamentals and look for a way to learn data visualization.
-
Viz Collab: Hello everyone! I’m excited to be opening #VizCollab back up for another round of matches! In the last year I matched around 40 people for some amazing vizzes, including Viz of the Days and a viz that was featured in a local publication. So if you want to find a collaboration partner sign up.
Vizzes
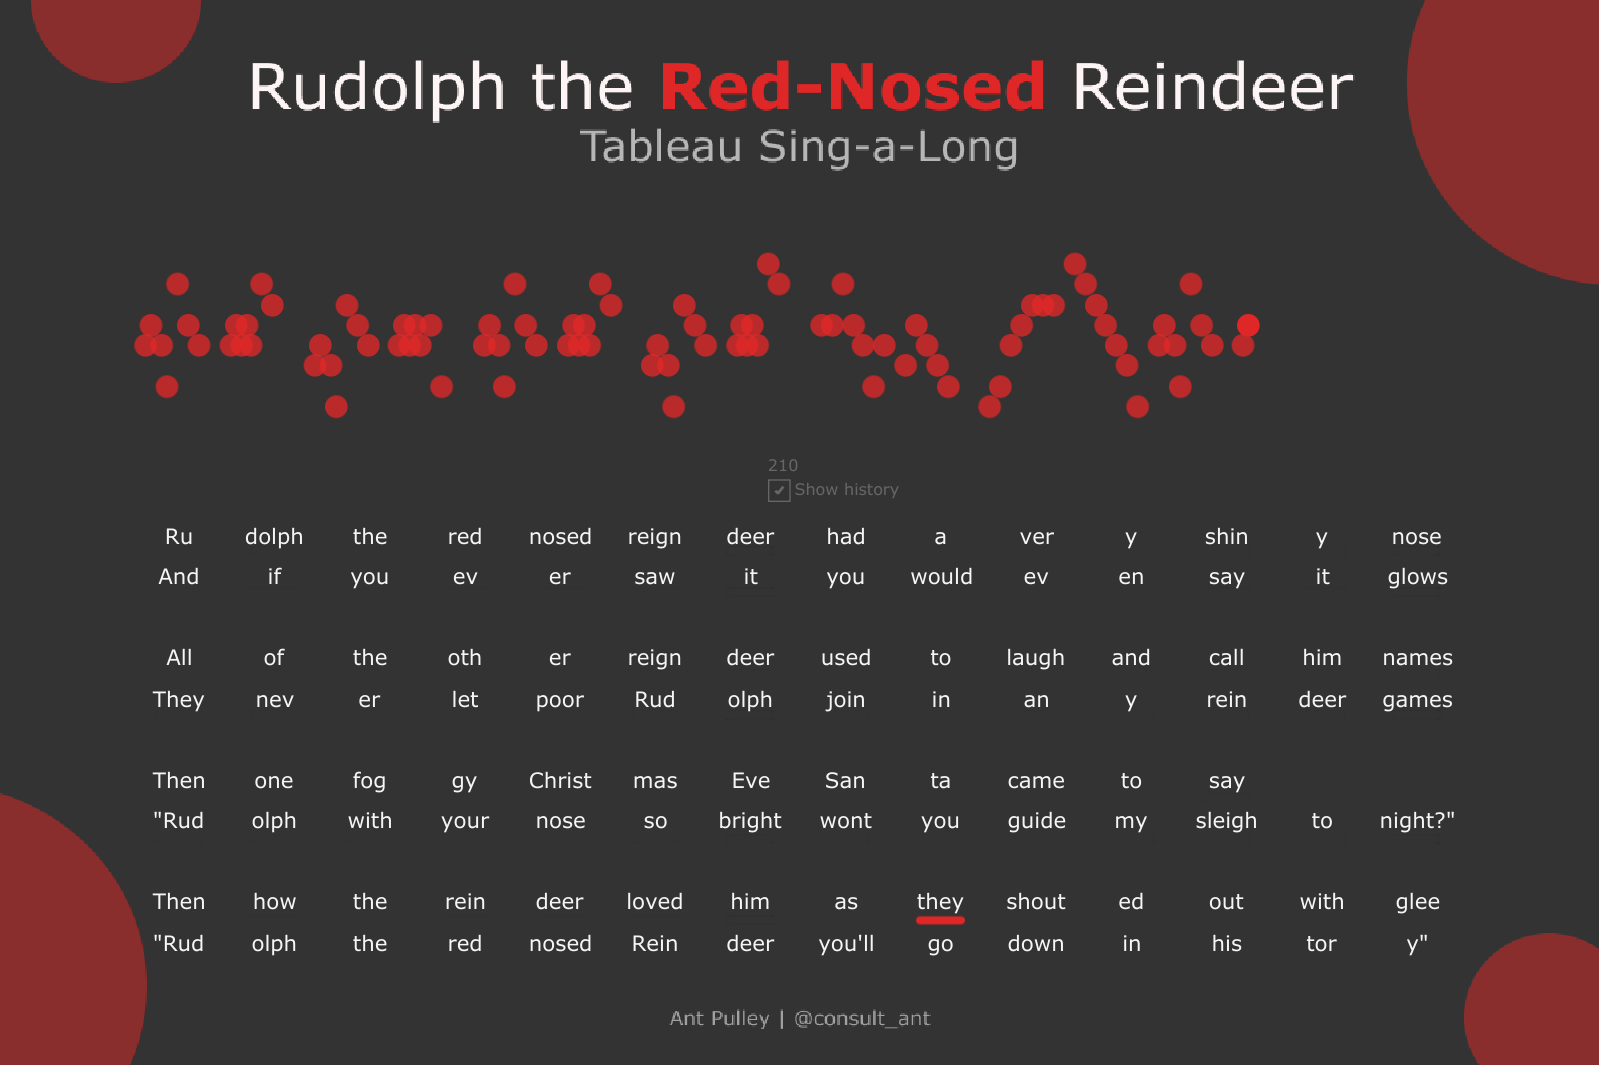
Ant Pulley: Rudolph The Red Nosed Reindeer - Sing-a-long
See the latest Viz of the Day, trending vizzes, featured authors, and more on Tableau Public.
Check out some inspirational vizzes created by the community:
-
Kevin Flerlage: Street Fighter Matchups
-
Chimdi Nwosu: Love and Basketball
-
Adrian Zinovei: BusinessMobileKPIs
-
Ant Pulley: Rudolph The Red Nosed Reindeer - Sing-a-long
-
Rob Taylor: Four Figure Milestone | Hayley Turner's 1000 Race Wins
-
Ben Norland: Formula One's Serial Winners
Community Projects
Back 2 Viz Basics
A bi-weekly project helping those who are newer in the community and just starting out with Tableau. Not limited just to newbies!
Web: Back 2 Viz Basics
Twitter: #B2VB
Week 21: Build a Scatter Plot
Workout Wednesday
Build your skills with a weekly challenge to re-create an interactive data visualization.
Web: Workout Wednesday
Twitter: #WOW2022
Week 50: Can you build this simple KPI?
Preppin' Data
A weekly challenge to help you learn to prepare data and use Tableau Prep.
Web: Preppin’ Data
Twitter: #PreppinData
Week 50: Regular Savings Accounts Part 2
DataFam Con
A monthly challenge covering pop culture and fandoms.
Web: DataFam Con
Twitter: #DataFamCon
December 2023: Holiday Movies
EduVizzers
A monthly project connecting real education data with real people.
Web: Eduvizzers
December 2023: Out-of-school Rates
Games Night Viz
A monthly project focusing on using data from your favorite games.
Web: Games Nights Viz
Twitter: #GamesNightViz
November 2023: Disney's Stacked Bar
Iron Quest
Practice data sourcing, preparation, and visualization skills in a themed monthly challenge.
Web: Iron Quest
Twitter: #IronQuest
White Space
Storytelling with Data
Practice data visualization and storytelling skills by participating in monthly challenges and exercises.
Web: Storytelling with Data
Twitter: #SWDChallenge
December 2023: visualise holiday traditions
Project Health Viz
Uncover new stories by visualizing healthcare data sets provided each month.
Web: Project Health Viz
Twitter: #ProjectHealthViz
October 2023: Customizing Shapes with Opacity in Tableau
Diversity in Data
An initiative centered around diversity, equity & awareness by visualizing provided datasets each month.
Web: Diversity in Data
Twitter: #DiversityinData
November 2023: Disney Demographics
Sports Viz Sunday
Create and share data visualizations using rich, sports-themed data sets in a monthly challenge.
Web: Sports Viz Sunday
Twitter: #SportsVizSunday
Viz for Social Good
Volunteer to design data visualizations that help nonprofits harness the power of data for social change.
Web: Viz for Social Good
Twitter: #VizforSocialGood
Oct 19—Nov 23, 2023: Physicalizing Data for a Better World
Real World Fake Data
Create business dashboards using provided data sets for various industries and departments.
Web: Real World Fake Data
Twitter: #RWFD
Session 6: HR Cross-Function Mobility
Makeover Monday
Create business dashboards using provided data sets for various industries and departments.
Web: Makeover Monday
Twitter: #MakeoverMonday
Data Plus Music
A monthly project visualizing the data behind the music we love!
Web: Data Plus Music
Twitter: #DataPlusMusic
相关故事
Subscribe to our blog
在您的收件箱中获取最新的 Tableau 更新。


