DataFam Roundup: April 3-7, 2023
Welcome! Dig into this week's DataFam Roundup—a weekly blog that brings together community content all in one post. As always, we invite you to send us your content—and the DataFam content from your peers that have inspired you! Find the content submission form here.
Community Highlight
To recognize new and consistent Tableau contributors—we’re excited to have a section within the weekly DataFam Roundup called the Tableau Community Highlight. Find out how to get involved.

Ray Givler, Senior Decision Support Consultant at Helion
Pennsylvania, USA
Ray Givler is a Senior Decision Support Consultant at Helion. He has been involved in a variety of Tableau User Groups, even having presented at some. Ray shares his Tableau knowledge through Linkedin.
During the pandemic, Ray became more active on LinkedIn and has continued to engage with the community this way. If he runs into an issue or he solves a non-intuitive problem at work, he writes about it and shares on LinkedIn. Ray now has more than 10,000 followers who engage with his posts.
When asked about his journey learning Tableau, Ray shares many channels—many related to the DataFam:
- A Tableau training class
- Online resources such as videos and blog articles
- The Tableau Community Forums
- Experimenting with creating different types of charts
- Looking at examples on Tableau Public and Tableau’s Viz of the Day
- Participating in Tableau User Groups and community projects such as Makeover Monday, Workout Wednesday, Real World Fake Data, and Iron Viz
Some of Ray's most popular Linkedin posts are his 2022 Iron Viz submission (a viz about Ray’s favorite Star Wars quotes), an article about how he learned Tableau, and how to create a better first Tableau dashboard.
In the future, Ray plans to leverage Dynamic Zone Visibility at work. He has shared an example on Tableau Public: Status Chevrons via DZV 2.
Outside of his Tableau accomplishments, Ray has also written a book on critical thinking for middle school students called “Don’t Get Fooled!” and has an IMDb screenwriting credit for a horror film titled “Zap”.
Connect with Ray through Linkedin, Tableau Public, and Twitter.
DataFam content
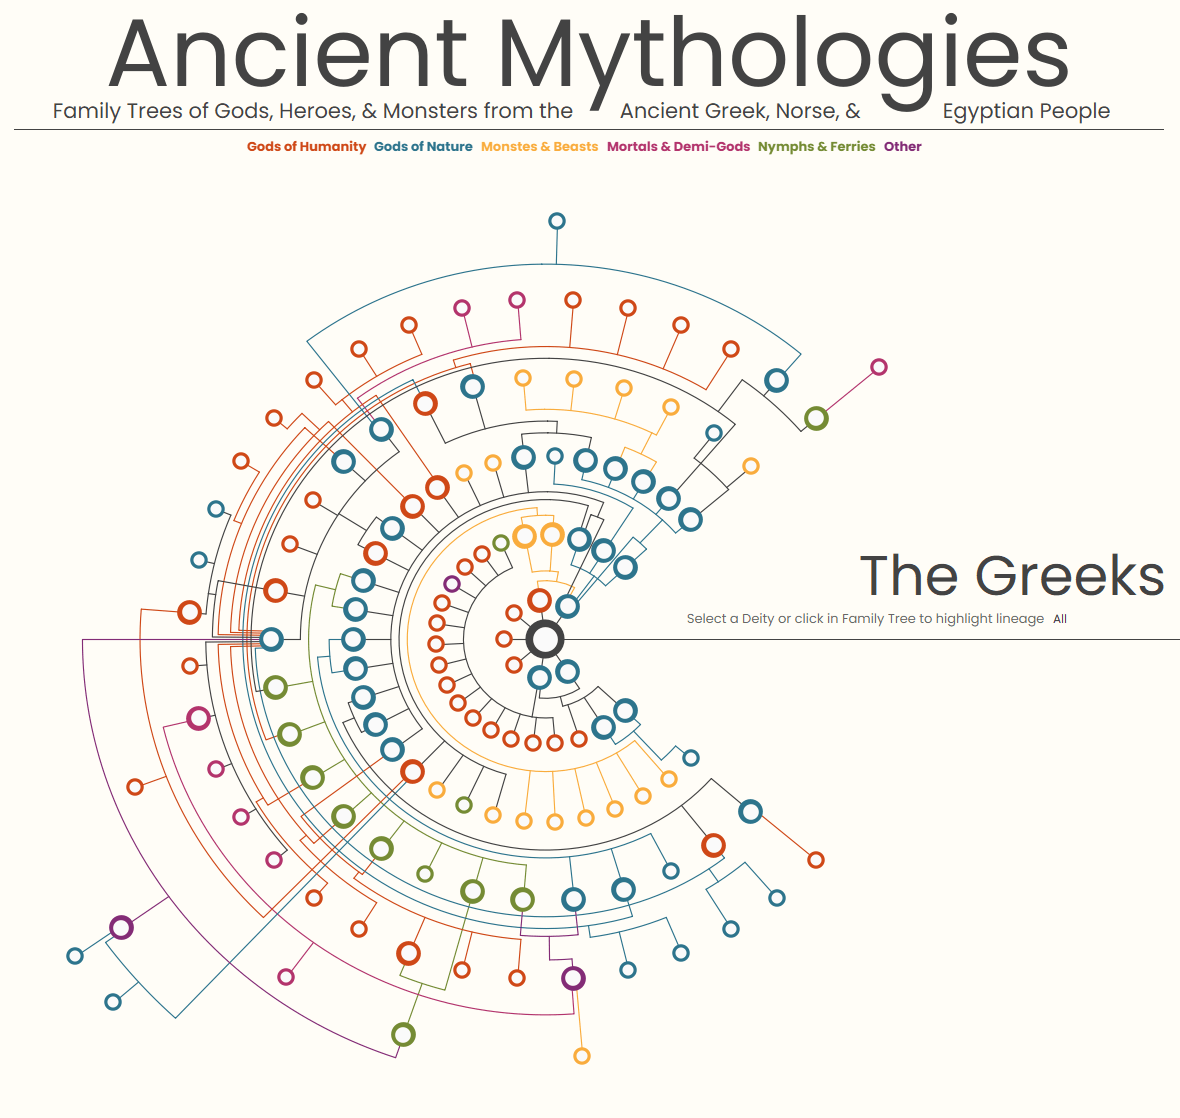
Brian Moore, Do Moore With Data: Radial Family Trees in Tableau
Dive into content created by the Tableau Community:
- DataDrive: Your Essential Guide to Tableau Conference 2023
- Sarah Bartlett: Tableau Conference Guide 2023 #data23
- Lindsay Betzendahl, Viz Zen Data: Custom Calendar Layout Using Dynamic Zone Visibility (Part 2)
- Alex Ross, Cloudy Data Substack: Tableau & dbt: Governed Self-Service Analytics
- Adam Green, #CoffeeTableViz: Women’s US Open 2021
- Jason Khu, LinkedIn: Joins between two tables are best learnt when visualised Venn diagrams
- Kasia Gasiewska-Holc, The Flerlage Twins: Custom Date Drill Down Trend Chart
- Brian Moore, Do Moore With Data: Radial Family Trees in Tableau
- Ann Jackson: So You Want to be a Visualization & Analytics Consultant?
- Cj Mayes and Nir Smilga: Trellis Charts With Nir Smilga
- Dawn Harrington, TechTipsGirl: Year Over Year Visualizations
- Zach Bowders, Data + Love: Generative AI Revolution w/ Jeff Shaffer
- Tristan Guillevin, Ladataviz: Create Bump Charts in Tableau in no time | Tutorial
- Gabe Explains Data: Say Goodbye to Manual Data Visualization with ChatGpt and Tableau
- Lore So What: The ONLY Data Analytics Portfolio Project You Need - pt.2
Team Tableau
-
Celebrating the DataFam and 3 Million Profiles on Tableau PublicAnnouncing the 2023 Tableau Visionaries
Upcoming events and community participation
-
Data Leadership Collaborative (DLC) Networking Hour: Expand your network at an event designed to help facilitate connections among Data Leaders.
-
TrailblazerDX ’23 Tableau Quest: Leverage the power of data with the world’s leading analytics platform to drive better business decisions.
-
The 2023 Vizzies Award Nominations: The Tableau World Podcast established the Vizzies as a way to recognize individuals in the Tableau community who are not recognized through the visionary program. It is our goal that these awards are diverse and inclusive of the Tableau community. So without further ado, we present the 8th Annual Vizzies. Nominations are open through March 31st. Winners will be announced live on stage at TC23! How do you nominate someone? It's super easy. Just fill out the nomination form by typing in the person's name.
-
Community Calendar and Upcoming Events: stay up-to-date on the latest Women in Dataviz events and other data visualization-related events. If you'd like to submit an event to the calendar, please fill out this form.
Vizzes
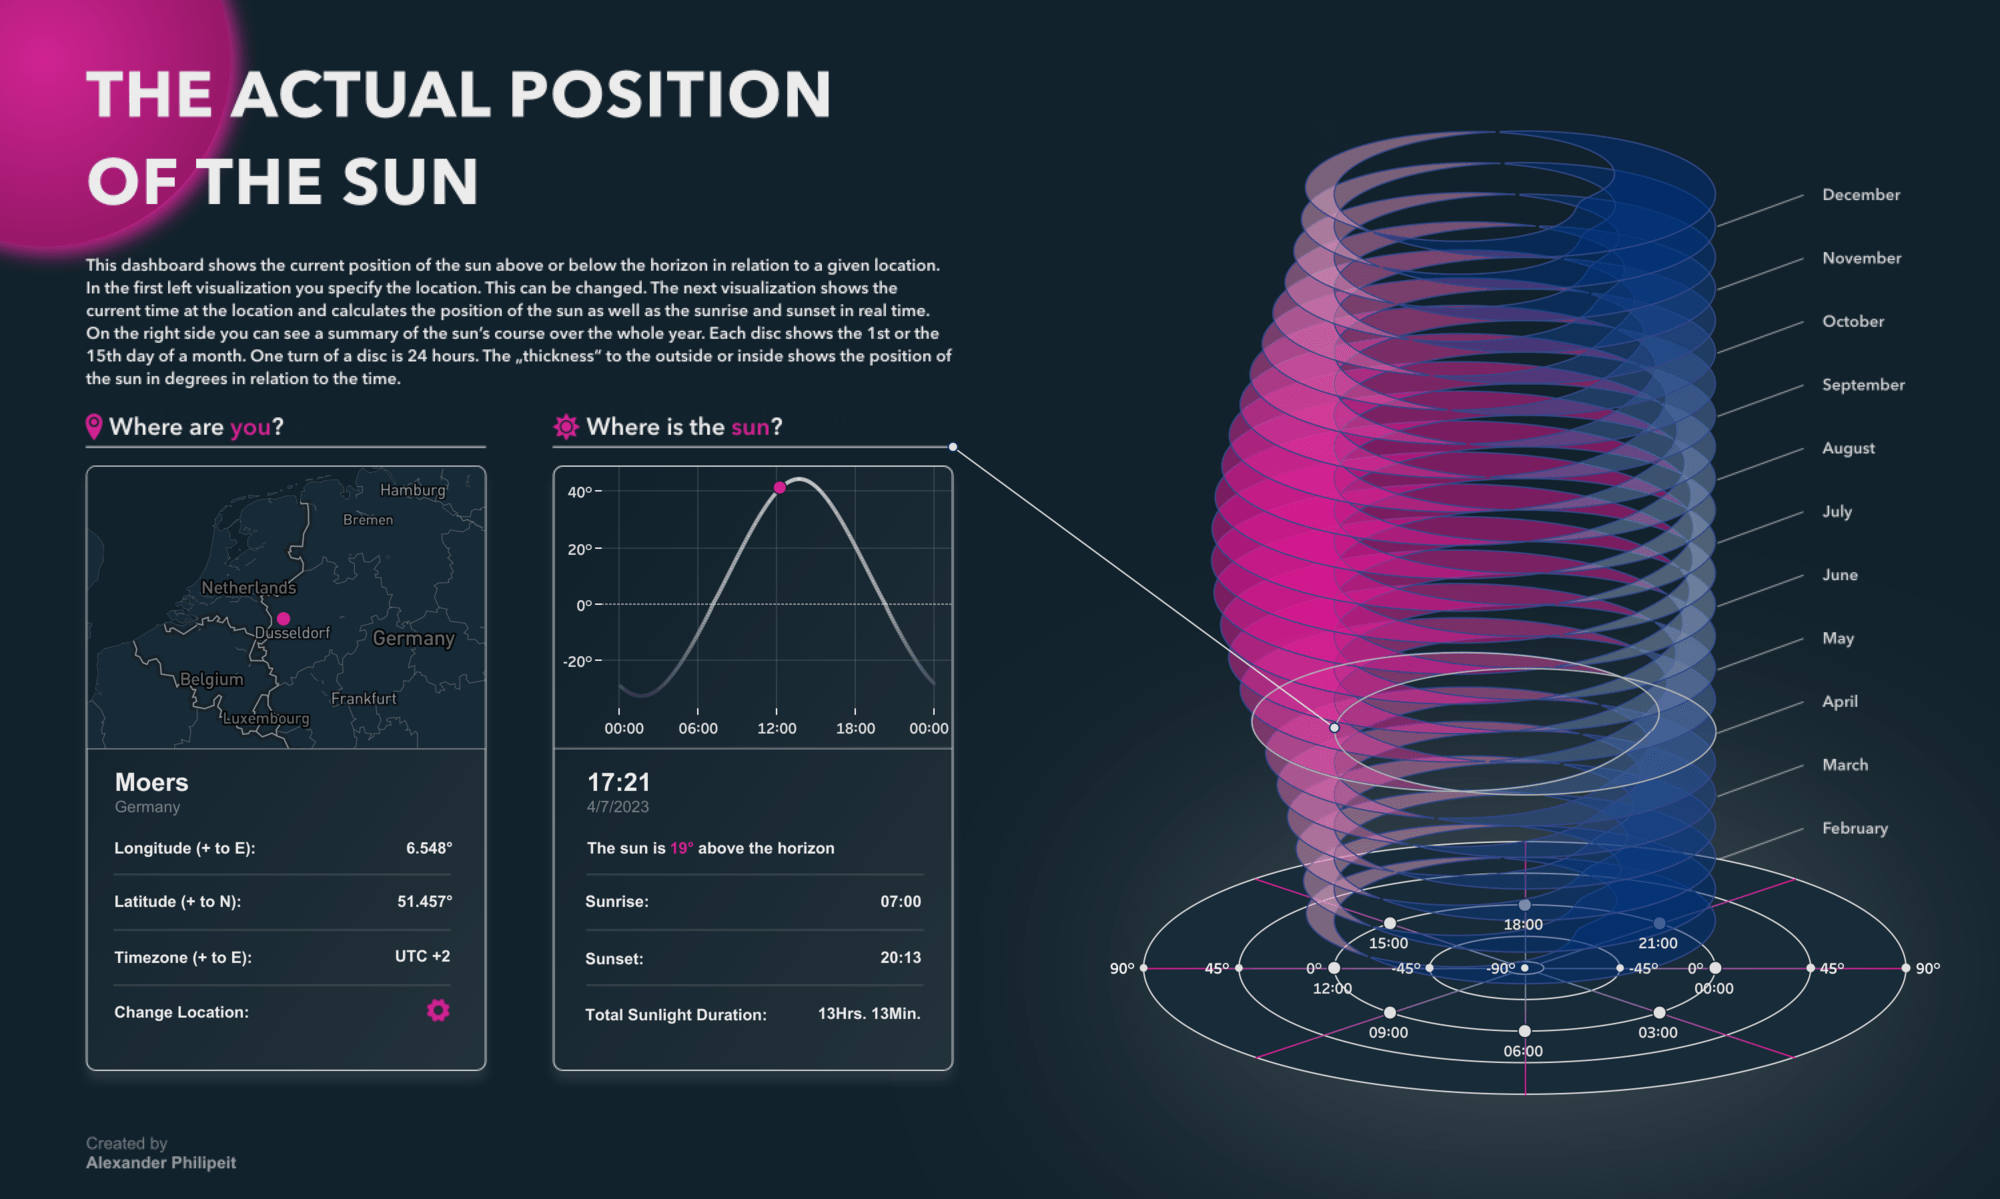
Alexander Philipeit: The Actual Position Of The Sun
See the latest Viz of the Day, trending vizzes, featured authors, and more on Tableau Public.
Check out some inspirational vizzes created by the community:
-
Ahmed Shehata: Superstore Performance Dashboard
-
Alexander Philipeit: The Actual Position Of The Sun
-
Autumn Battani: It's A Date: Calendars
-
Yamil J. Medina: A Sankey for Income Statement: Nike Qtr 3 Fiscal Year 2023
- Anamika Singh: Box Office 2022
Community Projects
Back 2 Viz Basics
A bi-weekly project helping those who are newer in the community and just starting out with Tableau. Not limited just to newbies!
Web: Back 2 Viz Basics
Twitter: #B2VB
Week 7: Create a Ranked Table
Workout Wednesday
Build your skills with a weekly challenge to re-create an interactive data visualization.
Web: Workout Wednesday
Twitter: #WOW2022
Week 14: How short are baseball games in 2023?
Makeover Monday
A weekly social data project.
Web: Makeover Monday
Twitter: #MakeoverMonday
Week 14: Hate Crime in Chicago
Preppin' Data
A weekly challenge to help you learn to prepare data and use Tableau Prep.
Web: Preppin’ Data
Twitter: #PreppinData
Week 14: World Trade Data
DataFam Con
A monthly challenge covering pop culture and fandoms.
Web: DataFam Con
Twitter: #DataFamCon
April 2023: Kids Month!
EduVizzers
A monthly project connecting real education data with real people.
Web: Eduvizzers
March 2023: Open Database of Educational Facilities in Canada (ODEF)
Games Night Viz
A monthly project focusing on using data from your favorite games.
Web: Games Nights Viz
Twitter: #GamesNightViz
Level 6: The Final Boss
Iron Quest
Practice data sourcing, preparation, and visualization skills in a themed monthly challenge.
Web: Iron Quest
Twitter: #IronQuest
Storytelling with Data
Practice data visualization and storytelling skills by participating in monthly challenges and exercises.
Web: Storytelling with Data
Twitter: #SWDChallenge
March 2023: design in light and dark
Project Health Viz
Uncover new stories by visualizing healthcare data sets provided each month.
Web: Project Health Viz
Twitter: #ProjectHealthViz
April 2023: The Lown Institute Hospital Index on Equity
Diversity in Data
An initiative centered around diversity, equity & awareness by visualizing provided datasets each month.
Web: Diversity in Data
Twitter: #DiversityinData
April 2023: Arab American Heritage Month & Language
Sports Viz Sunday
Create and share data visualizations using rich, sports-themed data sets in a monthly challenge.
Web: Sports Viz Sunday
Twitter: #SportsVizSunday
January 2023: Is it a Sport or a Game?
Viz for Social Good
Volunteer to design data visualizations that help nonprofits harness the power of data for social change.
Web: Viz for Social Good
Twitter: #VizforSocialGood
Mar 23 - Apr 18, 2023: World Health Organization (WHO)
Real World Fake Data
Create business dashboards using provided data sets for various industries and departments.
Web: Real World Fake Data
Twitter: #RWFD
Session 5: Diversity Score Card
Data Plus Music
A monthly project visualizing the data behind the music we love!
Web: Data Plus Music
Twitter: #DataPlusMusic
相关故事
Subscribe to our blog
在您的收件箱中获取最新的 Tableau 更新。


