Business Intelligence development can be easy
This blog entry is part of a series that reviews and discusses recent reports from Gartner.
I’ve been in and around business intelligence for the last 15 years, much of it on the vendor side with some of the biggest and best known traditional business intelligence platforms. I’ve seen a lot of BI deployments - how they’re built and developed. What I’ve observed is that traditional Business Intelligence has been designed for IT departments to purchase. Developers build and deliver content with the hope that business users will use it.
As a result Business Intelligence tools and systems have become increasing developer-centric. They have evolved to become increasingly powerful at the expense their ease of use and cost of ownership. Most traditional business intelligence design tools are so complex that the production of business intelligence content involves an elongated development cycle often requiring extensive massaging or sculpting of data, development and management of metadata before the development and management of content is even begun. Because business intelligence systems have been designed primarily for IT to deliver business intelligence to the end users; the delivery of new content can take weeks, months or even years.
At Tableau, we have designed our solutions to be bought by business users to allow them to visually explore data and share those discoveries with other business users. Because we have designed our Business Intelligence solutions to be bought by, built by and used by business users, we have incorporated the focus on ease of use and simplicity that is demanded by business users.
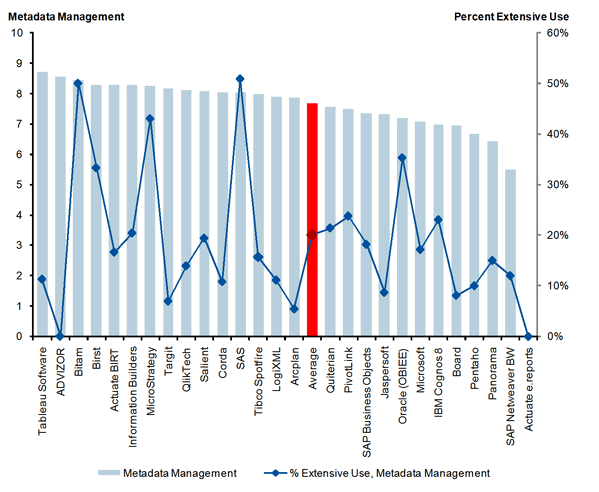
The ease of use that Tableau brings is the concept of staying one step ahead of the user. This is nowhere more prevalent to our approach to metadata. We call it “metadata in minutes.” When a user connects to a data source, Tableau intelligently interrogates the data structure and builds the meta data for the user so that they can easily and simply begin working with their data to gain insight. If they need or want to modify Tableau’s generated metadata, the user can easily rename fields, remove fields , create custom calculations, create hierarchies, add business rules and reorganize the metadata as they see fit. They can then save and publish those changes for others to use. Because Tableau is designed for the Business User, metadata can be produced literally in minutes vs. the days and weeks it takes with the developer centric approach taken in more traditional models. In many cases the user does not even know they are using metadata which is evident in usage and satisfaction chart from the latest Gartner survey below.
Figure 1: Metadata Management

Source: BI Platforms User Survey, 2011: Customers Rate their BI Platform Functionality, 31 March 2011, Rita L. Sallam, Gartner Research Note G00211770. Chart represents customer perception and not Gartner's opinion.The chart may feature vendors that (in Gartner's opinion) do not deliver the functional capability described.N=1,127
Let’s take this a little further out to overall development ease. Notice how Tableau is rated in the development tools chart below.
Figure 2: Satisfaction and Usage: Development Tools

Source: ibid. Chart represents customer perception and not Gartner's opinion.The chart may feature vendors that (in Gartner's opinion) do not deliver the functional capability described.N=1,127
Again this can be attributed to Tableau’s approach of providing common-sense, easy to use interfaces that can be used by developers and business user alike. In order for business Intelligence to be successful it needs to be easy to build, easy to consume, easy to share and easy to integrate into existing systems and processes. The approachability of Tableau Desktop is well known (if you do not know about it download a copy and see for yourself). But it is the simplicity of collaboration and sharing solutions of Tableau Server, Tableau Digital and Tableau Public that drive Tableau’s customer satisfaction scores. With all of these solutions there is a simple URL based interface to integrate dynamic or static dashboards and visualizations into websites, blogs, or documents with no coding and no hassle. Again with our simple “no coding required” approach, many of Tableau’s customers probably don’t realize the development power of Tableau’s tools and that is why they are rated the way they are.
In summary, by designing Business intelligence to be bought by, developed by and used by Business Users, Tableau has taken some of the time consuming, inflexible processes of Business Intelligence and made them fast, easy and in many cases invisible. This means that users enjoy using Tableau and can get things done quickly with very limited IT support.
Nigel Stoodley is the Vice President of Sales Consulting, Support and Services at Tableau Software. Prior to that Nigel had held various leadership roles in Support, Product Management, Sales Consulting, Sales and Solution Management at Seagate Software, Crystal Decisions, Business Objects and SAP.
Subscribe to our blog
在您的收件箱中获取最新的 Tableau 更新。


