Best of the Tableau Web: New features and growth opportunities
In this month’s Best of the Tableau Web, Andy Cotgreave shares the blogs he loves from January. Dive in to get inspired, learn new tips and tricks, and more.
It’s February and it’s Valentine’s Day, so here are the blogs I loved in January. Yes, that is one of the cheesiest opening lines I’ve written for this series! I remain unapologetic. The content team asked for something Valentine-themed and that’s the best I have. :-)

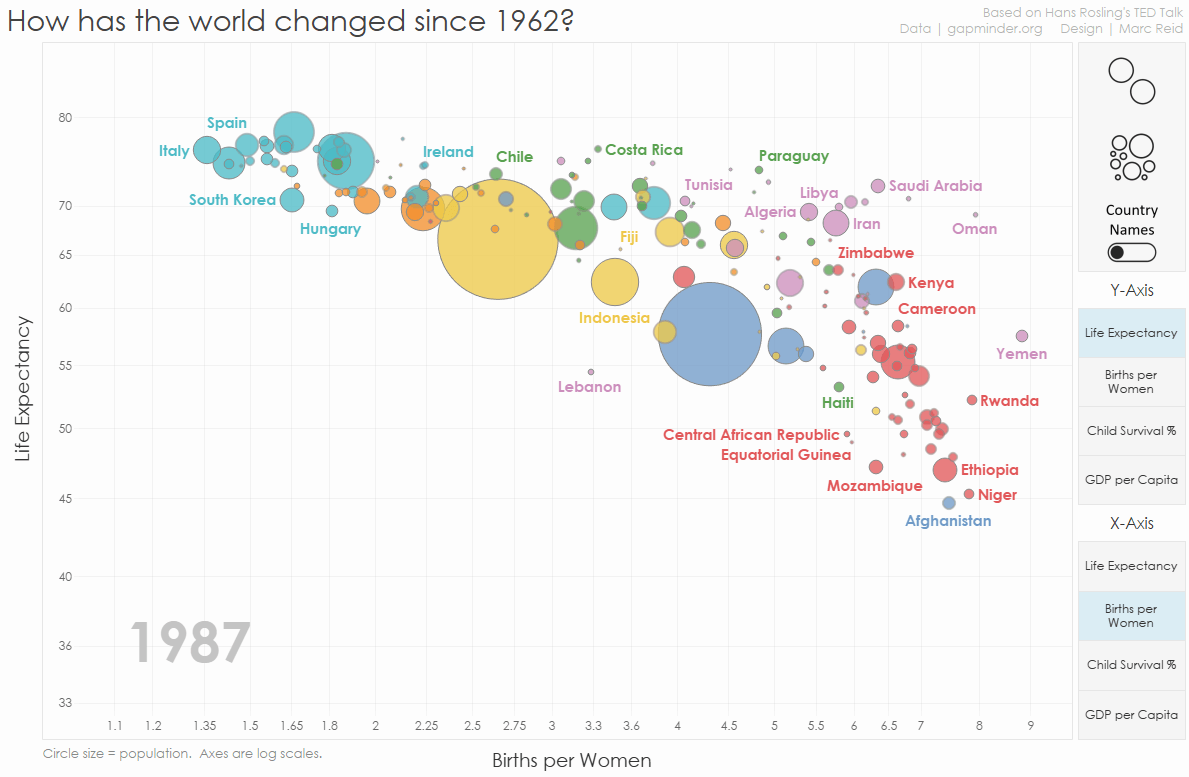
This month, I’ve seen some great posts on animations. Did you know our next release of Tableau Desktop has animations? Marc Reid has a fantastic overview of the why, what, and how and Jonathan Drummey has delivered a seismometer-style animated display. With every new feature, we open up new vistas of opportunity. Where do you think you will go with animations?
Another post I really enjoyed was from Meera Umasankar (@LosaniMeera), who helps run the Singapore Data Plus Women chapter and is a Tableau Public Ambassador. In the post, she describes her involvement with Makeover Monday and how it has helped her grow.

The big takeaway for me is how an initial feeling of intimidation gives way to a feeling of engagement, involvement, and excitement. I think this is a big issue for everyone starting out— everyone else might seem highly skilled and already well-connected with everyone else. I can reassure everyone reading this that if you’re nervous about diving into any of the Tableau/dataviz community projects, everyone started off knowing nobody. I highly recommend you take the first few steps and reap the rewards Meera describes.
As always, enjoy the list! Follow me on Twitter and LinkedIn as I try and share many of these throughout the month. Also, you can check out which blogs I am following here. If you don’t see yours on the list, you can add it here.
Tips and tricks
Eric Parker Grouping Options in Tableau
Jim Dehner FAQ Series- Cannot Mix Aggregate and Non-aggregate
Spencer Baucke Top Five : Newer Features of Tableau
Alexander Mou Enhancing Chart Contrast #TweakThursday 43
Paul Tanner Reclaim Your Space
Lorna Eden #TableauTipTuesday 2020 Week 5: Using Bins to show missing data
Seffana Mohamed-Ajaz Tableau: Use filter action fields to update sheet titles
Rosario Gauna DYNAMICALLY DISPLAY MULTIPLE NUMBER FORMATS
Mark Bradbourne Animations – Develop a Strategy Now
Kevin Flerlage Dynamically Control Formatting Using Multiple Calculations
Nicholas Hills Beta Buffering in Tableau 2020.1
Alex Taylor-Jackson Keyboard Shortcuts in Tableau
Luke Stanke How to Build Multiple Select Parameters in Tableau
Andy Kriebel #TableauTipTuesday - How to Create KPIs and Sparklines in a Single Worksheet
Ryan Sleeper How to Reorder Stacked Bars on the Fly in Tableau
Jim Dehner FAQ Series - Not all NULLS are created equal
Inspiration
Jeff Plattner Tableau Public Revizited
Brandi Beals Killer Ideas for your Next User Group Meeting
Chris Love How I came to know so little about Data Visualisation
Spencer Baucke #BlackHistoryMonth | Oscars Still So White
Heidi Kalbe Marimekko Unchained: Going Crazy with Design
Bridget Cogley Mixed Signals: Tableau Dashboards, Color, and Alerting
Lindsay Betzendahl #MomsWhoViz: Jacqui Moore
Mark Bradbourne The Dashboard Requirements Worst-Case Survival Handbook
Louise Shorten Viz Animations in Tableau
Luke Stanke Building a Custom Color Palette In Tableau
Tableau Prep
Carl Allchin How to...Join Datasets together
Ken Flerlage Tackle Data Dictionaries with Tableau Prep
Server
Jedi
Jonathan Drummey Seismometer-style animations in Tableau v2020.1
Rajeev Pandey Create Custom Map Shapes in Tableau
Luke Stanke Vertical Slider Parameters in Tableau
Klaus Schulte Viz-in-Label Treemaps in Tableau
Ken Flerlage Creating a Parliament Chart in Tableau
相关故事
Subscribe to our blog
在您的收件箱中获取最新的 Tableau 更新。


