Tableau for Industries
State and local government analytics
Deliver equitable and transparent services with operational agility
Hear how Lake County Health Department (LCHD) is transforming analytics at scale to build public trust in data.
Watch the video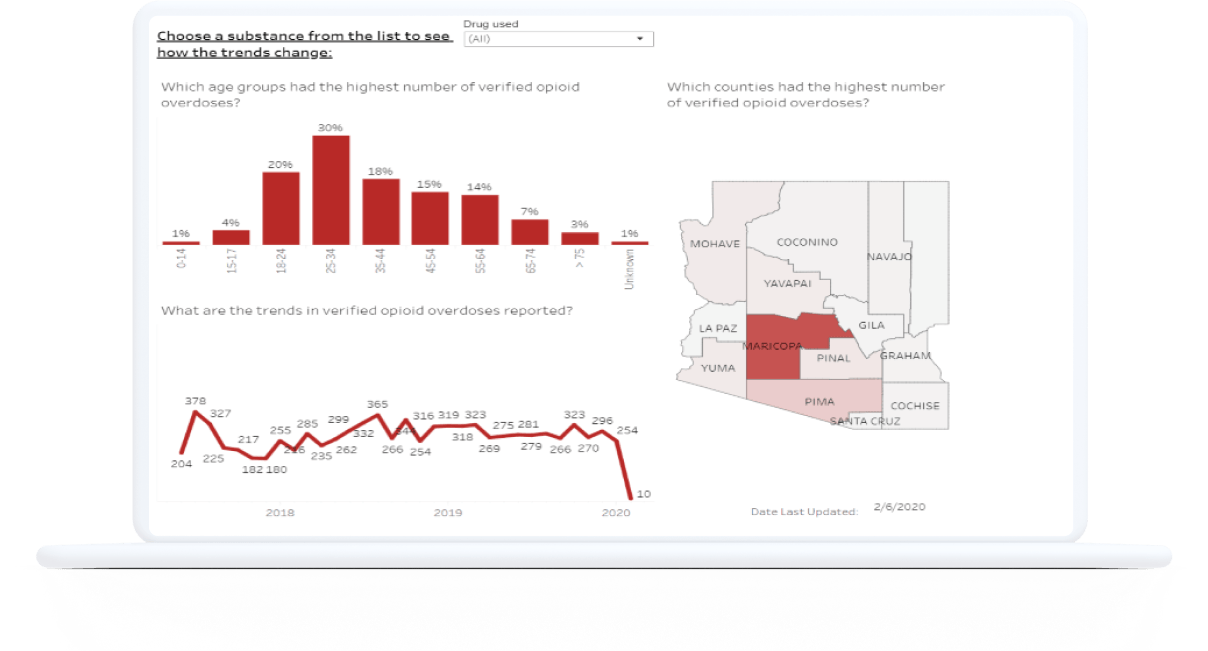
Turning the tide on the opioid epidemic in the state of Arizona
With Tableau, the Arizona Department of Health Services (AZDHS) has overcome challenges and advanced its mission by increasing transparency, enabling citizen action, and equipping decision-makers to turn the tide of the opioid epidemic.
Read the storyTypically, when a concerned citizen asks a question, they just want an answer. Policymakers not only want an answer, they want to see the data to verify it. With Tableau, we now save about half an hour to an hour for each question.
Tallahassee Utilities improve services, quality, and productivity
See how Tableau visualizations helped Tallahassee Utility managers better understand sewer clearing teams’ productivity and make decisions that improved productivity by up to 30 percent.
Learn moreMinnesota Pollution Control Agency (MPCA) on how they became a data-driven organization
Learn how Tableau helps the MPCA meet its governmental transparency and accountability goals, improve productivity, and create a data-driven culture.
Read the storyThe state of Tennessee fulfills multi-year economic and community development plan with Tableau
Discover how Tennessee Department of Economic and Community Development (TNECD) migrated its data to Tableau, enhancing project transparency with local government and taxpayers and saving 12 hours a month on reports.
Read the story
Additional
resources
Solutions
Featured Solution
Reimagining the workforce
Learn how state and local governments are partnering with Tableau to recruit, manage, and empower a resilient, data-driven workforce.
See the solution
Products and
use cases
Events for Public Sector
Visualize state and local analytics data
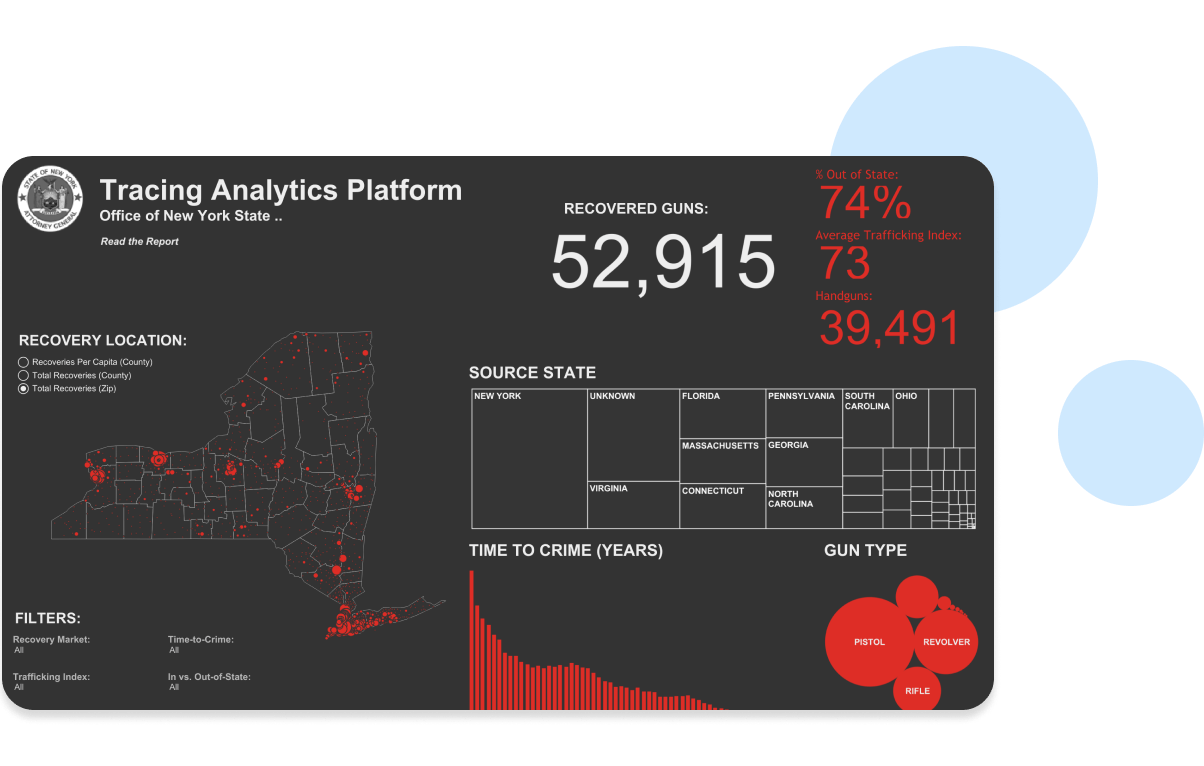
Increasing public safety with New York gun tracing
By collecting and analyzing aggregate gun trace data, the Office of the New York State Attorney General has been able to begin identifying regional patterns and differences, allowing for more effective efforts in keeping dangerous guns out of the hands of criminals.
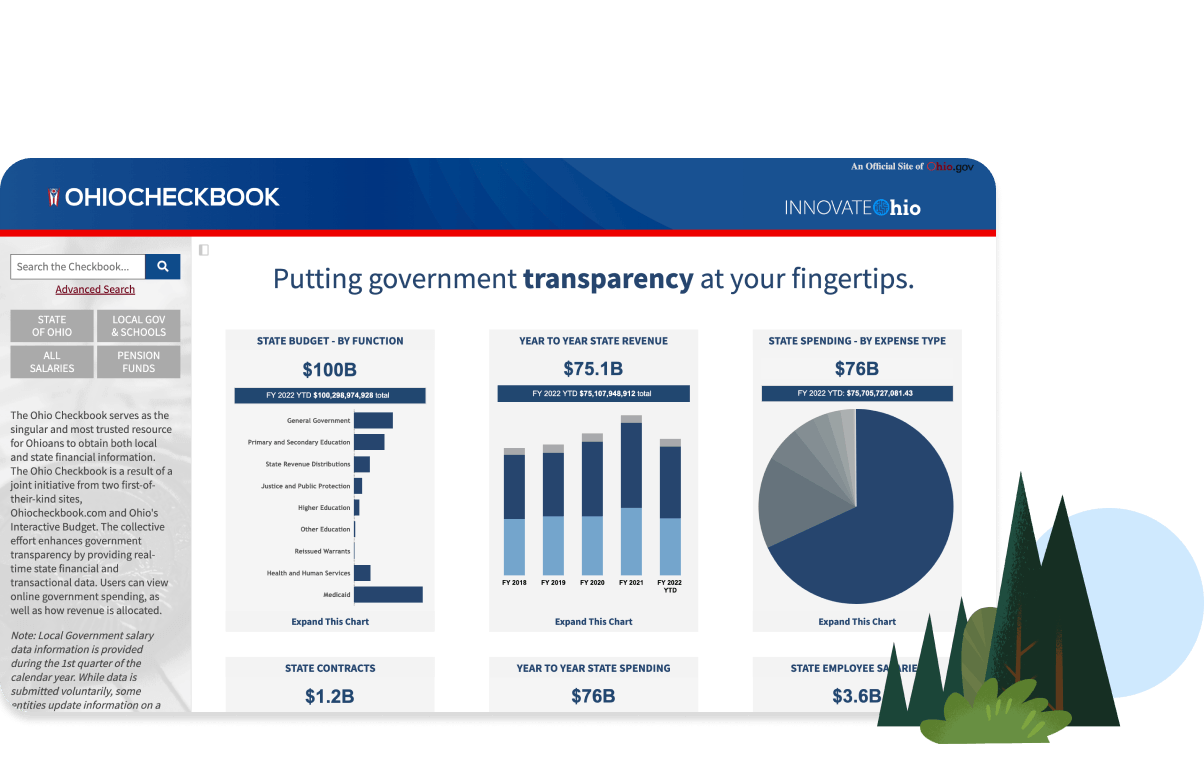
Explore the vizOhio Checkbook
The Ohio Checkbook serves as the singular and most trusted resource for Ohioans to obtain both local and state financial information. Users can view online government spending, and see how revenue is allocated.
Explore the viz
Salesforce and Tableau
A complete intelligence platform built on the world’s #1 CRM, Salesforce, CRM Analytics offers state and local governments a native analytics experience. To boost productivity, Salesforce users can surface intelligent, actionable insights—right within their workflow. Explore Salesforce solutions for the government.
