Tableau for Industries
Payers analytics
Drive optimal patient experiences and data-driven care outcomes with the world’s leading healthcare analytics platform
Data democratization is a key pillar of digital transformation for healthcare
Learn how Blue Shield of California is building a data-driven culture that empowers employees to make intelligent business decisions.
Watch nowCigna improves affordability and care for 95 million healthcare customers
Learn how Cigna uses Tableau to integrate multiple data sources and offer governed reports to its partners, delivering significant cost savings for patients.
Now we can track individual dashboard utilization to users and connect population health performance to how strongly providers used our reporting solutions.
Anthem scales their virtual care business
See how Anthem cultivates a lasting data culture and drives improved care outcomes with Tableau.
OptumHealth better understands customers with Tableau
Learn how OptumHealth uses Tableau to achieve a holistic view of its operations and help sales teams look for new opportunities.
Kaiser Permanente improves diabetes care with data-informed insights
Learn how Kaiser Permanente uses Tableau to help clinicians and healthcare leaders improve care gaps for diabetic patients.
Additional
resources
Solutions
Featured Solution
Group reporting starter kit
Get resources to deliver integrated, embedded dashboard analytics for plan utilization, costs, and trends, to employer groups and broker partners.
Learn more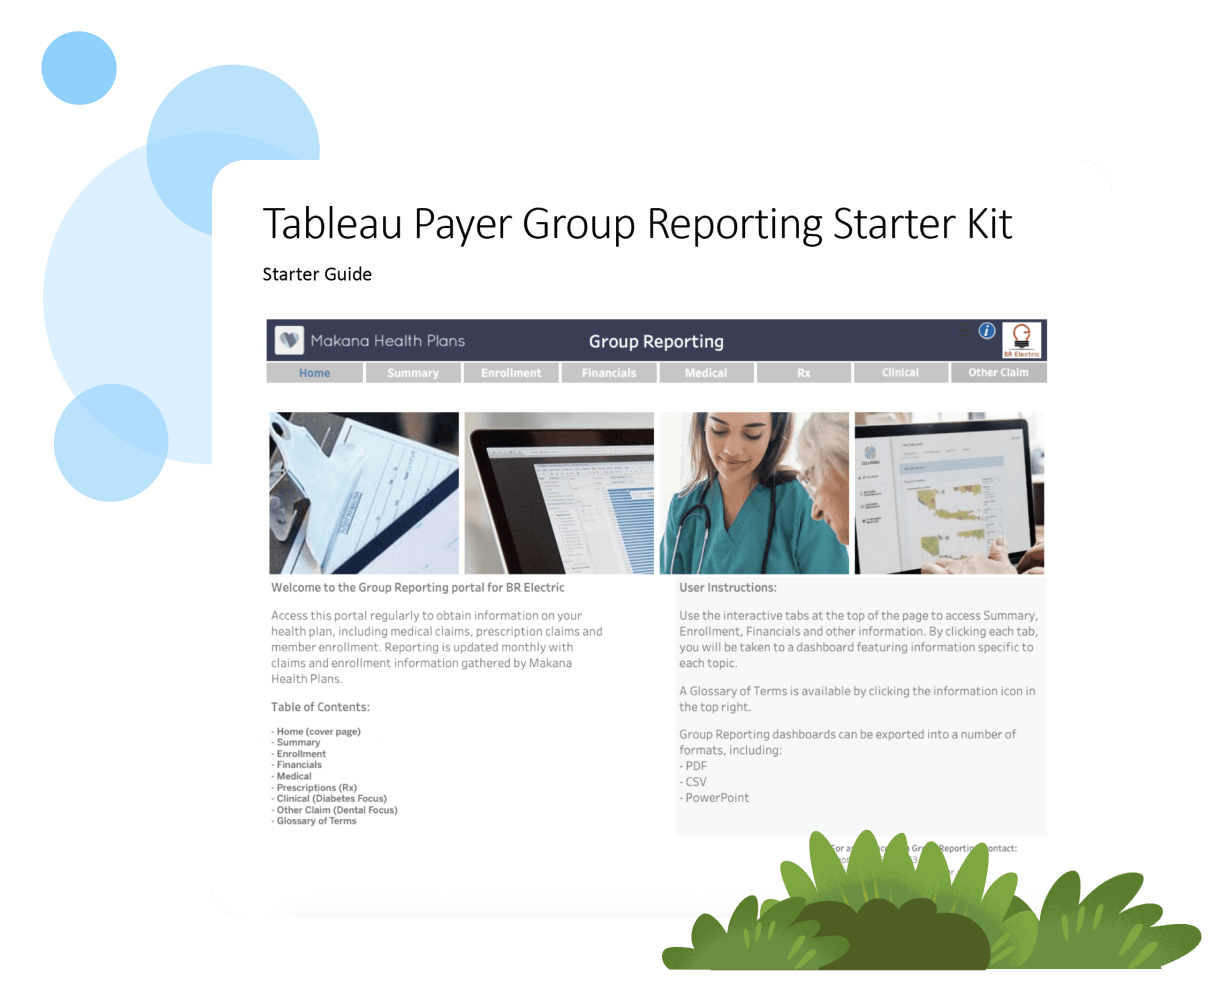
Products and
use cases
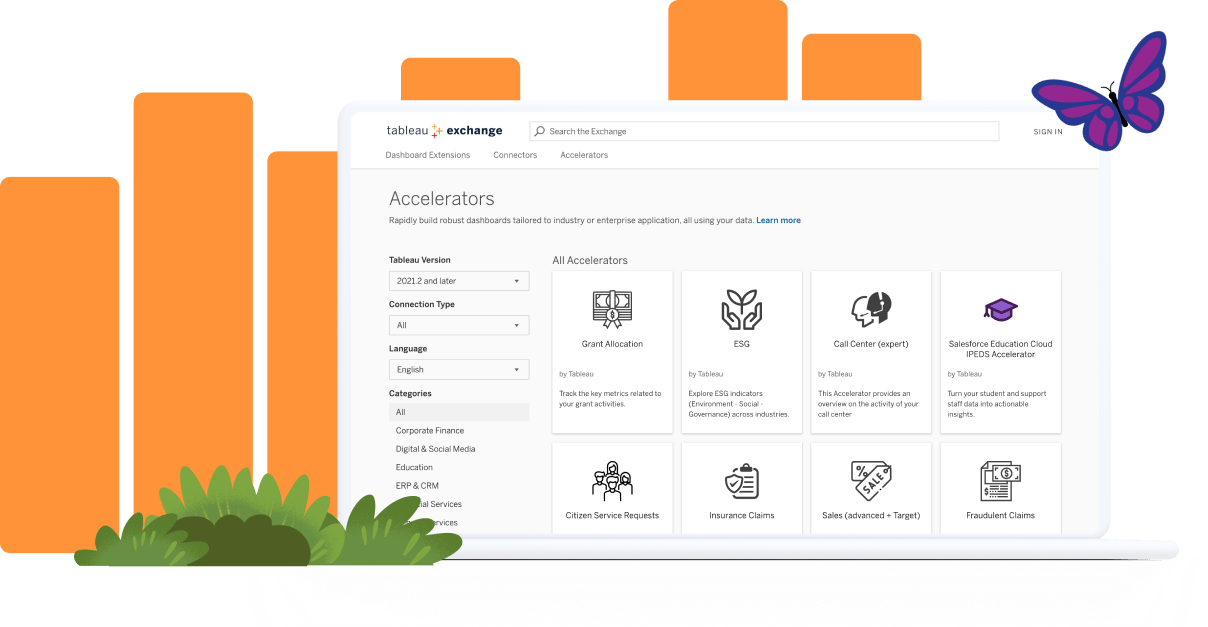
Jumpstart analysis with Tableau Accelerators
Get expert-built dashboards to address provider-specific business needs with Accelerators on the Tableau Exchange.
Explore AcceleratorsEvents for healthcare and life sciences providers

Tableau Partner Network
Need help solving your toughest data challenges? We’ve got you. With more than 1,200 partners—including resellers, services, and technology—it’s easy to get the right support for your business.
Find a partnerVisualize healthcare and life sciences data
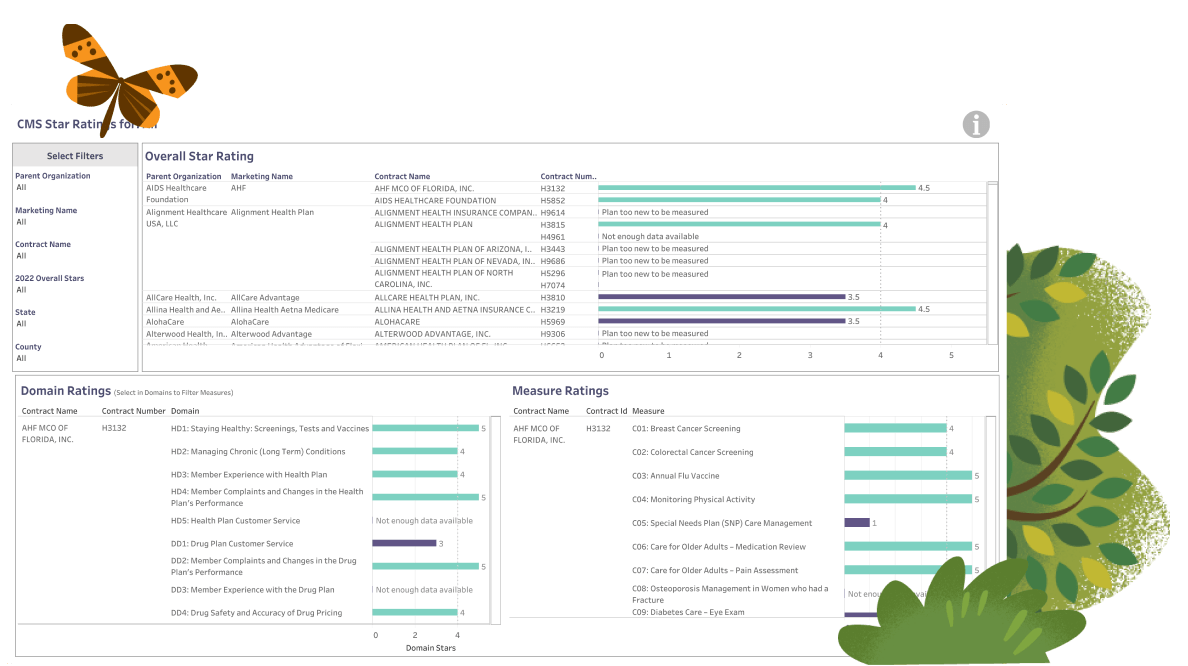
CMS Star Rating Dashboard
The Centers for Medicare and Medicaid Services (CMS) uses a five-star quality rating system to measure the experiences Medicare beneficiaries have with their health plan and health care system. Explore this dashboard to compare 2022 CMS scores.
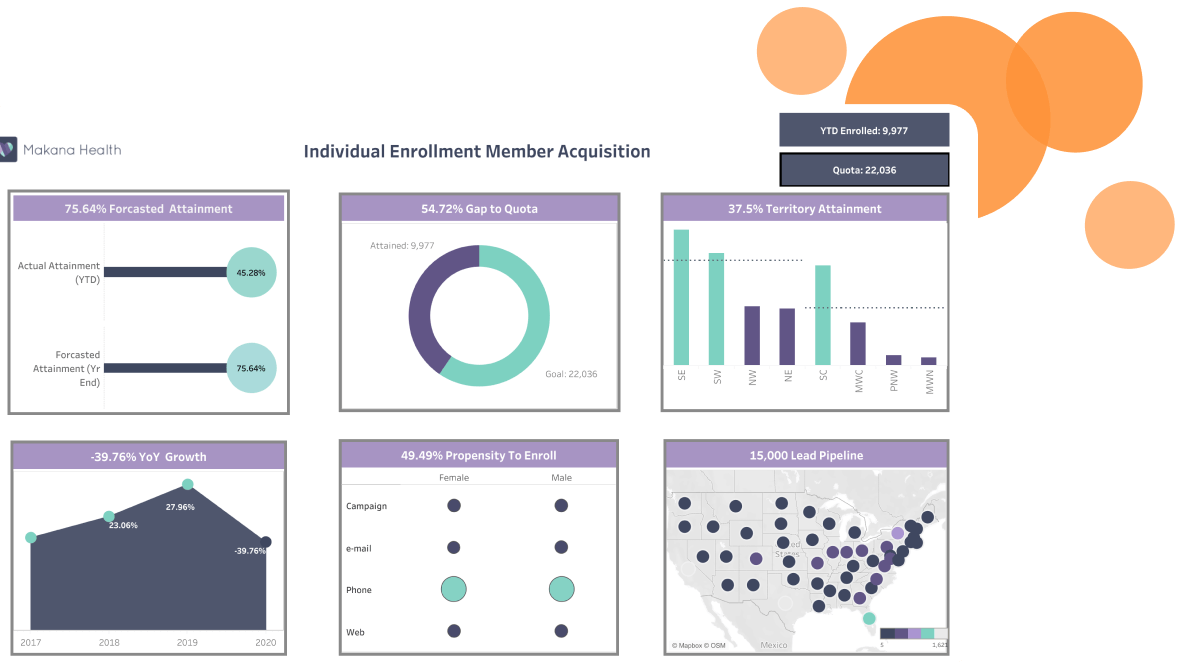
Explore the vizMakana Health Medicare enrollment KPI scorecard
Use this dashboard to track Medicare individual enrollment member acquisition and propensity to enroll by demographic and age cohort data.
Explore the viz
Salesforce and Tableau
A complete intelligence platform built on the world’s #1 CRM, Salesforce, CRM Analytics offers Payers a native analytics experience. To boost productivity, Salesforce users can surface intelligent, actionable insights—right within their workflow. Explore Salesforce solutions for healthcare.
