A virtual Gartner BI Bake-Off: Analytics for anyone, anywhere, with any data
In an all-virtual, Gartner BI Bake Off, Tableau showcased innovations like Ask Data, our natural language functionality, and Tableau Prep, our self-service data preparation tool.
Yesterday, our team had the honor of showcasing Tableau innovations in an all-virtual Gartner BI Bake-Off. It was fitting for 2020, since we couldn’t be together in person for the annual showdown, which is part of Gartner’s Data and Analytics Summits. This year, Gartner provided a data set on population health and socioeconomic measures, which led my colleague, Solutions Engineer David Taylor, and myself into some interesting analysis. For example, I found that the prevalence of obesity is highly correlated with countries’ life-expectancy rates. Through visual analysis with animation, it was easy to see the trends emerge from the ten years of data.
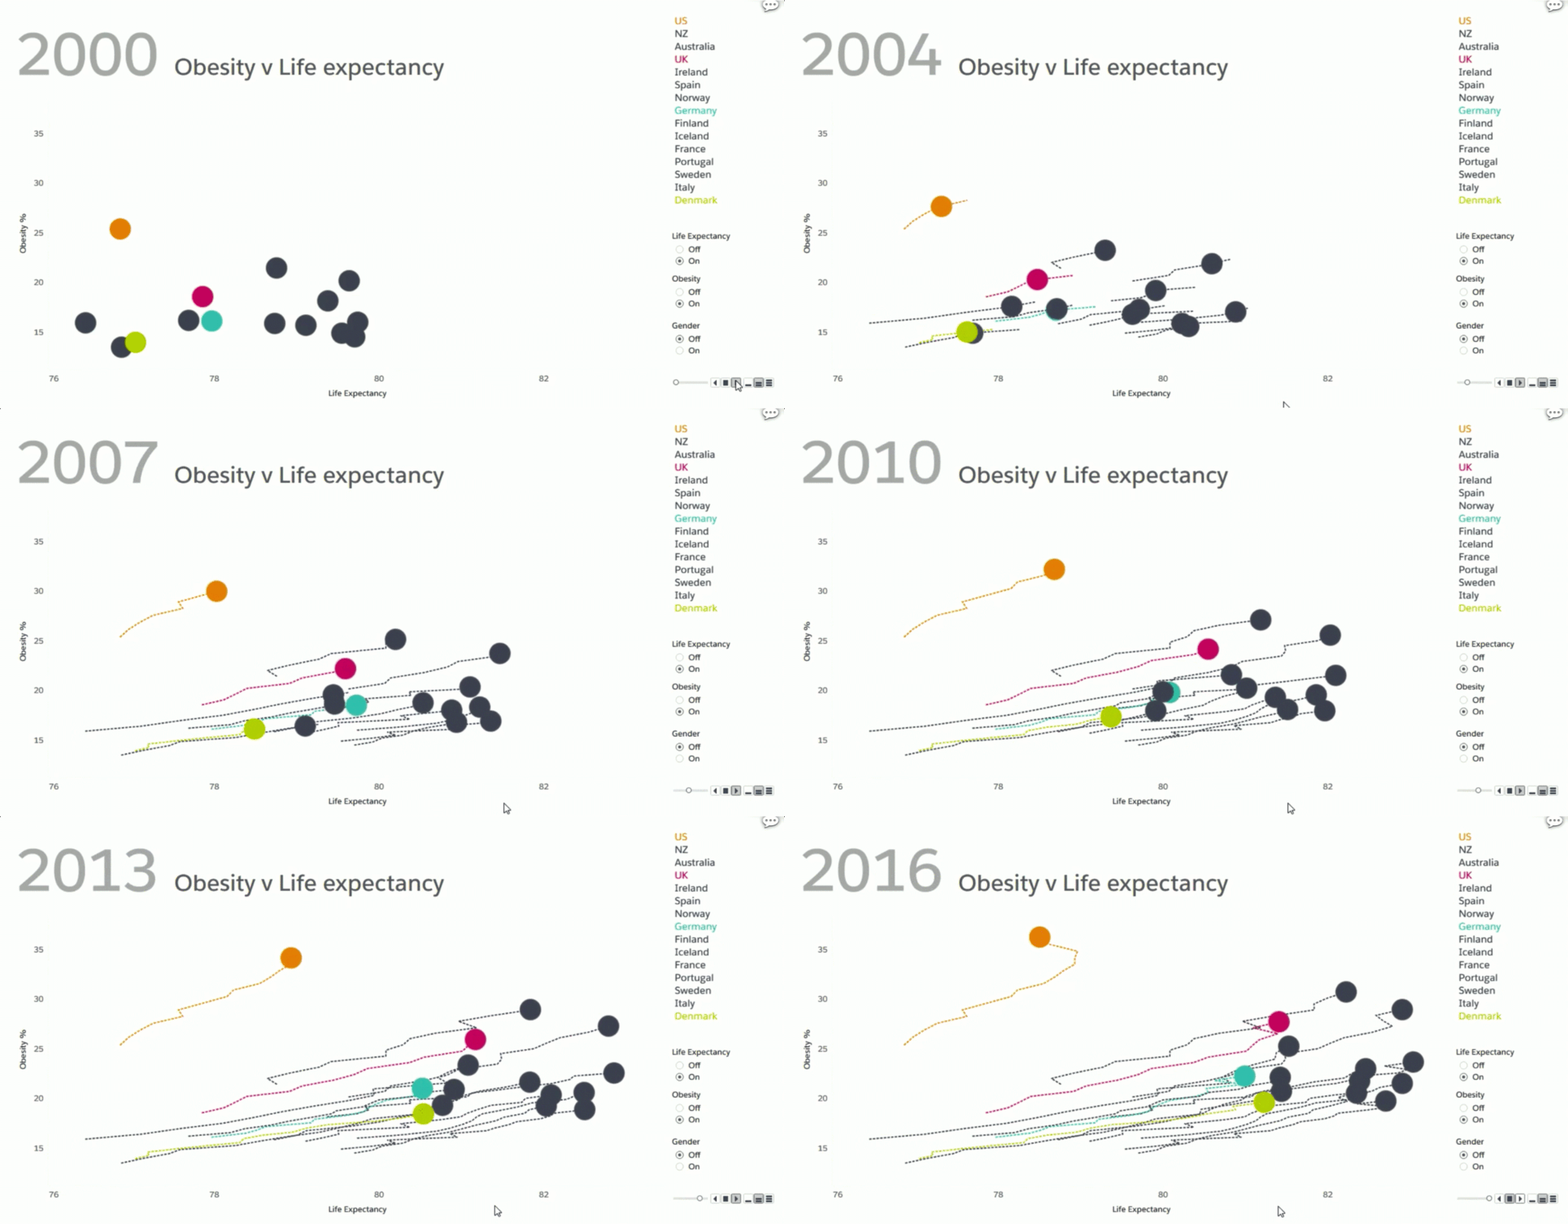
While the data set may not allow us to draw any definitive conclusions, we were able to easily pivot our analysis and find promising areas to ask further questions. And that’s part of the magic of Tableau that we wanted to shine through in our demo: Tableau offers unlimited data exploration through intuitive, visual analysis that allows people to focus on asking questions without feeling like they are learning complex software or coding.
Making powerful analytics accessible to everyone
We believe that everyone—from analysts to end users, executives to experts—should be able to harness the power of data to make better decisions faster. And we design our products to focus on people, so they can unlock the full power of their data. Tableau builds in visual best practices so people can stay focused on asking and answering questions. Users can think with their data, easily explore hunches, and quickly pivot their exploration without hitting any dead ends. We always focus on making the complex simple. Powerful analysis is possible with intuitive actions as simple as dragging and dropping, double-clicking, or even typing questions with natural language. Ask Data, our natural language offering, helps to lower barriers to analysis so that anyone can ask questions of their data. In the recorded demo, David showed how even nuanced questions could be answered with no more expertise than typing a question—Tableau responded to “year over year change in average life expectancy in the US” with exactly the data we wanted to see.
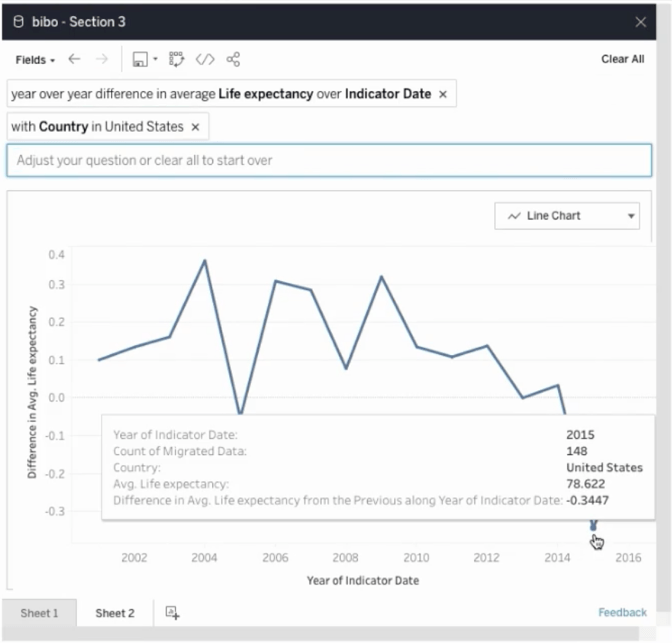
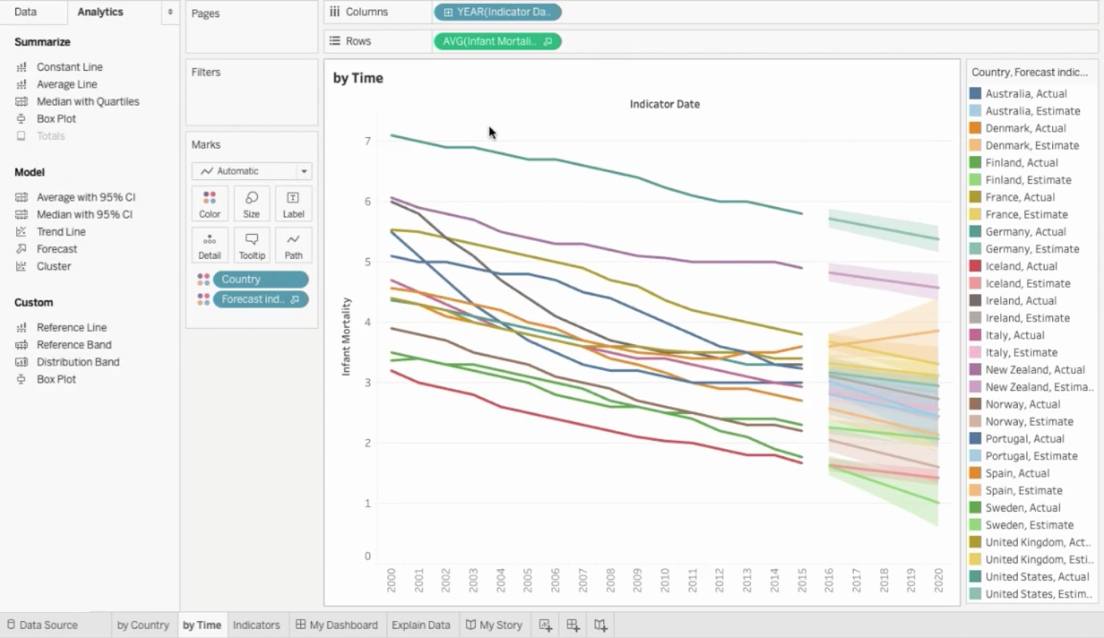
Tableau brings advanced, statistical analysis to users with a single click. Employing predictive analytics is as simple as dragging and dropping to forecast trends, like declining infant mortality rates. Narrowing analysis to certain regions is as simple as using a lasso tool on the world map. This is how we discovered that access to antiretroviral drugs is one of the most important factors for life expectancy in Europe, versus the tragic impact of deaths due to natural and semisynthetic opioids for the United States.
Building trust and sharing insights
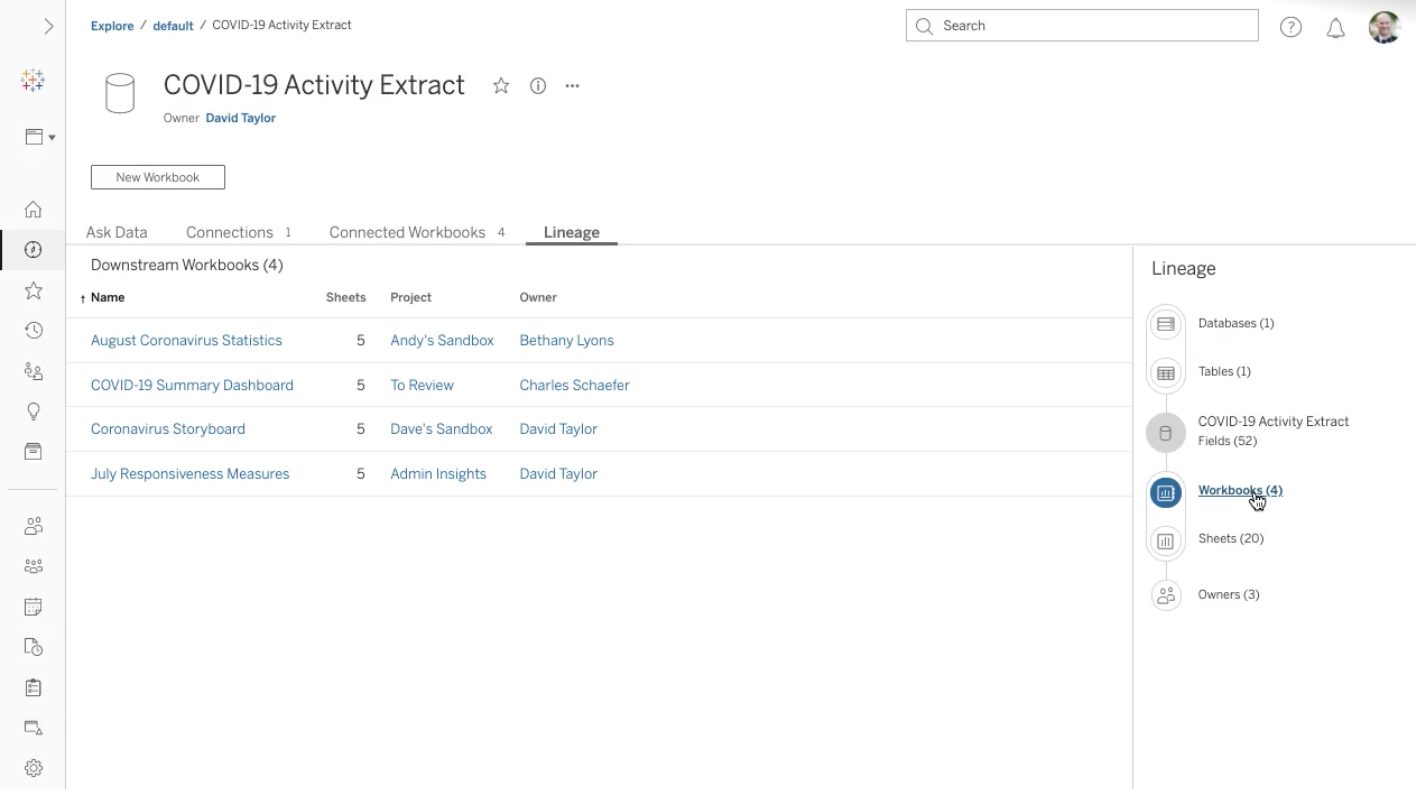
Trust is critical to reaching analytics ubiquity—how will people across the organization know they can trust the data they're seeing? We showed how Tableau Catalog helps people better trust their data by bringing key information such as certification, data quality, business glossary, and more directly into the analysis experience. Looking at the data source’s lineage, we were able to identify all of the upstream and downstream assets and their owners, providing a fast and simple impact analysis should a column in the database change.
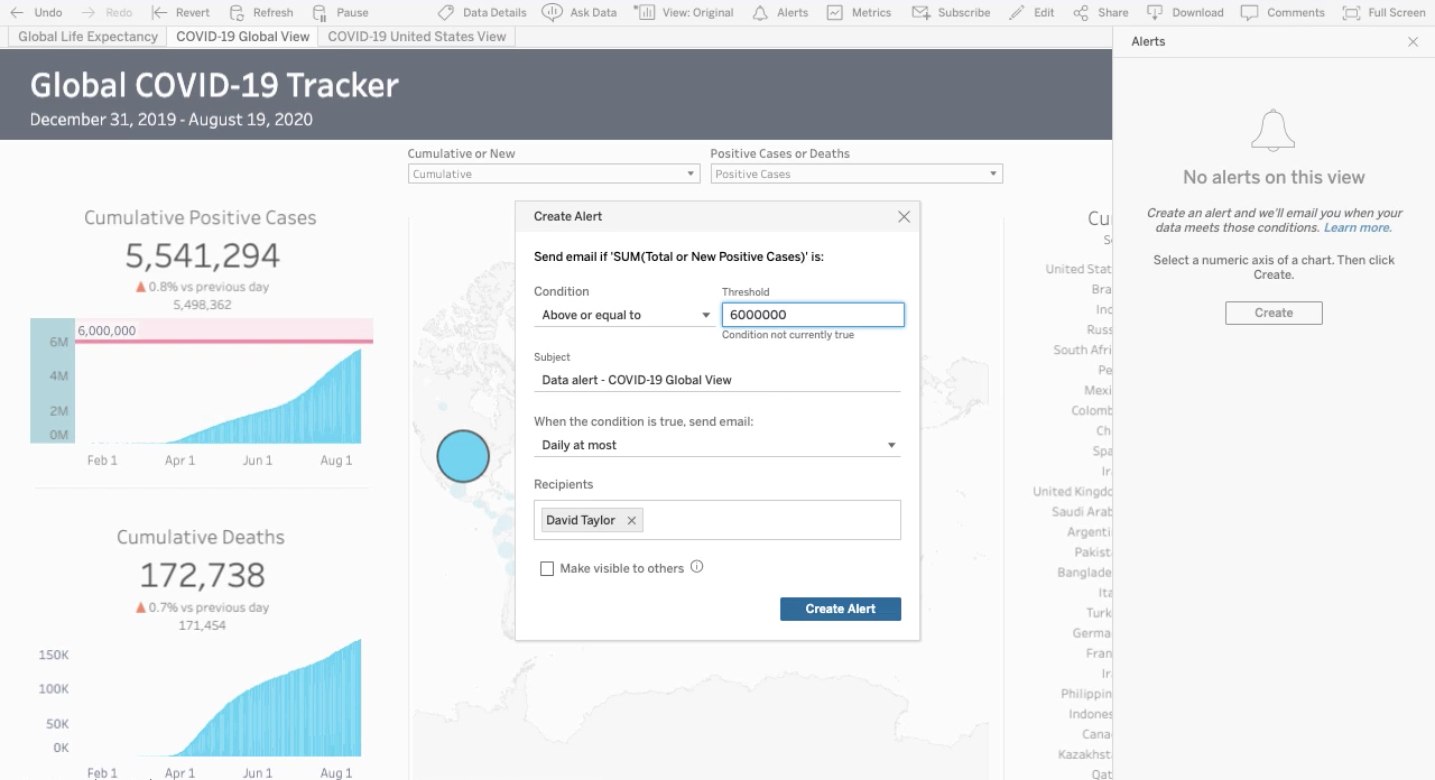
With Tableau, it’s also easy for folks to stay informed of changes in the data they care about. Anyone can subscribe to relevant dashboards and reports to receive scheduled email updates, including PDF attachments and images that link to the full, interactive dashboard. Recipients receive personalized versions of a dashboard based on their security and permissions. Users can also subscribe to KPI alerts, which send a notification when a measure reaches a certain threshold—for example, in the recorded demo, David set up an alert for when the US cumulative COVID-19 cases reach 6 million in the demo recording.
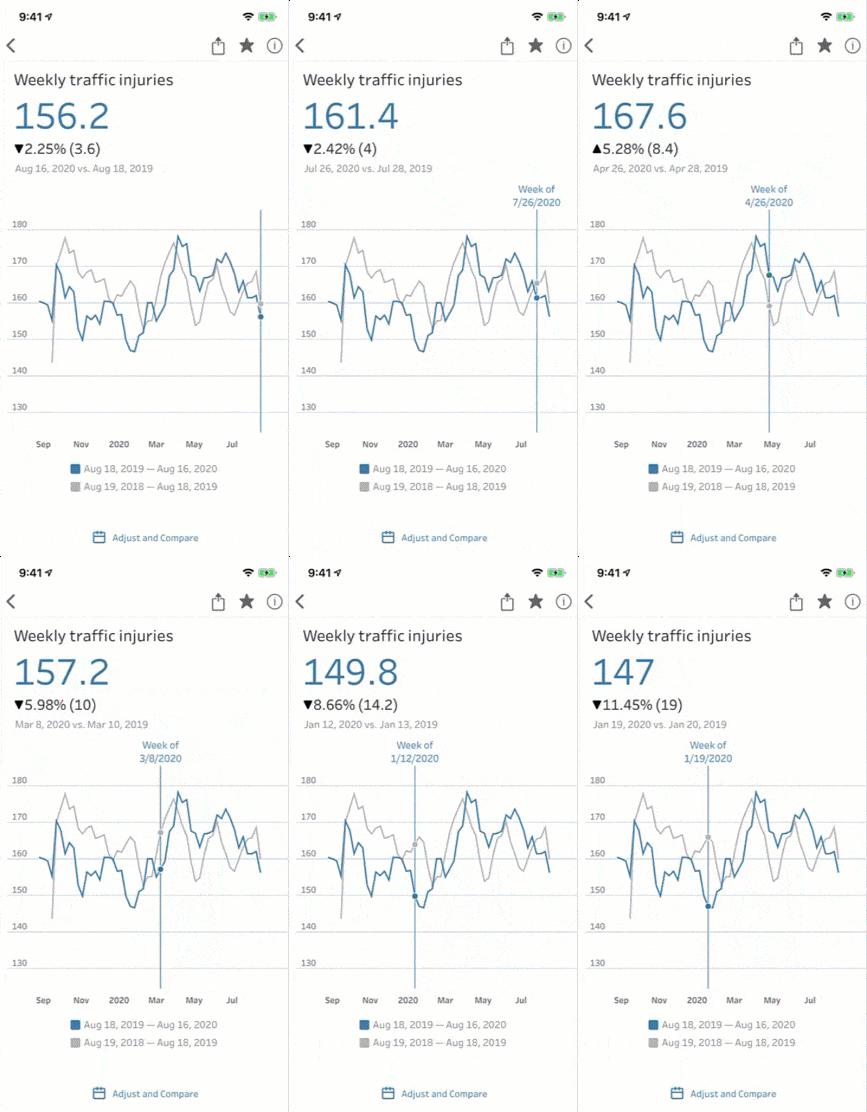
Another way to centralize and monitor important data is with Metrics, released earlier this year. Optimized for mobile, metrics provide an at-a-glance digest of KPIs from across dashboards and projects. It’s fast and easy for any user to see the current status of all their favorite indicators, and to also scrub through changes over time, as we demonstrated in a comparison of traffic accidents between two years of data.
Expanding self-service with smart, visual data prep
Data preparation is a critical part of analysis, and the BI Bake-Off. And our approach to self-service data prep is uniquely direct, visual, and smart. We showed how Tableau Prep Builder uses AI to automatically profile data, identifying data types like country names, postal codes, dates, and more. Smart recommendations offer users help with cleaning data at every step. For example, during a union in the demo, Prep recognized the columns containing the same type of data, even when the headers didn’t match. And with fuzzy matching, Prep automatically grouped country values with spelling differences.
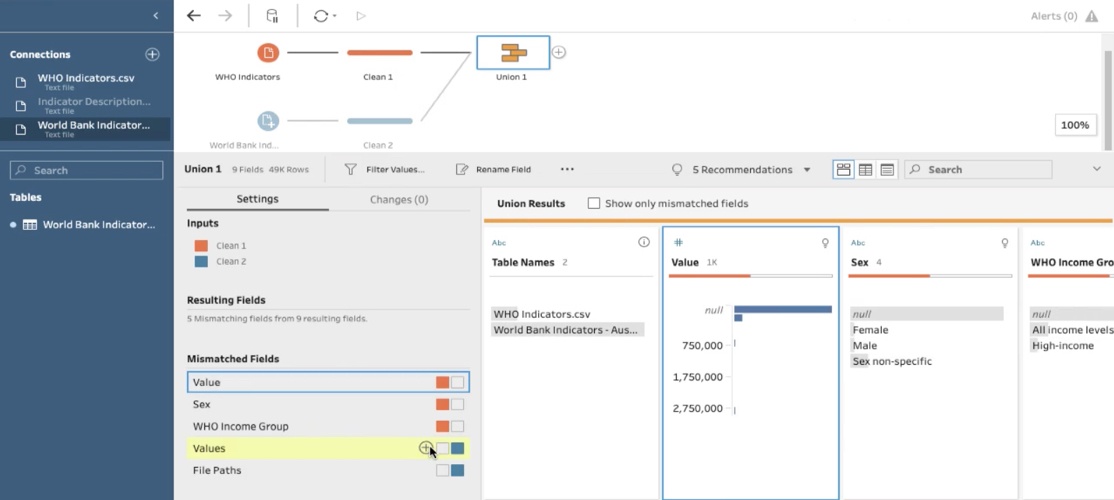
Tableau Prep supports custom R and Python scripts to execute advanced operations, including predictive modeling, directly in the prep flow. Users can harness the full power of data science tools to transform the data, look up additional information in remote sources, or even run complex machine learning pipelines on top of the inputs. Reusable steps allow people to reduce redundant work done across multiple flows and share their saved steps with others in the organization who use Tableau Prep.

Finally, with the output step, Tableau Prep Builder can now write to external databases, making the prepped data available for use with other applications outside of Tableau. (This was one of the most highly anticipated features that our customers asked for!) And with Tableau Prep Conductor, users can operationalize the prep flow on a schedule so that the data is always kept up-to-date and in the best shape for analysis.
Using data to change the world
Experiencing the BI Bake-Off virtually, like so many events this year, reminds us of the importance of data in navigating the constant uncertainty of our present situation. Democratizing analytics means helping everyone to make informed decisions and navigate change—and our world is experiencing change like never before. We’re proud to work with amazing partners, experts, and community members to help people see and understand data in the face of the global pandemic—our COVID-19 Data Hub has more than 400 million views, used by governments to inform their citizens and organizations to make important decisions about reopening workplaces safely. If you want to learn more about Tableau, how our customers are using modern analytics, and to be a part of conversations with the largest data community in the world, we’d love for you to join us part for Tableau Conference-ish—it’s completely virtual, and free! Learn more and register today.
เรื่องราวที่เกี่ยวข้อง
Subscribe to our blog
รับอัปเดต Tableau ล่าสุดในกล่องข้อความ


