Tips & tricks: Alternatives to count distinct
Distinct counts are critical to analytics, whether it's counting individual patients in a hospital, the number of unique retail transactions, or the number of airplanes in a fleet. Taking distinct counts in Tableau is incredibly easy with a one-click way to change aggregations to count distinct. It is also, however, one of the more intensive calculations to perform and can be very slow, especially if you're data's huge. I'd like to share a few alternative ways to get the same answer as a count distinct.
First off, a short bit on how count distinct works. In order to find how many unique items there are in a dataset, every single record needs to be compared against every other record. This can be painful with numbers if the dataset is large enough, but particularly bad when comparing text fields and strings.
Here are eight other ways to get to a count distinct. Each has a downside as well, but in the right circumstances, can be the faster way to go. For the purpose of all of these tips, I’ll give the name ‘Dimension X’ to the dimension you wish to take a count distinct of. At the end you’ll also find a workbook that provides an example of all 8 options.
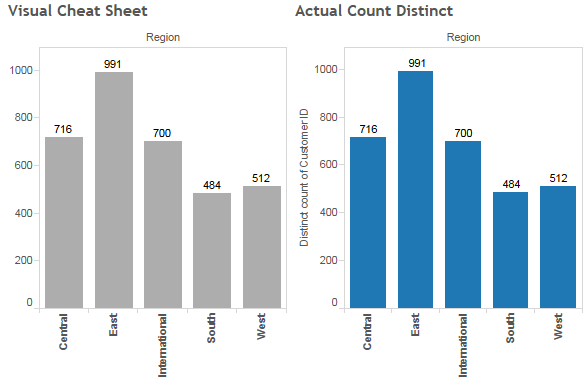
- Visual cheat sheet: Drop Dimension X onto Detail, and then put the Number of Records field onto Rows, and change it to Minimum (or MAX, AVG or Median). This will create a bunch of tiny bars (one for each instance of Dimension X), that when stacked together, the total is identical to a count distinct of Dimension X.

- Extract and aggregate: Take an extract of your data and aggregate it based on the occurrences of Dimension X. This means you can now just count, instead of count distinct, which is far easier to compute.

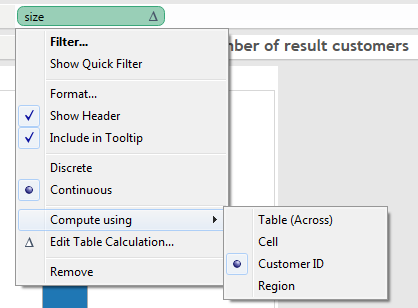
- Use SIZE(): This is similar to #1, but provides a better visual and is more flexible with other analyses. The table calculation “SIZE()” counts the number of rows in a partition. Simply type “SIZE()” into a calculated field and drop it onto your worksheet and have it compute along Dimension X (be sure to drag Dimension X onto Detail).

- Filter to a unique list: This is a simple method assuming you can filter every instance of Dimension X except one. Ideally, this also means Dimension X appears the same number of times. For example, in a survey, every respondent has to provide the same number of answers. Instead of doing a count distinct on respondents, you could first filter to one question and then do a simple count.
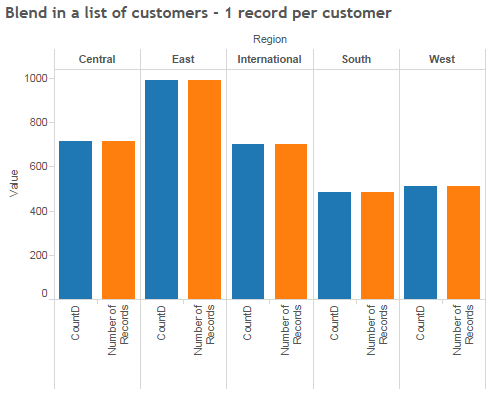
- Blend a unique list: Make a new data connection to Dimension X so that every instance is simply one row. Then, blend that data with your first data source and use the Number of Records field from the second data source. This requires Tableau Desktop 8.0.

- Write mathematical calculations: Just as it sounds, write out a calculation that will adjust Dimension X for the number of times it appears. See the sample workbook for an example.
- Modify the data model: This requires making a change to your data itself so that #4 becomes an option. Add a column or some sort of flag or indicator to the first occurrence of Dimension X. Once you connect the data back to Tableau and want to perform a count distinct, simply filter to the added indicator and do a simple count.
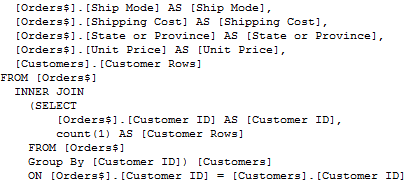
- Custom SQL: This is the least flexible option and you must know how to write SQL, which depending on the situation, could become very complex. Try using Tableau's COUNTD function first to see if this is worth the cost.

Here’s a sample workbook that provides a working example of all 8 options (courtesy Marc Rueter).
เรื่องราวที่เกี่ยวข้อง
Subscribe to our blog
รับอัปเดต Tableau ล่าสุดในกล่องข้อความ


