How data can close the education equity gap
Editor's note: Sasha Rabkin is the chief program officer at Equal Opportunity Schools. Jessica Paulson is the director of data services and reporting at Equal Opportunity Schools.
Equal Opportunity Schools’ (EOS) mission is to close the opportunity equity gap in America by getting more students of color and low-income students enrolled in Advanced Placement (AP) and International Baccalaureate (IB) classes. To accomplish this, we need to measure the equity gap in school districts across the country and work with teachers and administrators to close it.
Our efforts to desegregate opportunities are strengthened when we provide the best insights possible to educators and administrators when they’re needed most. To do this, we’ve transformed our data culture in three important ways.
Lessons learned
1. We’ve made our data actionable.

School districts will only be able to close their equity gaps if the right people have the right data at the right time. We see that happening more and more with our school district clients. One of the biggest barriers to school change is that so much of the data is “post-mortem”—looking back after the fact. This makes action challenging, but providing equitable opportunities is urgent, and waiting is no longer an option—there are too many qualified students being left across the hall from the education they deserve.
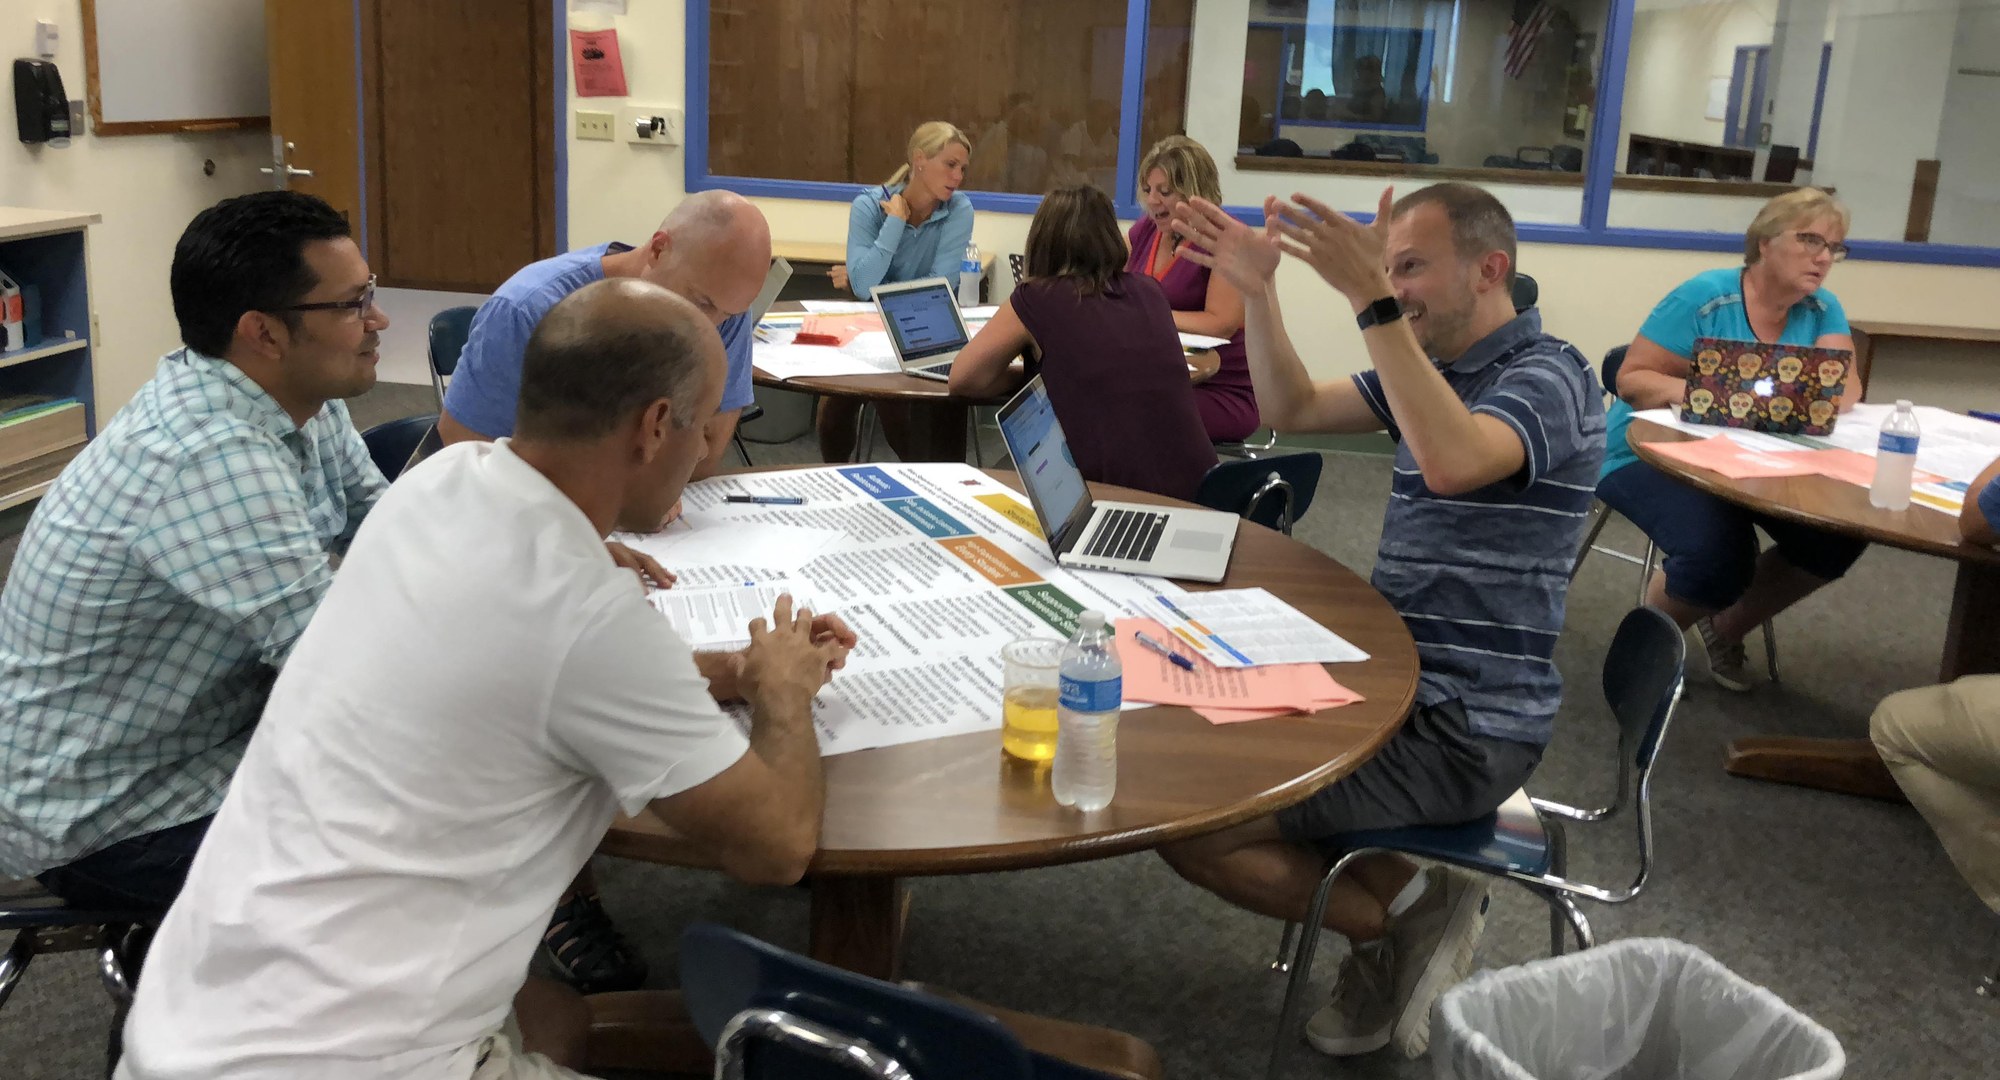
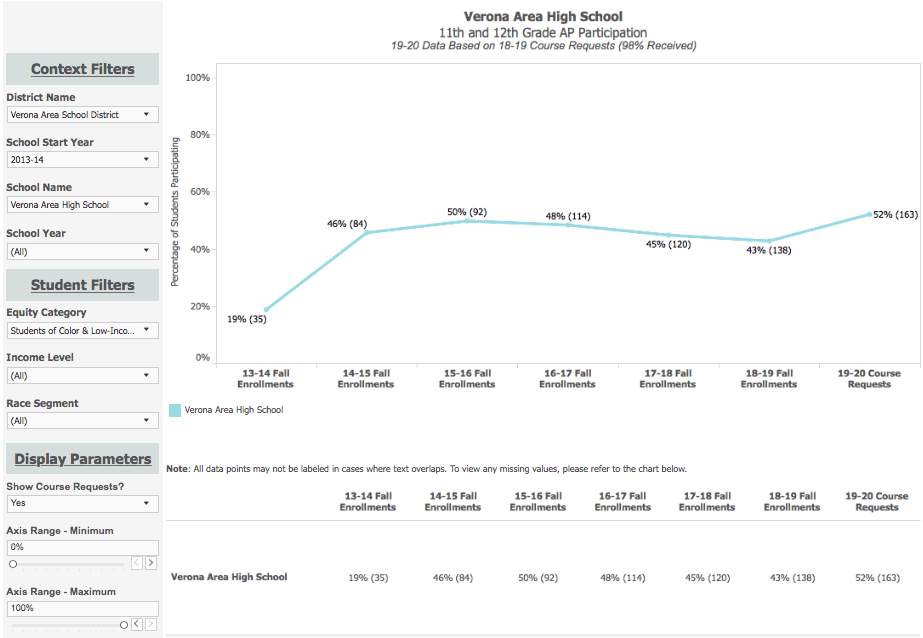
Take the example of our long-time client contact Annelies Howell. She is a teacher and curriculum and learning specialist in Verona, Wisconsin, a district that has worked with EOS since 2013. At the outset of our partnership, Annelies and her colleagues had a tough time getting the information they needed.
The Verona district wanted more frequent and in-depth information about student performance and motivations and correlations to race and socioeconomic status. Because, at the time, EOS could not satisfy these requests, Annelies pulled her own data, scrambling to do this work as quickly and accurately as she could.
Six years later, she and her team at the district can get what they need when they need it. “Now the reports are much fuller, richer, and have definitely made my life easier,” Annelies told us.

2. We can do more in less time.
The data tools we now use dramatically reduce the amount of time it takes to create reports and visuals, allowing us to rapidly respond to questions from school districts and provide rapid insights into the size and scope of their equity gaps.
In four years, we’ve scaled more than tenfold. Whereas before, one member of our team could support four or five schools, today they can support more than double that many. Amazingly, we have the same number of data and analytics folks, and their jobs are less stressful and more rewarding.
Requests for customized reports—once dreaded by our team—are now easy to fulfill, and we can produce reports not just on the equity gap but why it’s happening. To top it off, the visualizations are beautiful and bring our data to life.
3. Everyone owns the data.
EOS team members beyond our data and analytics pros are empowered to own and use data. Partnership Directors, the people who work directly with school district clients, can explore the data, and generate their own reports. This has made everyone more effective leaders and agents of change for equity.
Tracey Conrad, one of our partnership directors, is a great example. Tracey can easily create reports about her clients’ progress, and these reports sometimes contradict client assumptions.
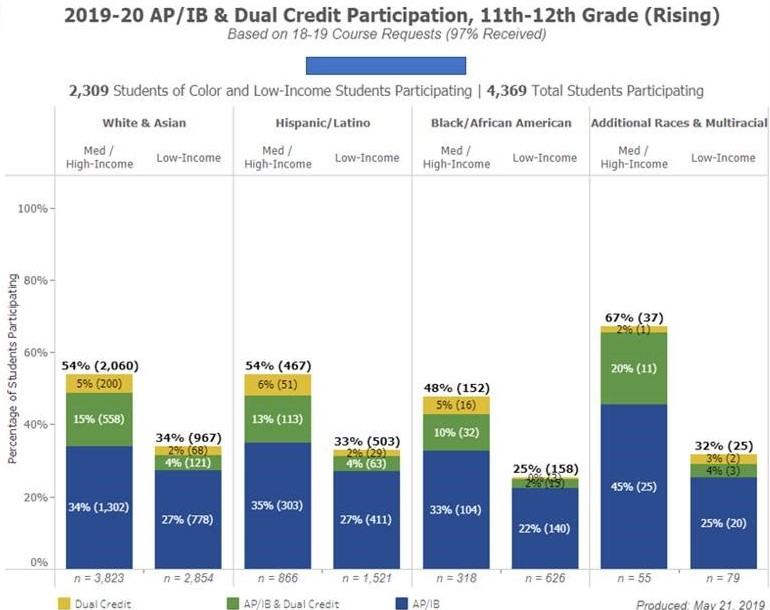
She recently consulted with a school district about AP equity, and they had questions about their dual-credit classes—where students take high school classes that count as college credit. Like AP and IB courses, many teachers and administrators assume that low-income students and students of color enroll in dual-credit courses at the same rates as other students—or even higher rates—because it can save college tuition money. But more importantly, without rapid insights into this data, it can be hard for us to push back against this misconception in sufficient measure.
“That’s a logical assumption, but it’s usually not true,” says Tracey. “Having frank conversations backed up by data is important. I can show schools that the reality of dual-credit classes is often the opposite of what they think. You can’t argue with data.” Tracey was able to show them that dual credit courses weren’t making up the gap in enrollment and that their efforts to enroll students in AP needed to continue.
Partnership directors can have these honest—and sometimes tough—conversations with school districts because they own the data.

Taking stock and looking ahead
When EOS started working with Tableau more than four years ago, we had a data problem. Our capabilities didn’t match our ambitions. Our measurement tools were prone to manual error, and customization was almost impossible.
Using Excel to input numbers manually, it took months to crank out key deliverables like our Equity Pathways reports, which help school districts understand gaps in AP class enrollment as well as perceived barriers to enrollment, drop-out rates, student aspirations, and a host of other variables. Administrators use these reports to shift how schools reach out to students and support them. Teachers use them to make classes more relevant and welcoming to all students.
The problem we’re trying to solve is dynamic—and urgent—and our data could not keep pace. But over the past four years, we’ve made incredible progress.
Thanks in part to our partnership with Tableau Foundation, we have been able to scale our efforts and act on our data in completely new ways. As of today, EOS’ school district clients have enrolled 30,000 students of color and low-income students in AP and IB classes.
But we’re not stopping there. Stronger command of our data ecosystem allows us to be creative and pilot new things. We’re constantly disaggregating data in novel ways to provide critical insights.
Our latest endeavor is to break down enrollment by subject so we can see how many underrepresented students are in STEM and STEAM classes. We also want to get the data directly into the hands of client teachers and administrators, so they have more power to act on it and to continue to use it to make students of color visible in the system. Visibility is an essential step towards providing equitable opportunities.
EOS is proud of our accomplishments and the partnership with Tableau Foundation. We are thrilled to visualize our impact and energized to take the next steps to close America’s education equity gap.
เรื่องราวที่เกี่ยวข้อง
Subscribe to our blog
รับอัปเดต Tableau ล่าสุดในกล่องข้อความ


