DataFam Roundup: September 26 - 30, 2022
Welcome! Dig into this week's DataFam Roundup—a weekly blog that brings together community content all in one post. As always, we invite you to send us your content—and the DataFam content from your peers that have inspired you! Find the content submission form here.
DataFam content
Tableau Visionary Adam Mico and Tableau Chief Product Officer Francois Ajenstat at Dreamforce
Dive into content created by the Tableau Community:
-
Nicole Lillian Mark, SELECT * FROM data; Meet the Datafam: Elisa Davis
-
Gurpreet Singh, Data Viz Canvas: Day in the life of a Data Analyst | What does a data analyst do?
-
Gaia P, Down to Earth Data Tips: How to combine Map Layers and Filter Actions in Tableau
-
Eric Parker, OneNumber - Tableau Experts: How to Tableau: Dot Plot with Average Line
-
Donna Coles, Donna + Viz: Can you create a Waterfall Pipeline using Salesforce data?
-
Jeffrey Shaffer, Data Plus Science: Secondary Axis in Tableau Without Duplicating Marks
-
Brittany Rosenau: 5 (more) Tiny Tableau Tips
-
Allen Hillery and Sarah Rodriquez, Be Data Lit: Dzifa Amexo discusses her data career journey and why you should be reading her Yelp reviews.
-
Marc Reid, dataviz.blog: Creating Multiple Axes without Duplicating Marks
-
Adam Mico: #OneCommunity
-
Adam Green, #Coffeetableviz: Knock Knock
-
Brian Moore, Do Mo(o)re with Data: It Depends: KPI Swapping with BAN Selectors
-
Kimly Scott, she will viz: Data for Good with Thi Ho
-
Andy Kriebel, VizWiz: Parameter Actions: Geographical Drill Down in Tableau
Team Tableau
Upcoming events and community participation
-
Chart Chat Live--Round 34 Watch as Jeffrey Shaffer, Steve Wexler, Andy Cotgreave, and Amanda Makulec debate the good, bad, and "scaredy-cats" of data visualization.
-
Create your first viz (dashboard) in Tableau! After two long years, no thanks to the pandemic, **WeVisualize** is back with our in-person sessions and happy to kick things off by going **back to the basics!**
- Stay up to date with the latest and greatest from the Tableau Community. We'll help you along in your Tableau journey, bring your data skills to the next level, and nurture powerful connections.
- Sign up to be a panelist for the 3charts@3 Live: A Mystery Chart Show featuring topics like personal finance, energy, healthcare and more!
Vizzes
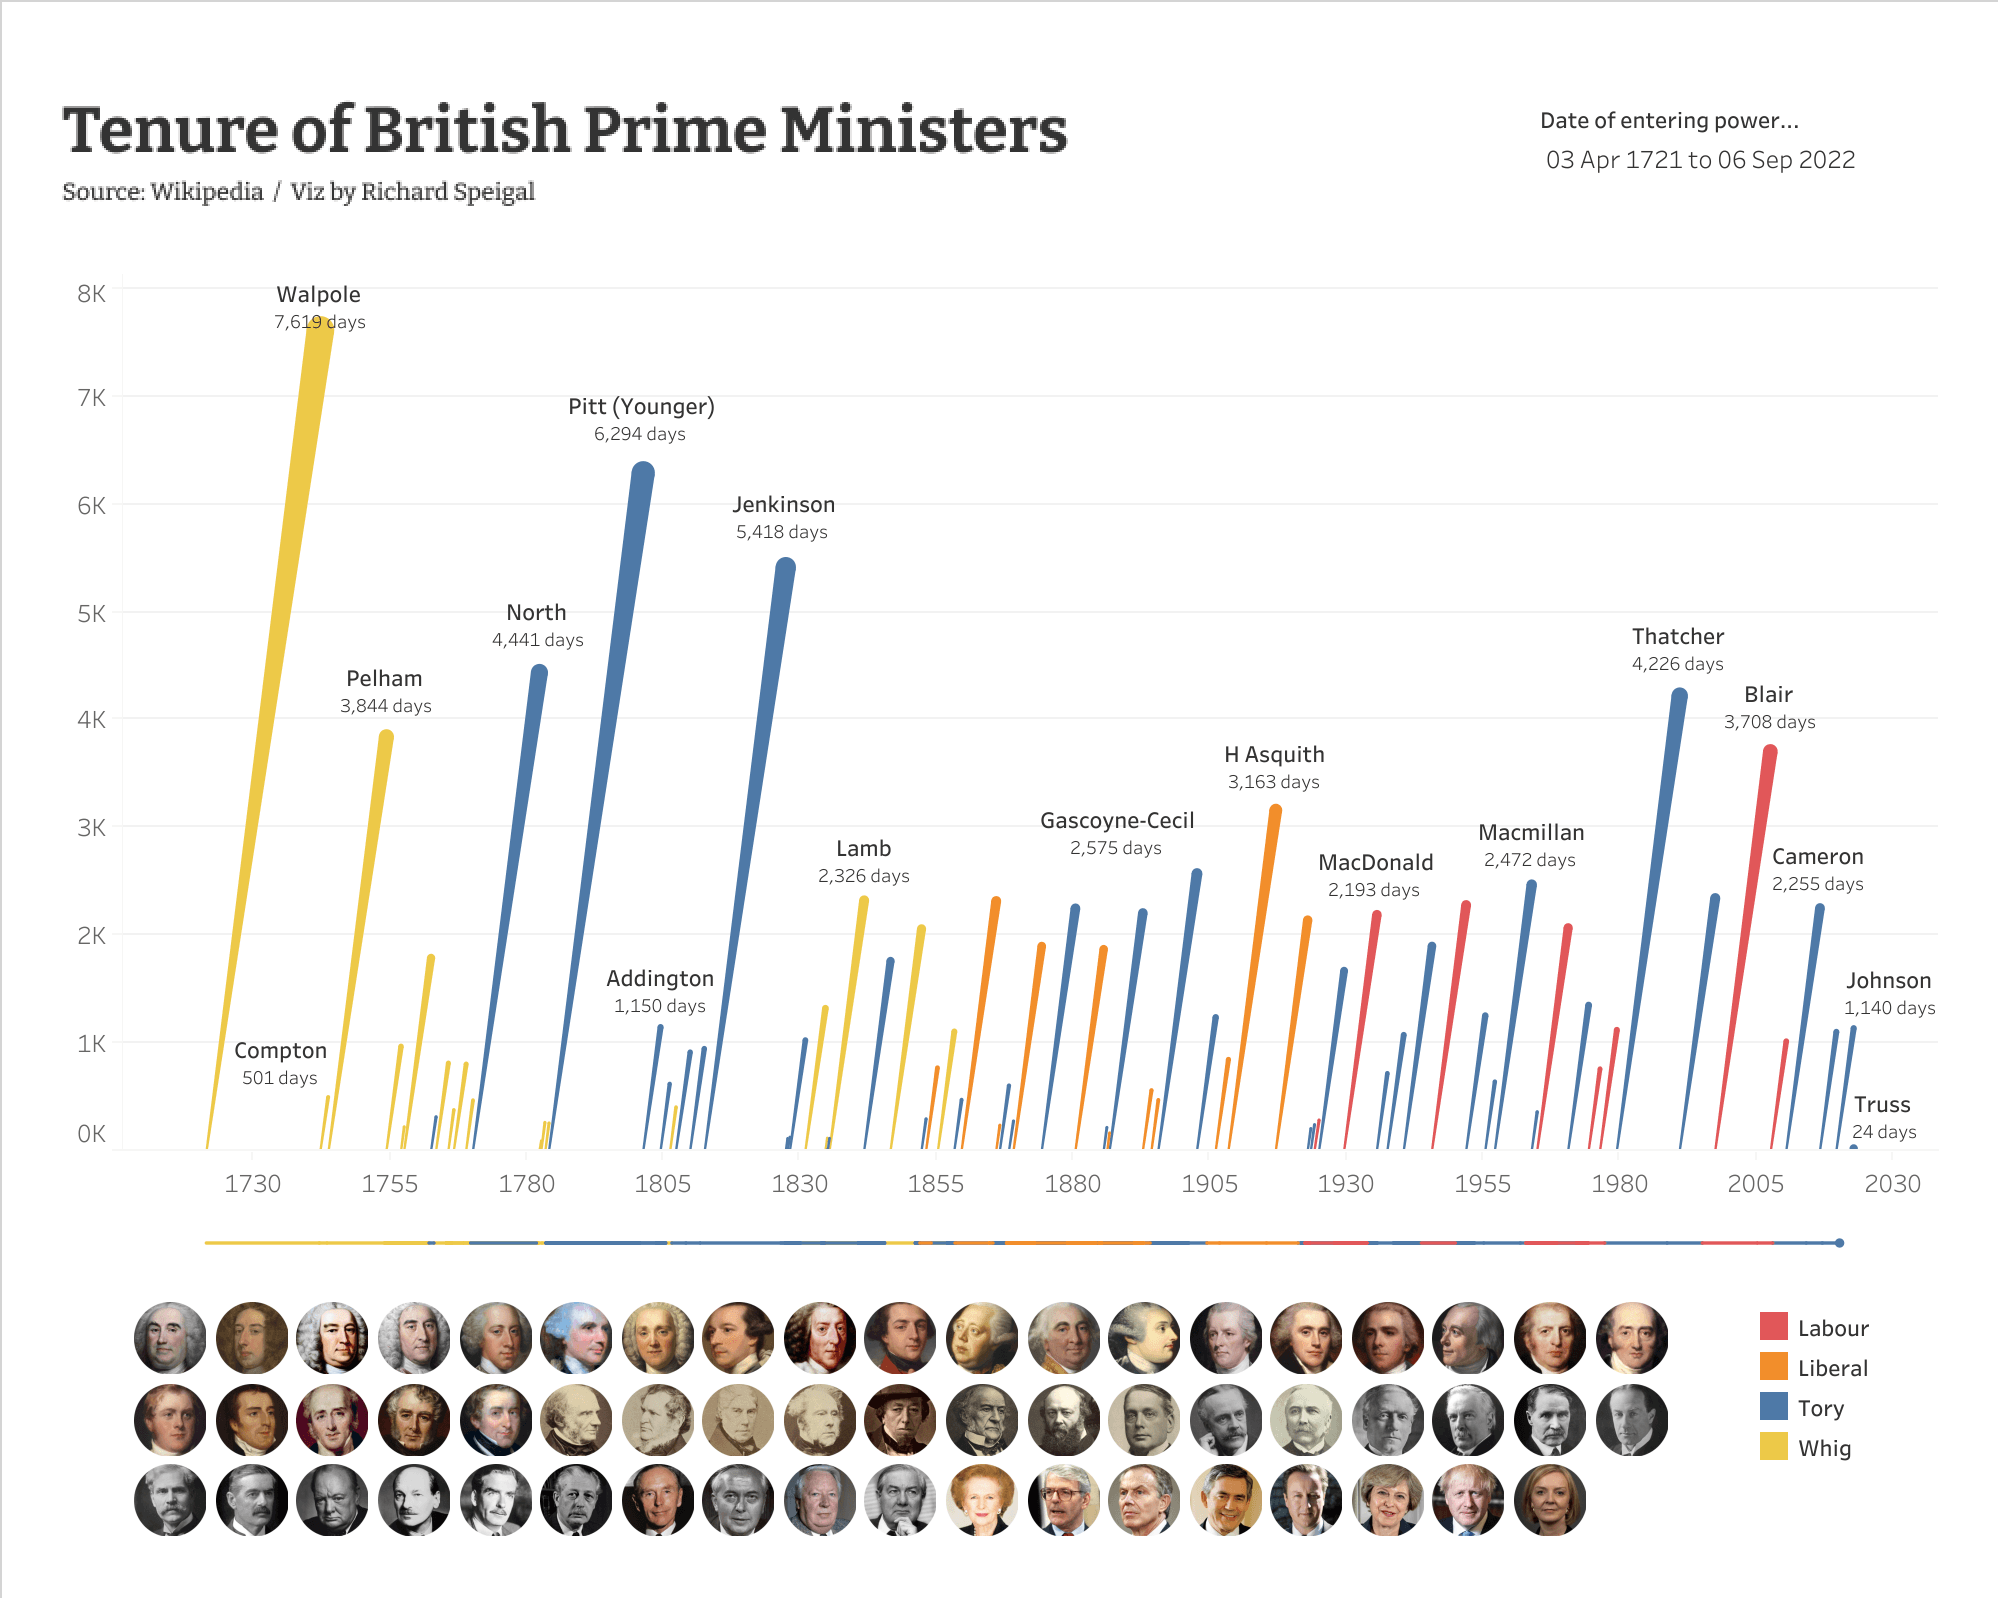
Richard Speigal: Lexis Prime Ministers
See the latest Viz of the Day, trending vizzes, featured authors, and more on Tableau Public.
Check out some inspirational vizzes created by the community:
- Richard Speigal: Lexis Prime Ministers
- Maureen Dzifa Awumee Quist: Rugrats
- Tobi Williams Babatunde: State of Water in India
- Kevin Wee 黃克文: Hail to the End of a Year (open-vs-closed overlapping bar chart)
- Naresh Suglani: Chicago | Building Ages
- Pawan Sachdeva: CSR Dashboard | #RWFD
Community Projects
Back 2 Viz Basics
A bi-weekly project helping those who are newer in the community and just starting out with Tableau. Not limited just to newbies!
Web: Back 2 Viz Basics
Twitter: #B2VB
Week 20: Change Over Time
Workout Wednesday
Build your skills with a weekly challenge to re-create an interactive data visualization.
Web: Workout Wednesday
Twitter: #WOW2022
Week 39: Where were COVID-19 Cases most active on December 30th, 2021?
Makeover Monday
A weekly social data project.
Web: Makeover Monday
Twitter: #MakeoverMonday
Week 39: Average Internet Speeds Across Europe
Preppin' Data
A weekly challenge to help you learn to prepare data and use Tableau Prep.
Web: Preppin’ Data
Twitter: #PreppinData
Week 39: Filling in for HR
DataFam Con
A monthly challenge covering pop culture and fandoms.
Web: DataFam Con
Twitter: #DataFamCon
September 2022: Lord of the Rings
EduVizzers
A monthly project connecting real education data with real people.
Web: Eduvizzers
September 2022: Detailed Years of School Completed by People 25 Years and Over by Sex, Age Groups, Race and Hispanic Origin: 2021
Games Night Viz
A monthly project focusing on using data from your favorite games.
Web: Games Nights Viz
Twitter: #GamesNightViz
September 2022: Montages
Iron Quest
Practice data sourcing, preparation, and visualization skills in a themed monthly challenge.
Web: Iron Quest
Twitter: #IronQuest
August 2022: The Tour: The Sound of Games with #DataPlusMusic
Public Policy Viz
Bridging the gap between analytics professionals and policy practitioners.
Web: Public Policy Viz
Twitter: #PublicPolicyViz
Project 1: Redlining in Pittsburgh, PA
Data Plus Music
A monthly project visualizing the data behind the music we love!
Web: Data Plus Music
Twitter: #DataPlusMusic
July 2022: The Intro
Storytelling with Data
Practice data visualization and storytelling skills by participating in monthly challenges and exercises.
Web: Storytelling with Data
Twitter: #SWDChallenge
September 2022: known to novel
Project Health Viz
Uncover new stories by visualizing healthcare data sets provided each month.
Web: Project Health Viz
Twitter: #ProjectHealthViz
August 2022: Mental Health Care Professionals Shortages
Diversity in Data
An initiative centered around diversity, equity & awareness by visualizing provided datasets each month.
Web: Diversity in Data
Twitter: #DiversityinData
September 2022: Global Women
Sports Viz Sunday
Create and share data visualizations using rich, sports-themed data sets in a monthly challenge.
Web: Sports Viz Sunday
Twitter: #SportsVizSunday
August 2022: Commonwealth Games
Viz for Social Good
Volunteer to design data visualizations that help nonprofits harness the power of data for social change.
Web: Viz for Social Good
Twitter: #VizforSocialGood
Sept 2-Sept 30 2022: India Water Portal/Arghyam
Real World Fake Data
Create business dashboards using provided data sets for various industries and departments.
Web: Real World Fake Data
Twitter: #RWFD
Session 3: Community Service Requests
SDG Viz Project
Visualize data about Sustainable Development Goals provided by the World Health Organization.
Web: SDG Viz Project
Twitter: #TheSDGVizProject
เรื่องราวที่เกี่ยวข้อง
Subscribe to our blog
รับอัปเดต Tableau ล่าสุดในกล่องข้อความ


