Build narratives in your dashboards with Story Points in Tableau 8.2
Story Points is a way to build a narrative from data. People tend to understand and remember concepts through stories. And you can tell a story with data, just as you can tell a story with text or with film. Story Points gives anyone the tools to create a narrative with data. And of course, there’s no programming required.
Let’s start by looking at an example.
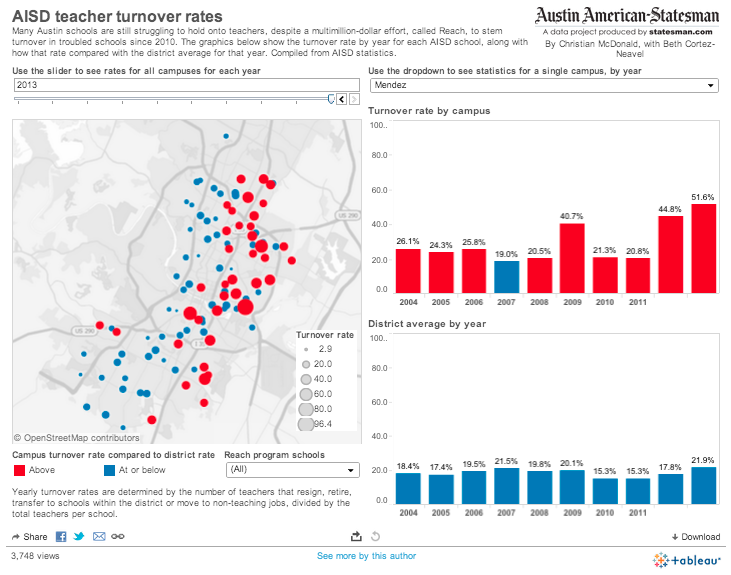
Below is a story based on data collected by Christian McDonald, a data journalist at the Austin-American Statesman. I’ve always liked the work he did here. The problem was he was forced to put a lot of thoughts into a single dashboard:

I took the concept and reworked it as a story, using Story Points in Tableau 8.2.
Story Points gives the author the ability to present a narrative. As part of that narrative, the author can highlight certain insights and provide additional context, as with the three schools called out above. The narrative structure also gives the author a chance to break the story into pieces that build on each other so the reader can consume them more easily.
Interactivity remains in the story: for example, you can choose another school’s results to explore using the quick filter on the top right of the 3rd Story Point. This lets you build a narrative and explore new threads at the same time. And Story Points update live as the underlying viz or data updates. Now that beats cutting-and-pasting images into PowerPoint!
The Story Points concept and execution was led by Robert Kosara, a Research Scientist at Tableau. You can check out some of his work at eagereyes, a blog he writes on visual communication.
Why should you spend the time to create stories with data? Because stories can communicate key insights. They can present context as well as information. And they can help people understand the key points in the evolution of an insight.
You may have noticed that Tableau Public now supports Story Points. It’s true: while the feature isn’t officially released yet, members of the Tableau 8.2 beta can now publish stories to Tableau Public. For example, here’s one done by Tableau rock star Matt Francis on sunspots:
Here's another example, this one a remake from a viz on football player transfers that made Mac Bryla in Australia mildly famous. Here it is as a data story:Tableau 8.2 will be available soon. And when it is, you can start to tell the stories in your data.
เรื่องราวที่เกี่ยวข้อง
Subscribe to our blog
รับอัปเดต Tableau ล่าสุดในกล่องข้อความ


