Tableau for Dummies: Tips to Make You Tableau-Smarter

Want to learn the ins and outs of Tableau? We’ve got you covered with a new book.
Tableau for Dummies is a great read for both beginners just getting started with Tableau as well as intermediate users looking to fill in the gaps. The book focuses on core functionality, or the foundation on which to build more advanced skills. But it also contains a chapter on advanced analytics and how to ask deeper questions of your data.
To put it simply, Tableau for Dummies is full of tips, tricks, and lessons to help you see and understand your data. Here are just five of them.
1. Don’t Wait for Your Source Data to be Perfect
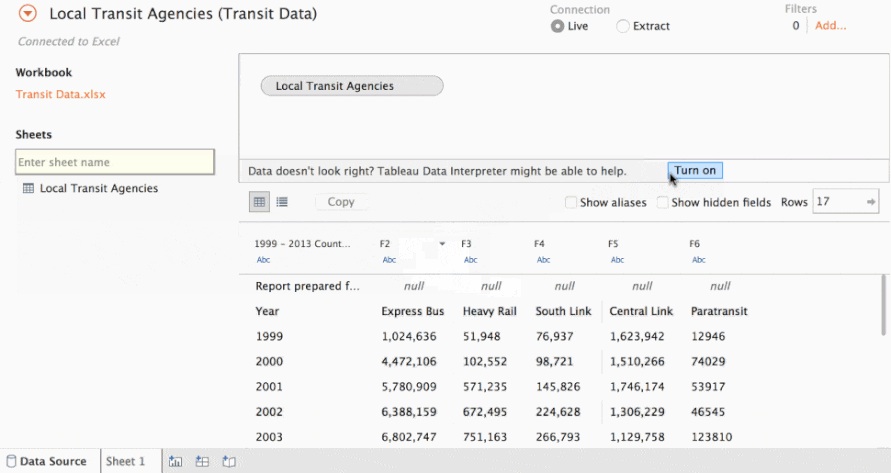
Tableau can help you identify dirty data. You can use Tableau to understand data issues quickly, then make the necessary changes to your underlying data when you have more time or resources.
Further reading:
Use Data Interpreter to Prepare Your Excel Data Source for Analysis
Stay in the Flow with Auto Data Prep
2. Reuse Data Connections
When connecting to data, there is a method that allows you to use a connection from another workbook. On the Connect panel, choose the “other files” option. Then select the workbook with the data source you’d like to use in the new workbook.
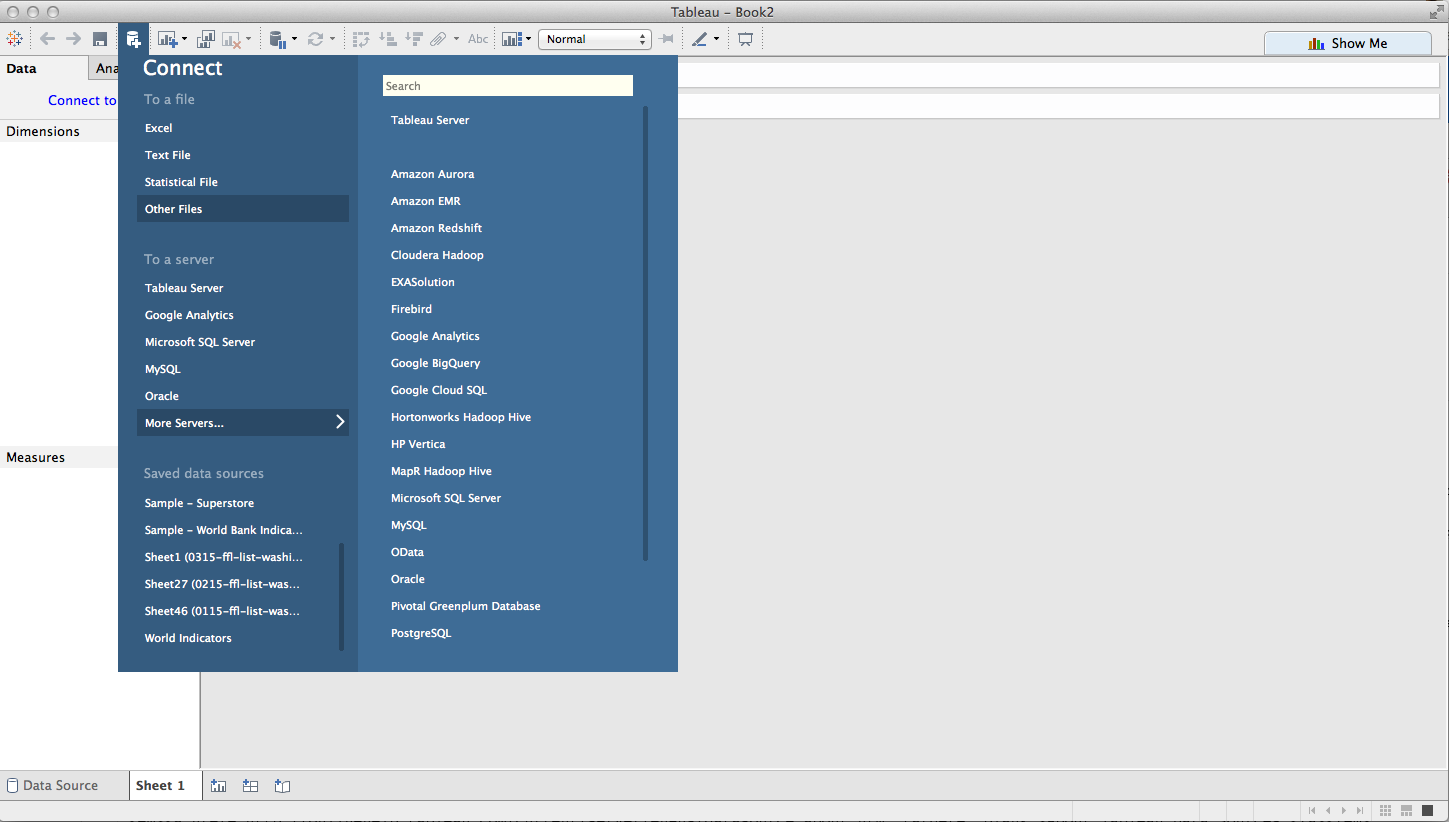
If you use Tableau Server or Tableau Online, you have even more scalable and secure options for sharing data connections.
Further reading:
3. Leverage Your Previous Work
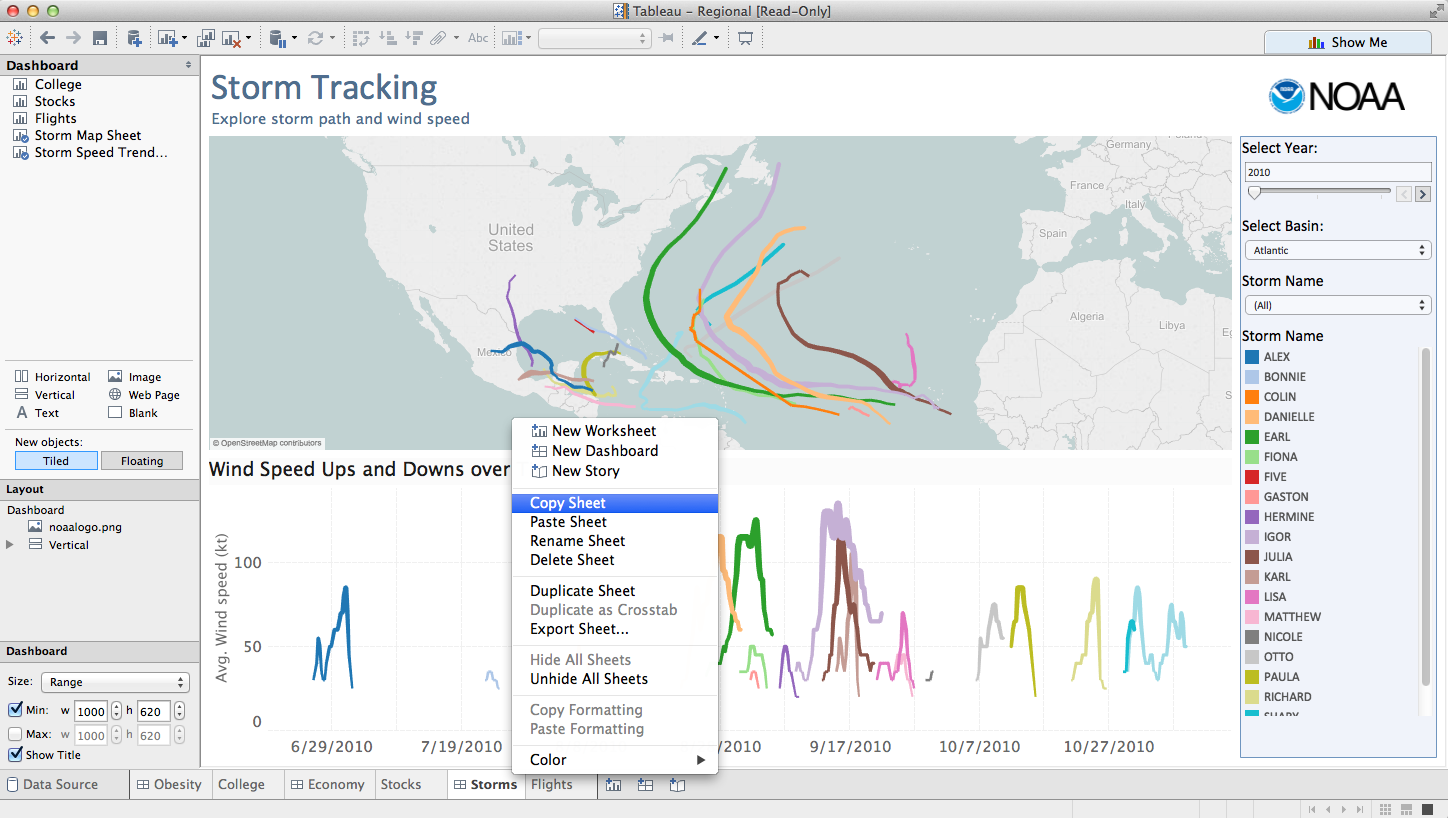
Not only can you copy worksheets from one workbook to another, but you can also copy whole dashboards between workbooks! Simply right-click on the tab of the worksheet or dashboard you want to copy, and select “copy sheet” from the menu that appears. Then right-click over the tab area of your destination workbook and select “paste sheet.”
Further reading:
4. Learn Visual Best Practices
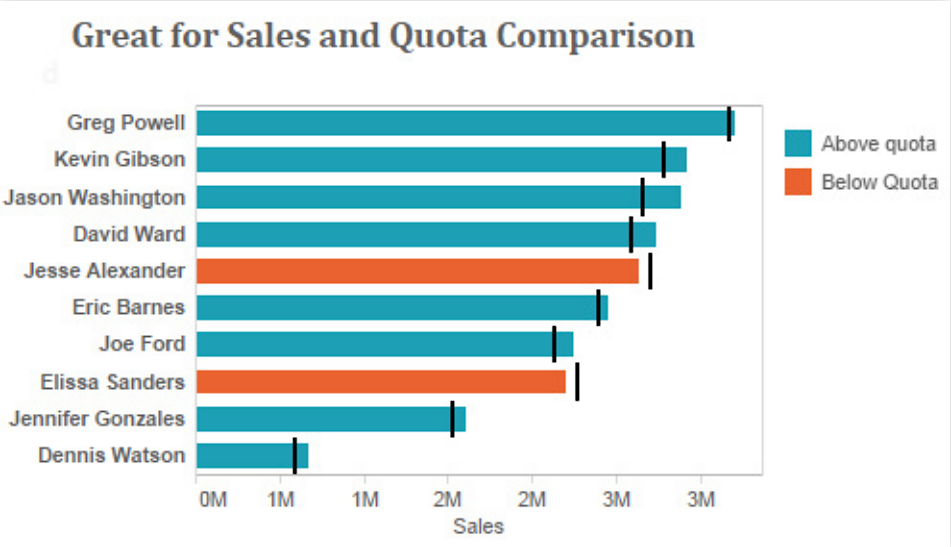
Designing for yourself is great, but take a step back and ask yourself, “Would this view make sense to anyone else?” That’s where visual best practices come in. They help you create visualizations that speak to everyone.
Further reading:
When Visualizing Data, Ask Yourself: Where Are Your Eyes Drawn?
Visual Analysis Best Practices: A Guidebook
5. Test for Performance
When you’re considering sharing your work, double-check the speed and ease of interactivity you have designed. Even if the insight is worth the wait, slow dashboards are not fun for busy users.
Further reading:
6 Tips to Make Your Dashboards More Performant
Designing Efficient Workbooks
To learn more about Tableau for Dummies, tune in to our webinar on March 23 and meet the authors, Molly Monsey and Paul Sochan.
เรื่องราวที่เกี่ยวข้อง
Subscribe to our blog
รับอัปเดต Tableau ล่าสุดในกล่องข้อความ


