Interact with public vizzes from around the world
Tableau Public is a free platform to explore, create, and publicly share data visualizations online.
Tableau Public Celebrates Pride Month
During Pride month and throughout the year, we honor the legacy and stories of the many LGBTQ+ community members. Join us as we dive into the intersection of Pride and Data Visualization—uncovering inspiring stories, meaningful insights, and creative representations that lead our way toward a more inclusive future.
Get inspired by these data visualizations from various community members and learn more about the history, social movements, resources, and more.

PRIDE

The Flags of PRIDE | #WorldPrideSydney2023
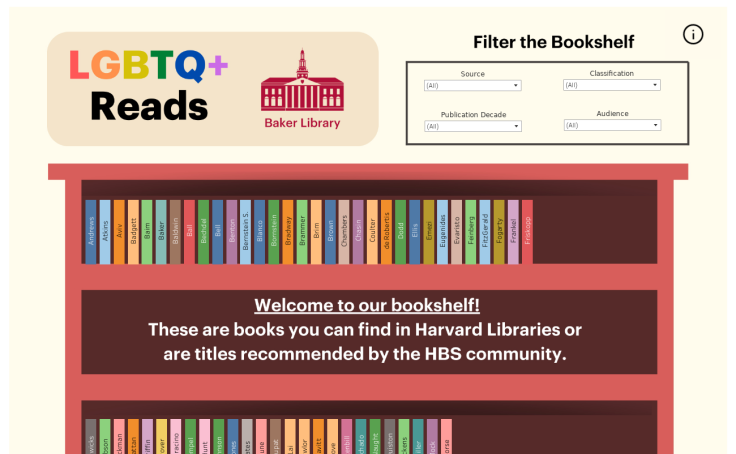
Pride Books
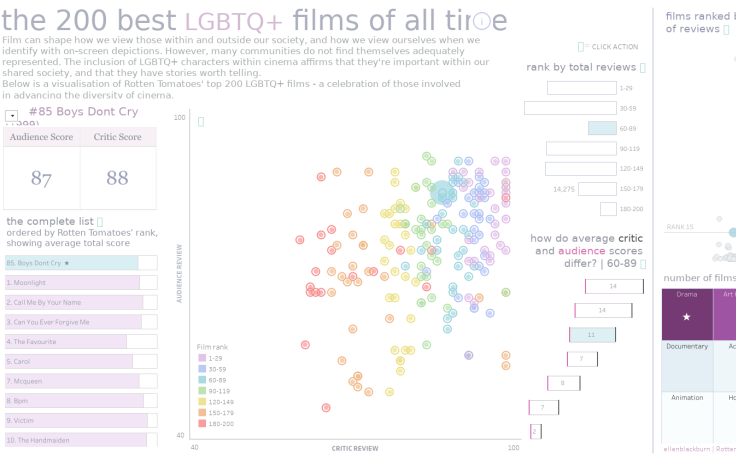
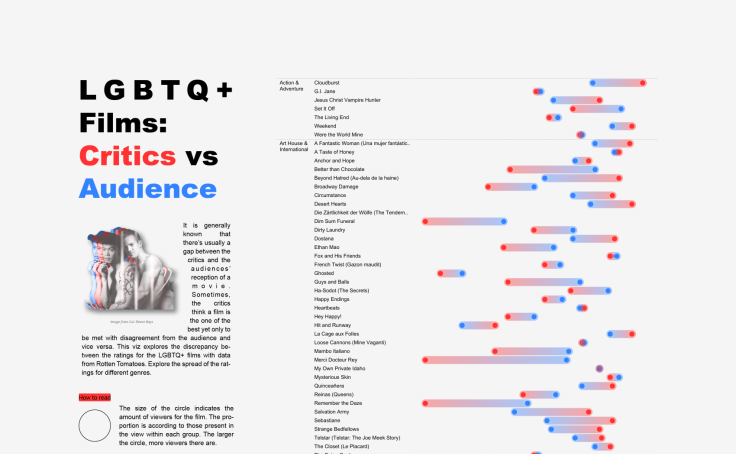
Top 200 LGBTQ+ films

The World of RuPaul
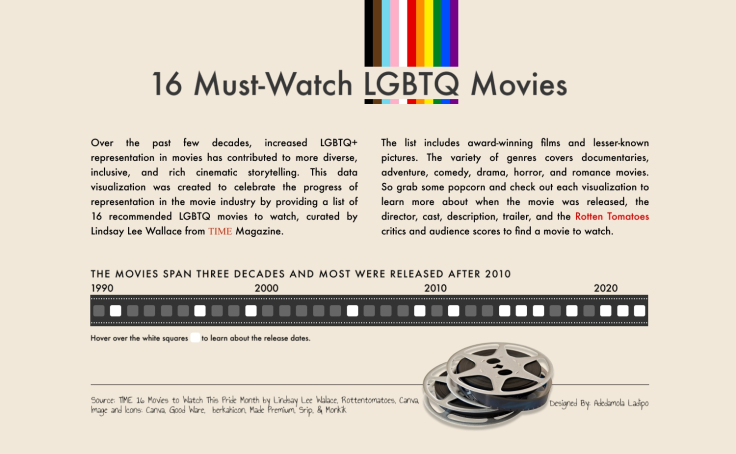
16 Must-Watch LGBTQ Movies
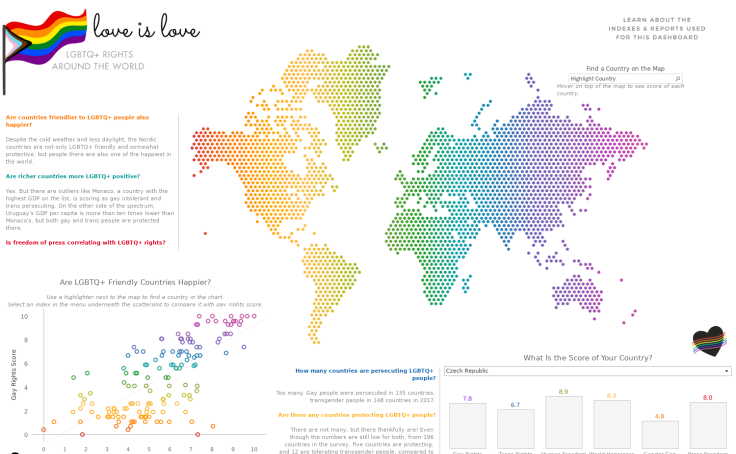
Love Is Love: LGBTQ+ Rights Around the World

Spartacus Gay Travel Index - MakeoverMonday
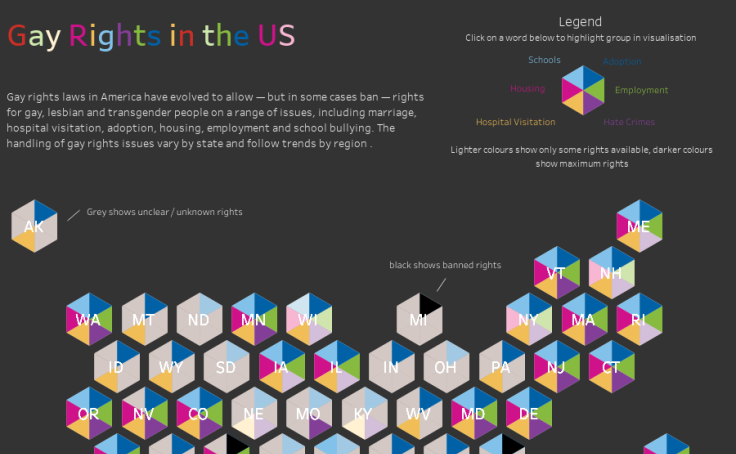
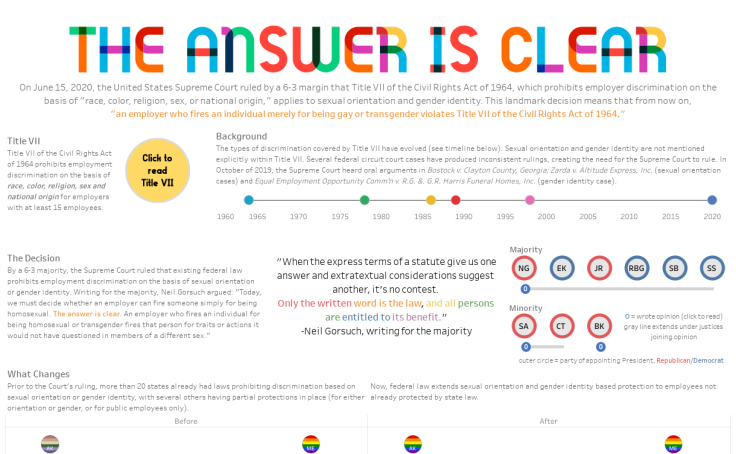
Gay Rights in the US
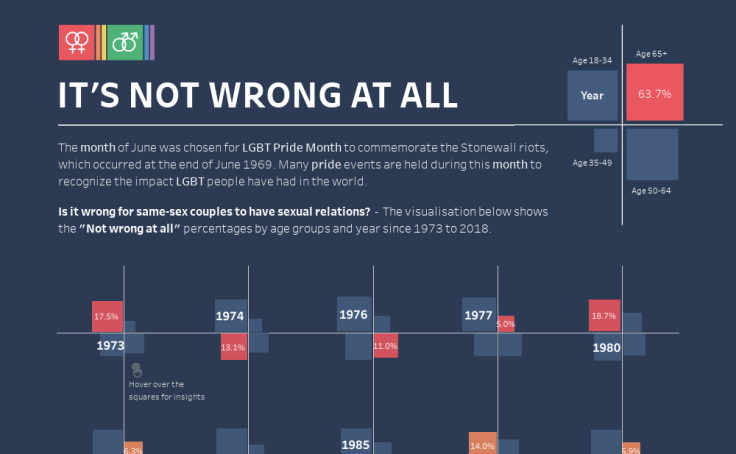
#PrideMonth: It's not wrong at all
10 Best Gay Prides in the world
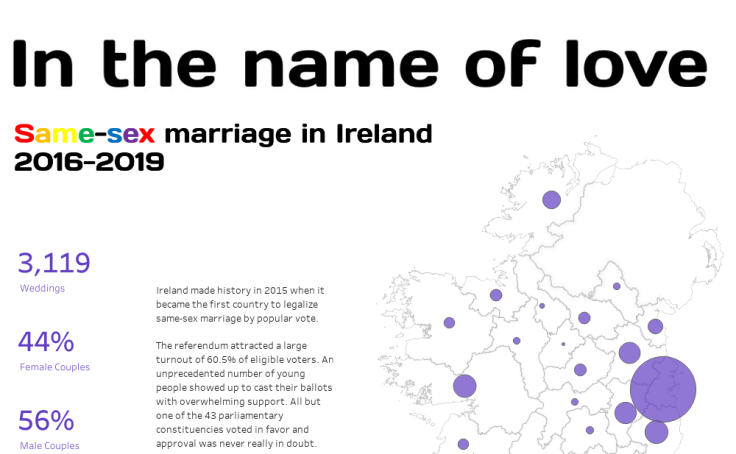
Same Sex Marriages Registered in Ireland Since 2016
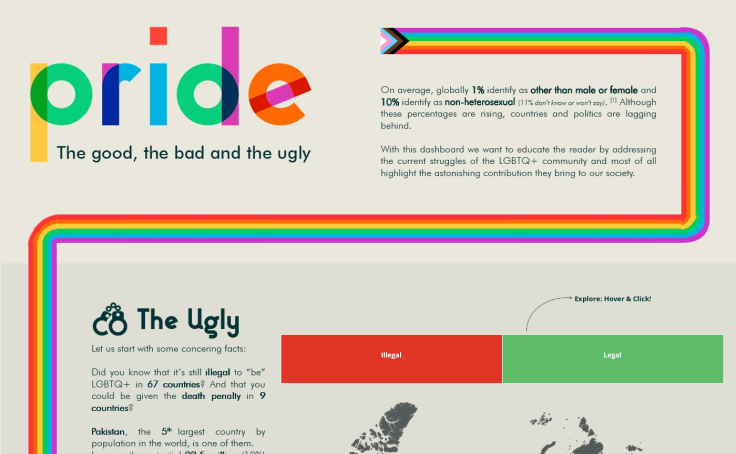
Pride - Deloitte Viz Games 2022
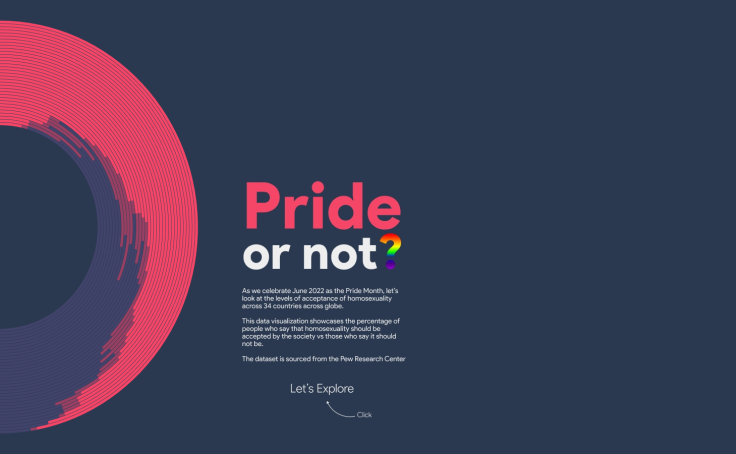
Pride or Not? | #B2VB W12
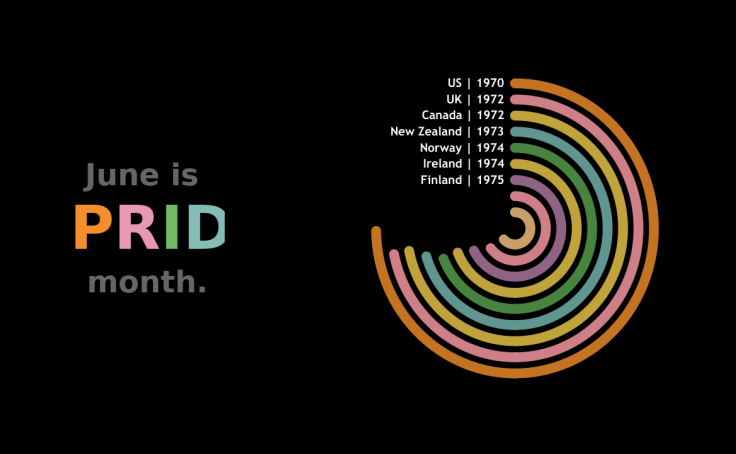
DivesityInData PrideParadeHistory
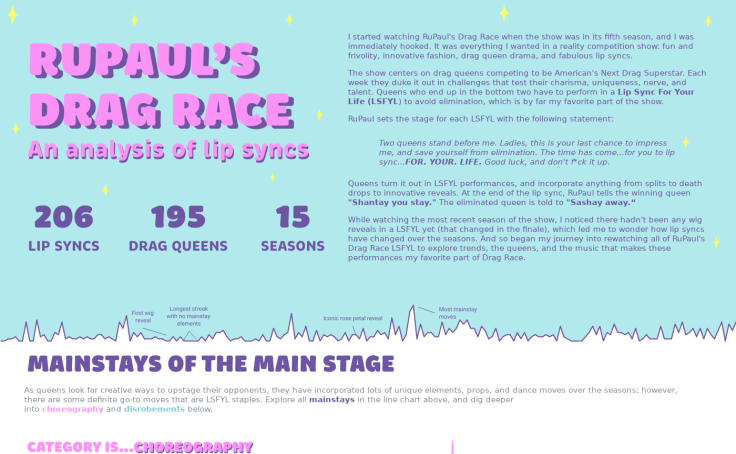
RuPaul's Drag Race Lip Syncs (Updated)
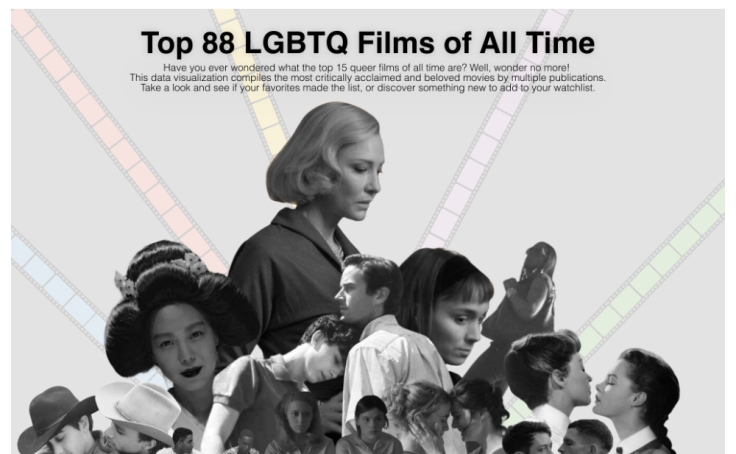
Top LGBTQ Films of All Time
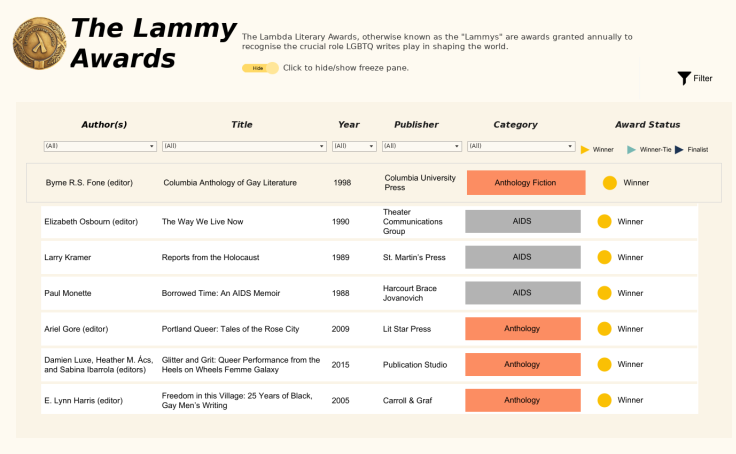
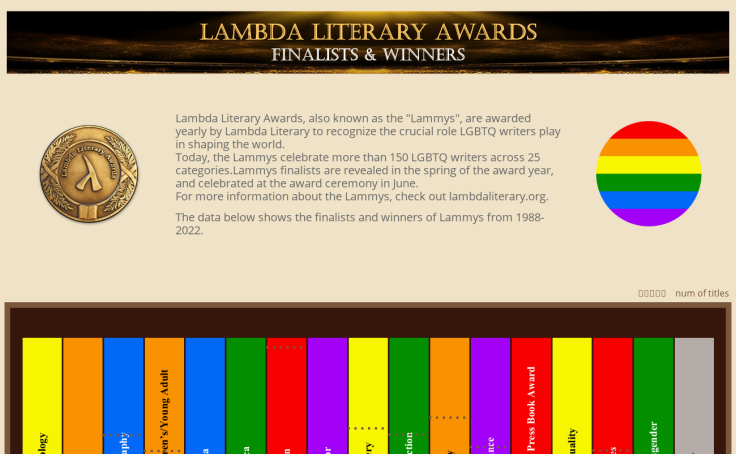
#B2VB 2023 Week 10 Table - Lambda Literary Awards Finalists & Winners

Lammy Award Finalists & Winners | #B2VB 2023.10
Lammys 1988 - 2022 | B2VB Week 10 2023
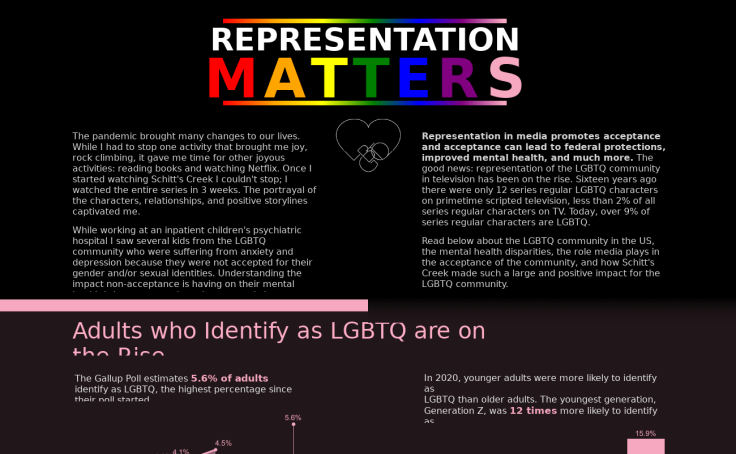
Representation Matters

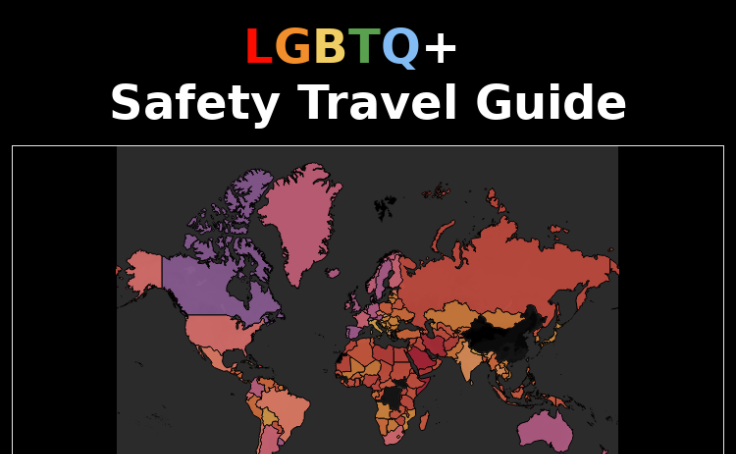
LGBTQ+ Safety Travel Guide
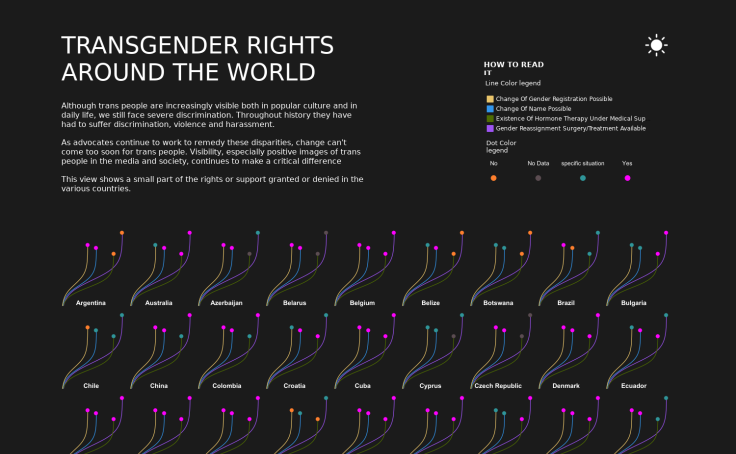
TRANSGENDER RIGHTS AROUND THE WORLD

Love Is Not Always Love: Transgender Experience in the USA
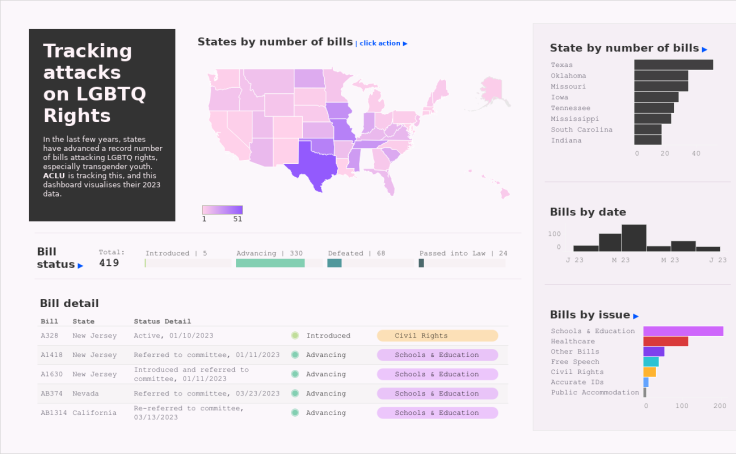
LGBTQ+ Legislation
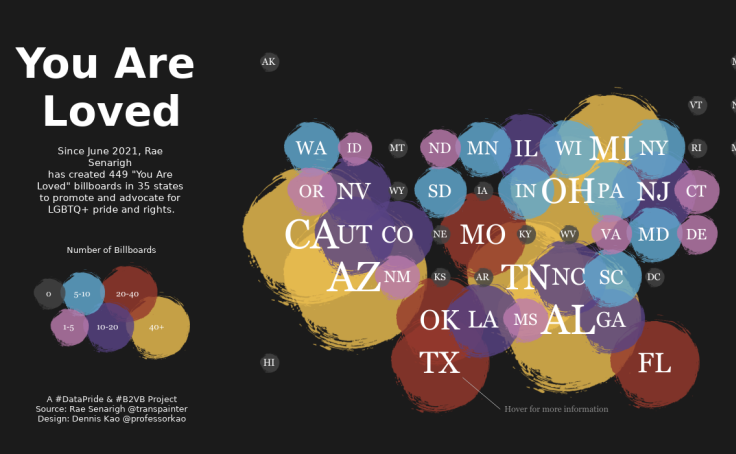
You Are Loved Billboards
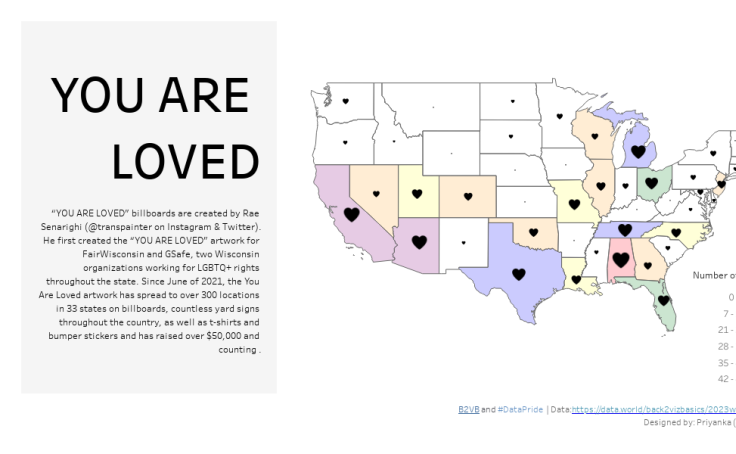
You Are Loved
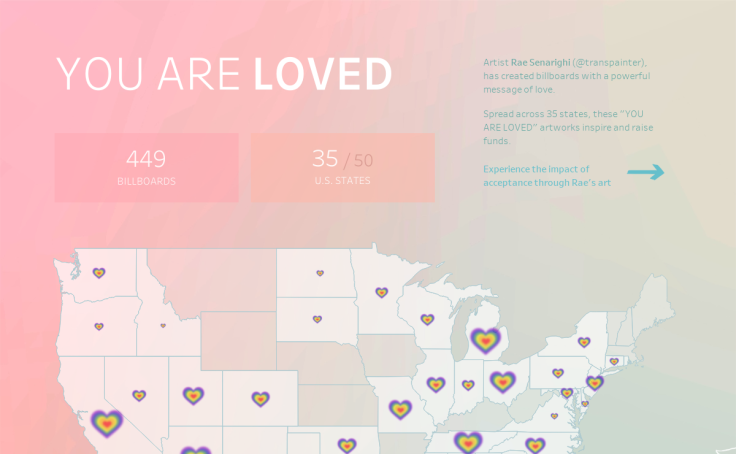
You Are Loved | #DataPride - Back 2 Viz Basics
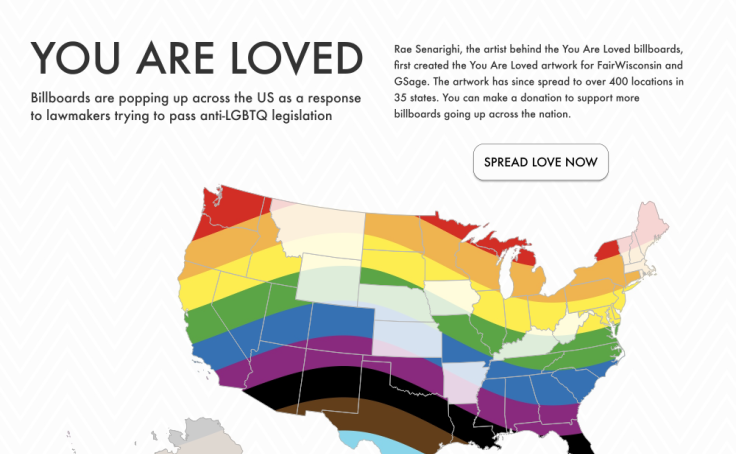
You Are Loved #B2VB 2023.11
Support and Celebrate the LGBTQ+ Community
Pride month not only celebrates LGBTQ+ voices, culture, and experiences but allows us to create visibility for under-represented groups and encourages us all to be our authentic selves. Here are a few ways to get involved in related events and projects to spread awareness and be an ally.
Join the LGBTQ+ (Data Pride) Tableau User Group
Join this virtual Tableau User Group focused on highlighting, elevating, and bringing together the LGBTQ+ community in data & its allies.
Visualize data from the Gay Games
Explore and annotate data from the Gay Games, the world’s largest LGBTQ+ sports & culture event, in this Back 2 Viz Basic challenge.
Visualize LGBTQ+ Representation in Film
Shine a light on LGBTQ+ representation in films by participating in this Diversity in Data challenge and analyzing suggested data sets.
Makeover Monday
Makeover Monday is your weekly learning and development appointment with yourself and hundreds of passionate data people. In partnership with the Data Pride TUG, Week 23 showcases the percentage of U.S. Adults identifying as LGBT. Join the challenge to work with a given data set to create better, more effective visualizations, and help us make information more accessible.
Learn MoreVIDEO (7 MINUTES)
Picture This: Doing Good Data Means Doing No Harm
This video provides a quick overview of 10 recommendations to help you understand how to present data through a more diverse, equitable, and inclusive lens. This content is also available on Salesforce Trailhead, Equity and Inclusion Guidelines for Data Visualization.
Connect with the DataFam
Follow @TableauPublic on Twitter and tag us when you’ve got something to share.