Tableau 2024.3
Tableau Cloud Manager, tabelltillägg för visualiseringar, spatiala parametrar, Tableau Cloud-appen för Microsoft Teams och mycket mer
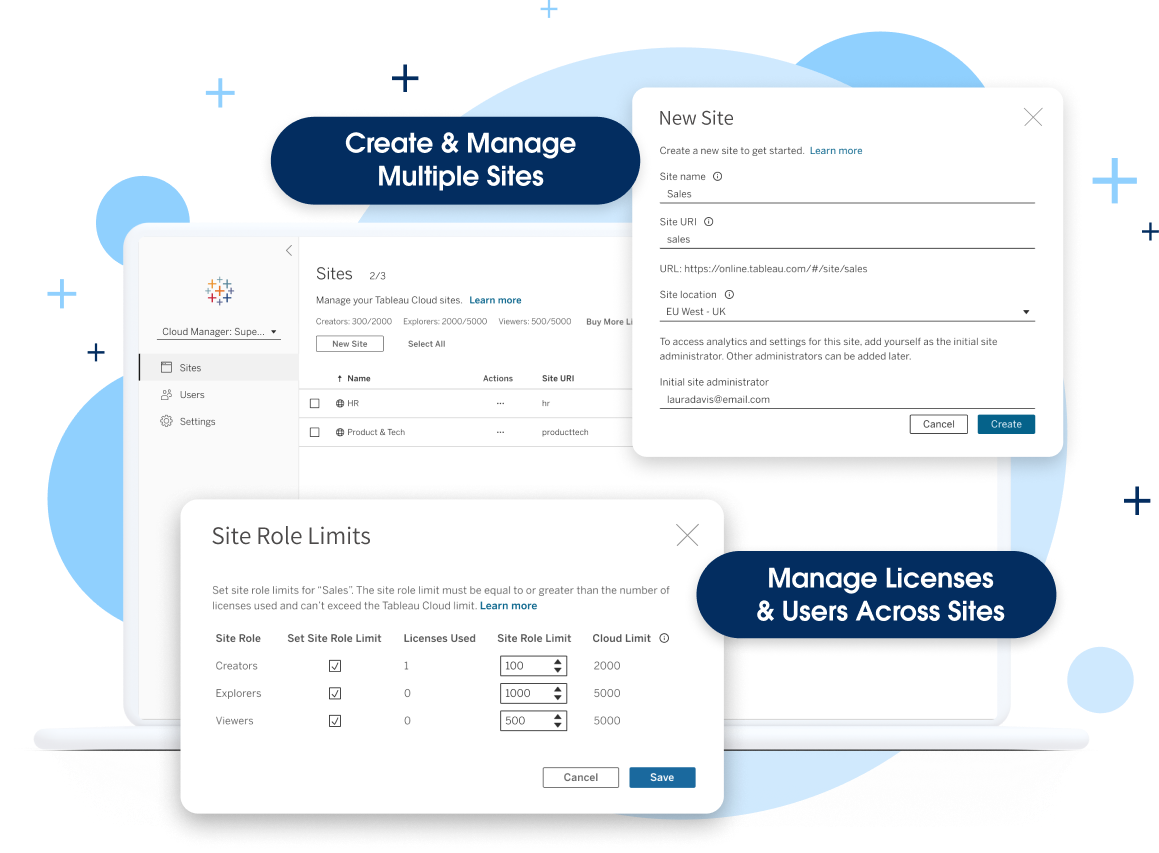
Tableau Cloud Manager
Tableau-administratörer kan enkelt utveckla och hantera sin analys i molnet med Tableau Cloud Manager. Detta förenklar expansionen och hanteringen av molnanalysmiljön samtidigt som det hjälper till att säkerställa att du uppfyller kraven på dataresidens och upprätthåller styrning.
Obs! Den här funktionen kommer att driftsättas i flera faser till kunderna. Administratörerna kommer att få ett mejl 2 veckor innan de får den här funktionen.
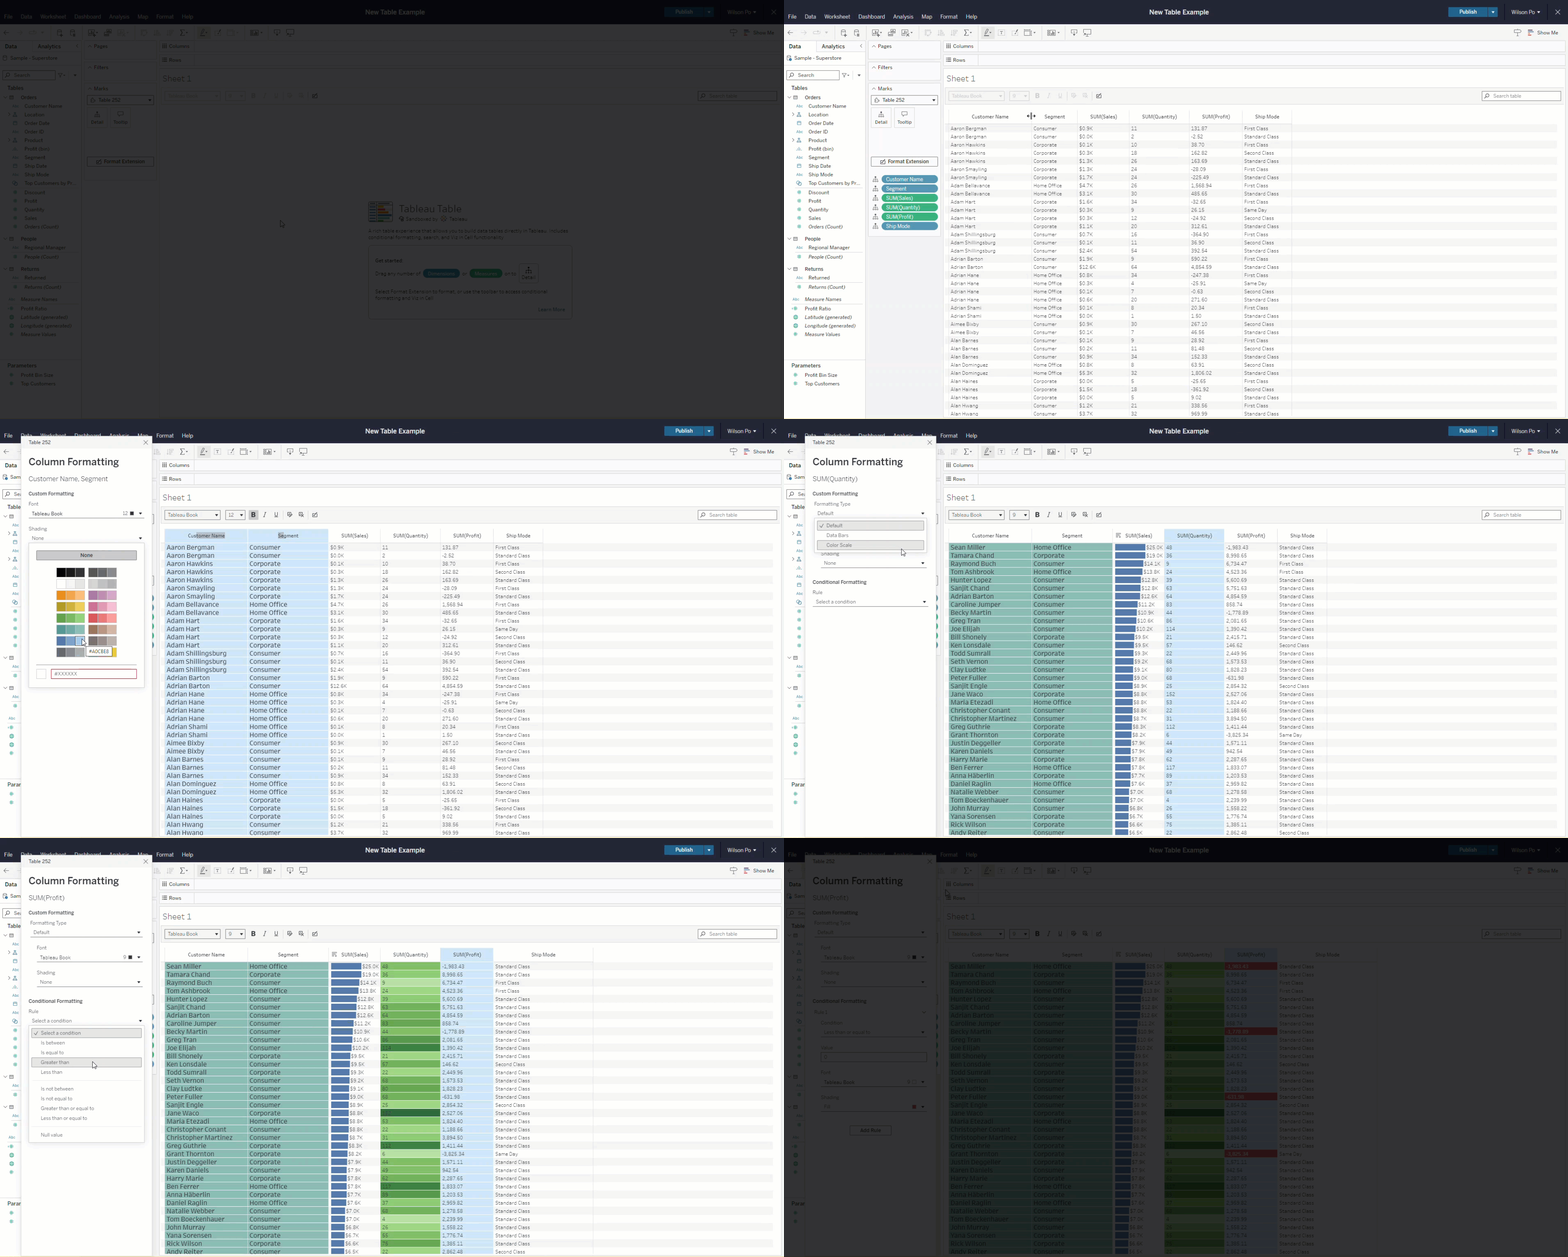
Tabelltillägg för visualiseringar
Gå från äldre rapportering till visuell analys samtidigt som du tillgodoser användarnas aktuella behov. Tabeller är viktiga visualiseringar för analytiker och hjälper dem att inspektera data som text och förmedla detaljer på en djupare nivå. Med tabelltillägg för visualiseringar kan du lägga till detaljtabeller och rutnätsvyer i dashboards för användare som föredrar traditionella rapporteringsvyer. Tabelltillägg för visualiseringar kommer att finnas tillgängliga på Tableau Exchange.
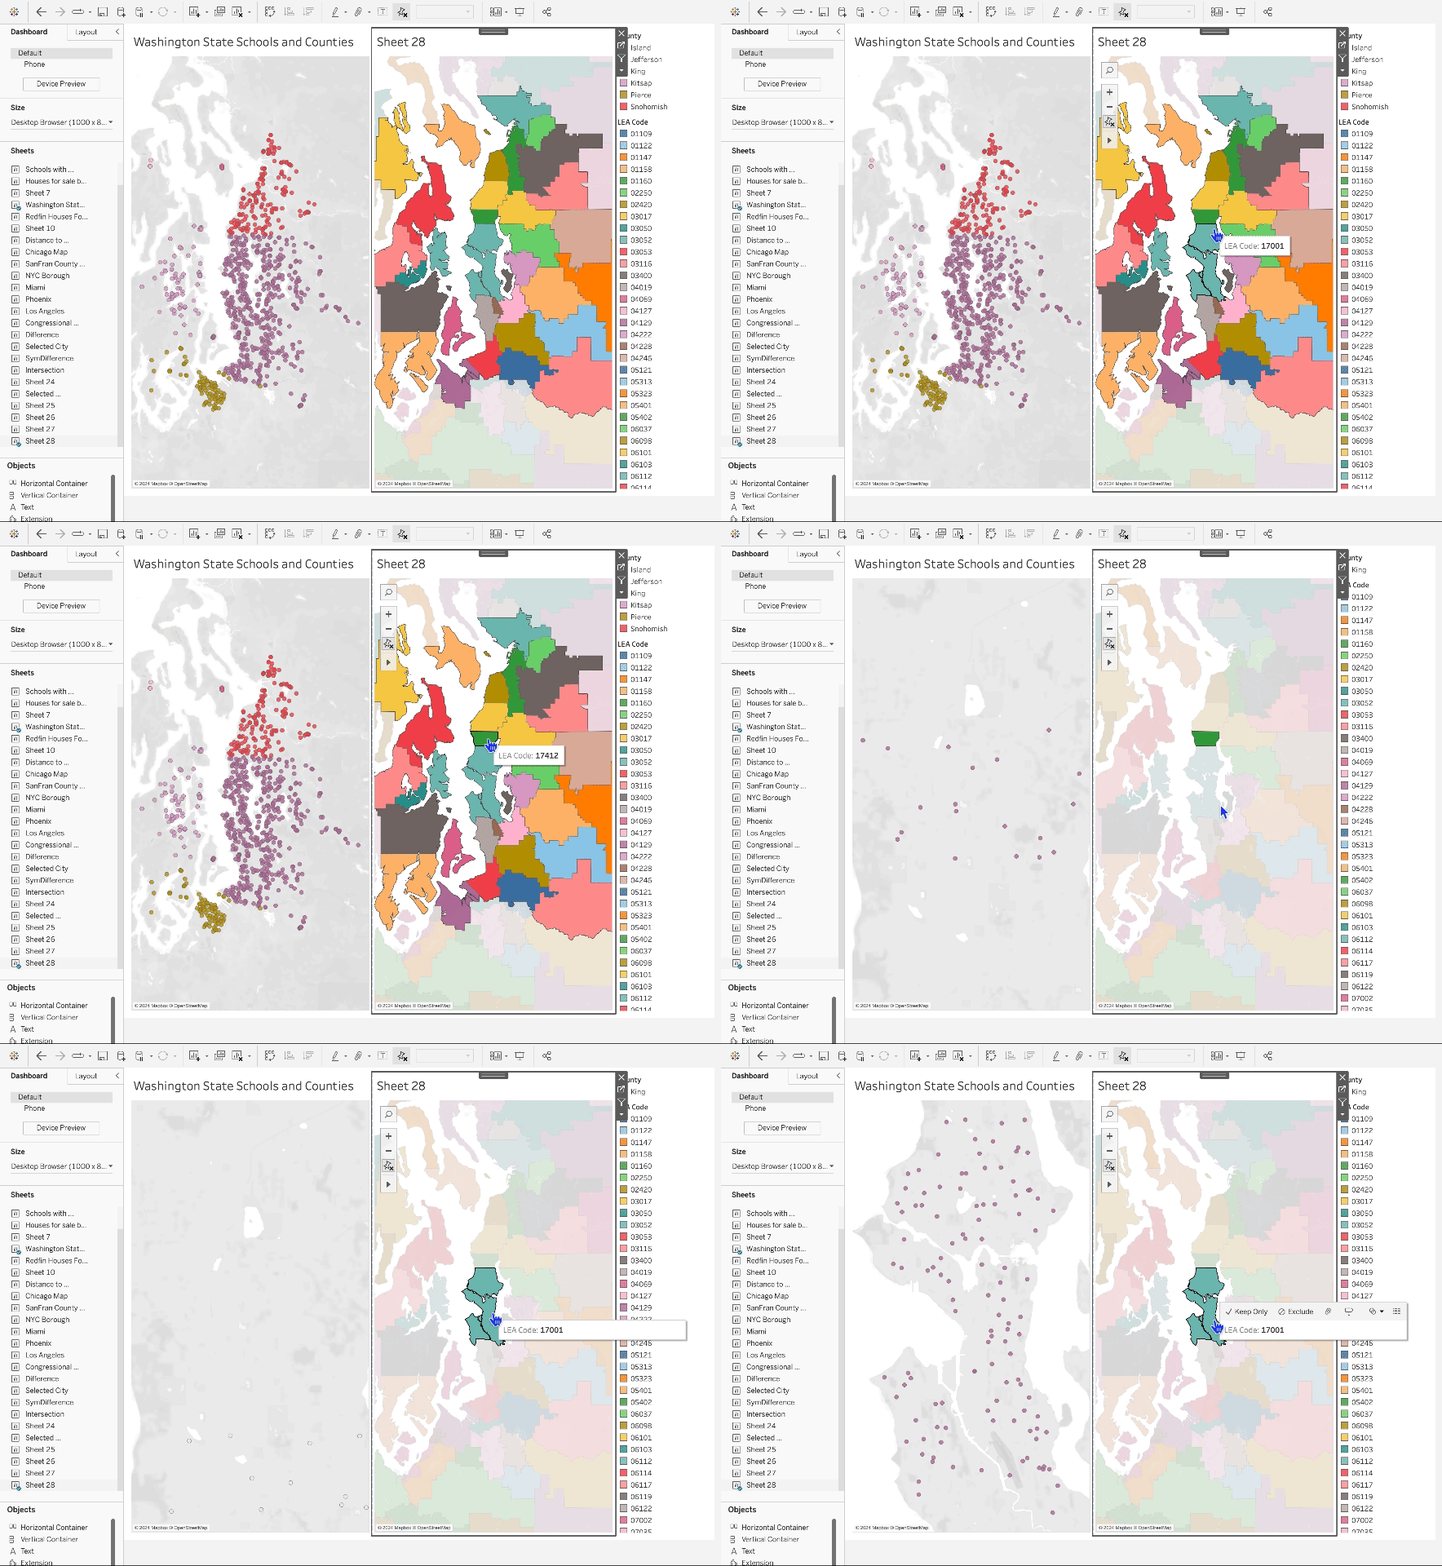
Spatiala parametrar
Vi tar in hela Tableau-upplevelsen till geospatiala data med geospatialt stöd för parametrar. Spatiala parametrar skapar rika, interaktiva dashboards så att du kan ställa frågor om geospatiala data och svara på dem. Spatiala parametrar gör det möjligt för slutanvändaren att välja enskilda punkter, som sedan skickas som indata till beräkningar som möjliggör dynamiskt beteende baserat på valet.
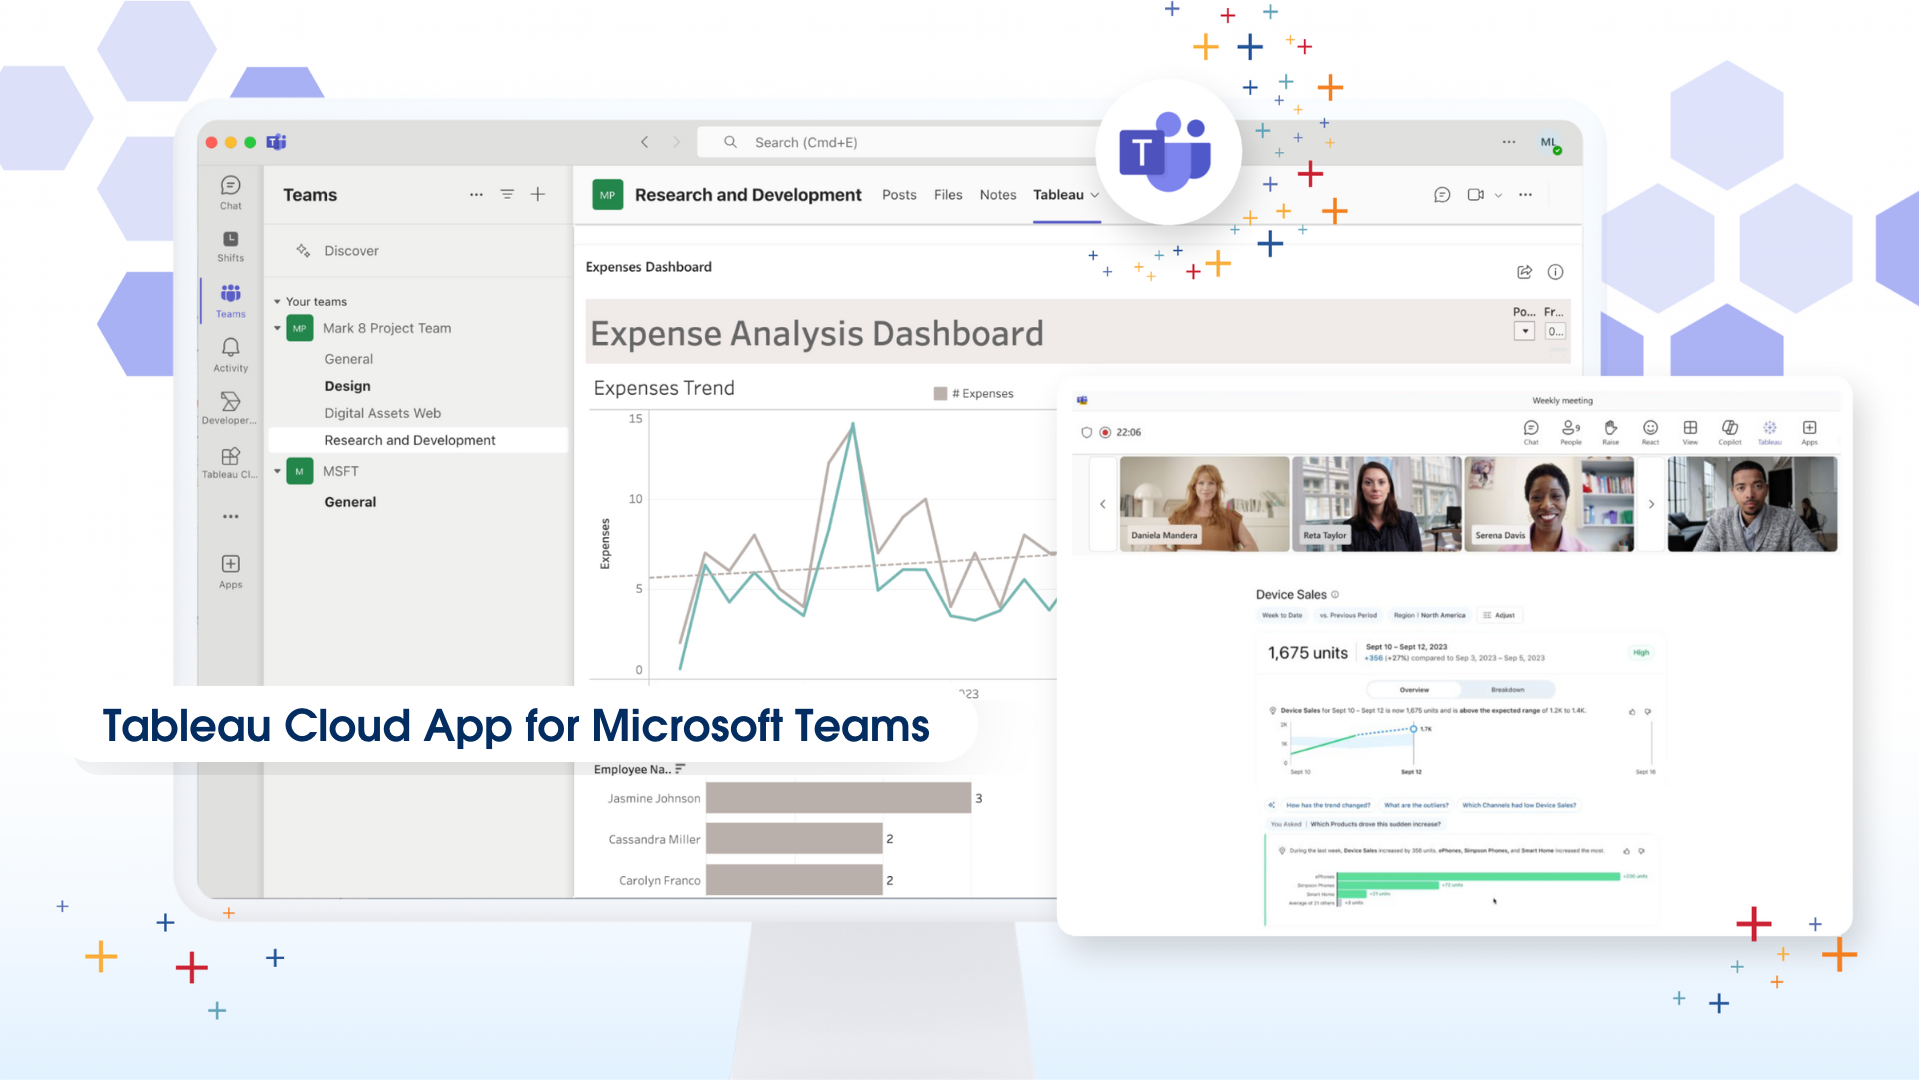
Tableau Cloud-appen för Microsoft Teams
Med den nya Tableau Cloud-appen för Microsoft Teams kan användare enkelt integrera datadrivna insikter i sina dagliga arbetsflöden, vilket leder till snabbare och effektivare beslutsfattande. Integrationen möjliggör datadelning i realtid, så att användarna enkelt kan dela Tableau-visualiseringar, dashboards och Pulse Metrics direkt i Teams-chattar och möten. Detta främjar en mer datadriven kultur genom att säkerställa att alla kan arbeta tillsammans mer effektivt med tillgång till samma data och analyser i arbetsflödet.
Alla funktioner
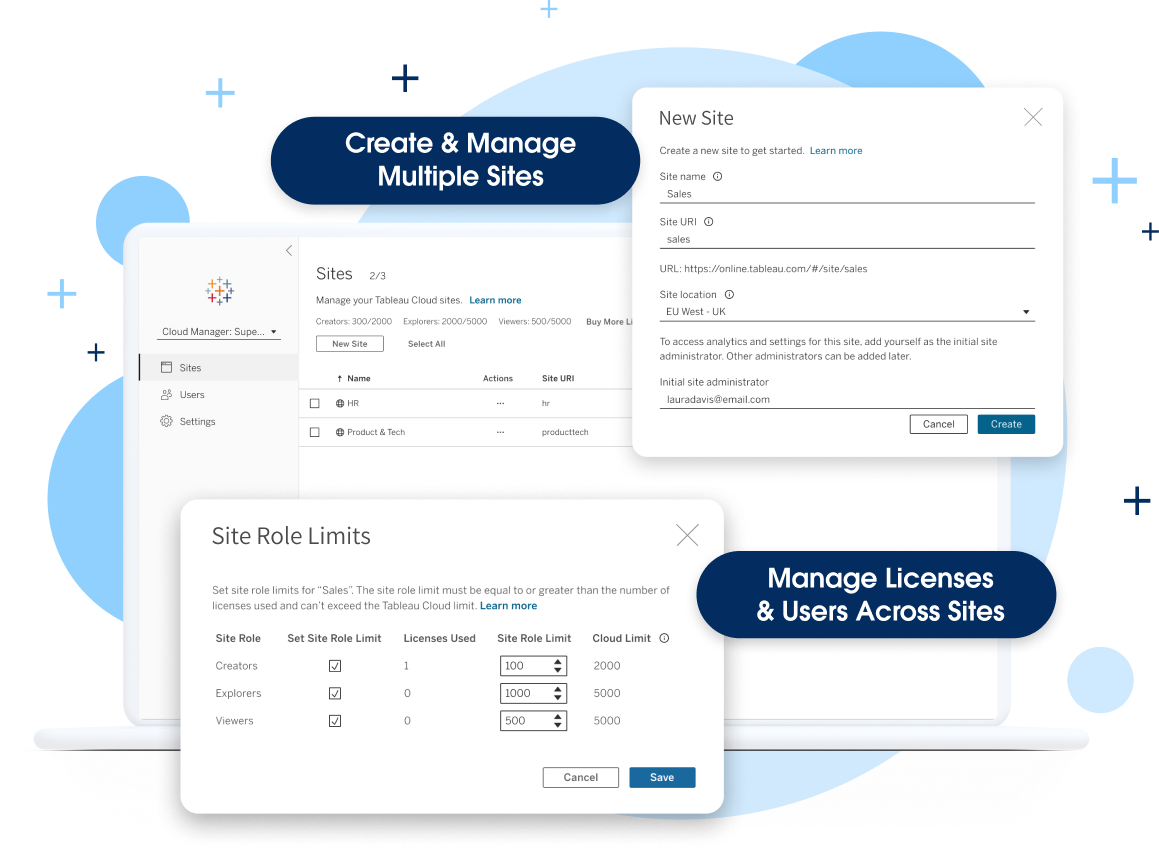
Tableau Cloud Manager
Tableau Cloud Manager gör det möjligt för administratörer att skapa och hantera flera Tableau-platser i de regioner som de själva väljer. Administratörer kan hantera licenser och användare på olika platser utan att behöva licensiera en enda användare flera gånger. Detta förenklar expansionen och hanteringen av molnanalysmiljön samtidigt som det hjälper till att säkerställa att de uppfyller kraven på dataresidens och upprätthåller styrning.
Obs! Den här funktionen kommer att driftsättas i flera faser. Administratörerna får ett e-postmeddelande två veckor innan funktionen driftsätts på deras plats.
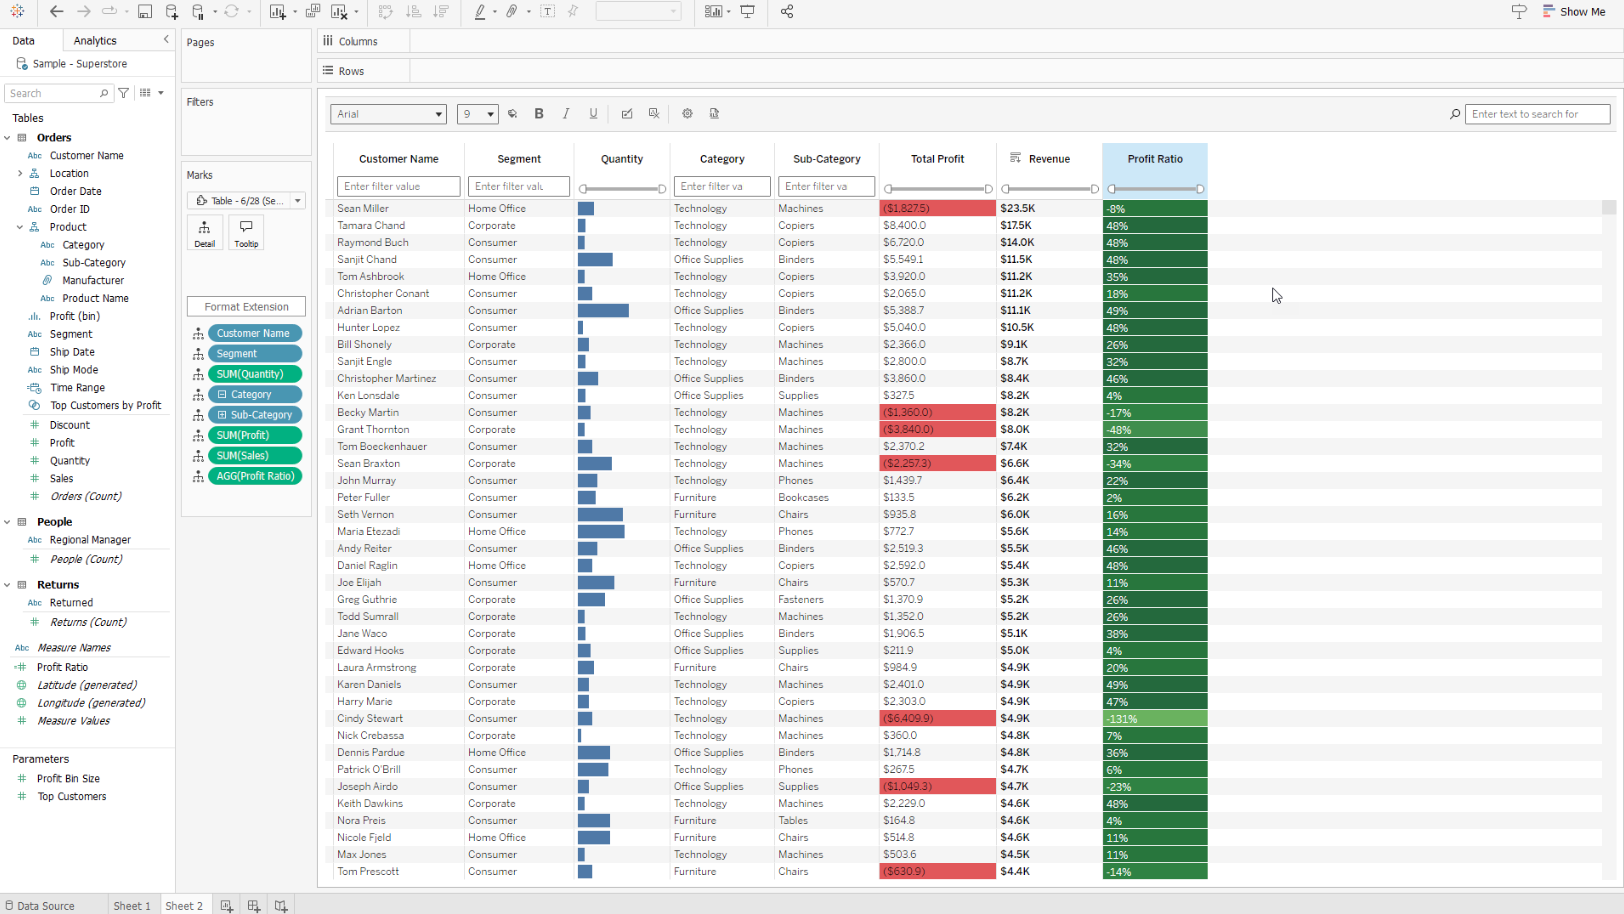
Tabelltillägg för visualiseringar
Gå från äldre rapportering till visuell analys samtidigt som du tillgodoser användarnas aktuella behov. Nu kan du lägga till detaljtabeller och rutnätsvyer i dashboards för användare som föredrar traditionella rapporteringsvyer.
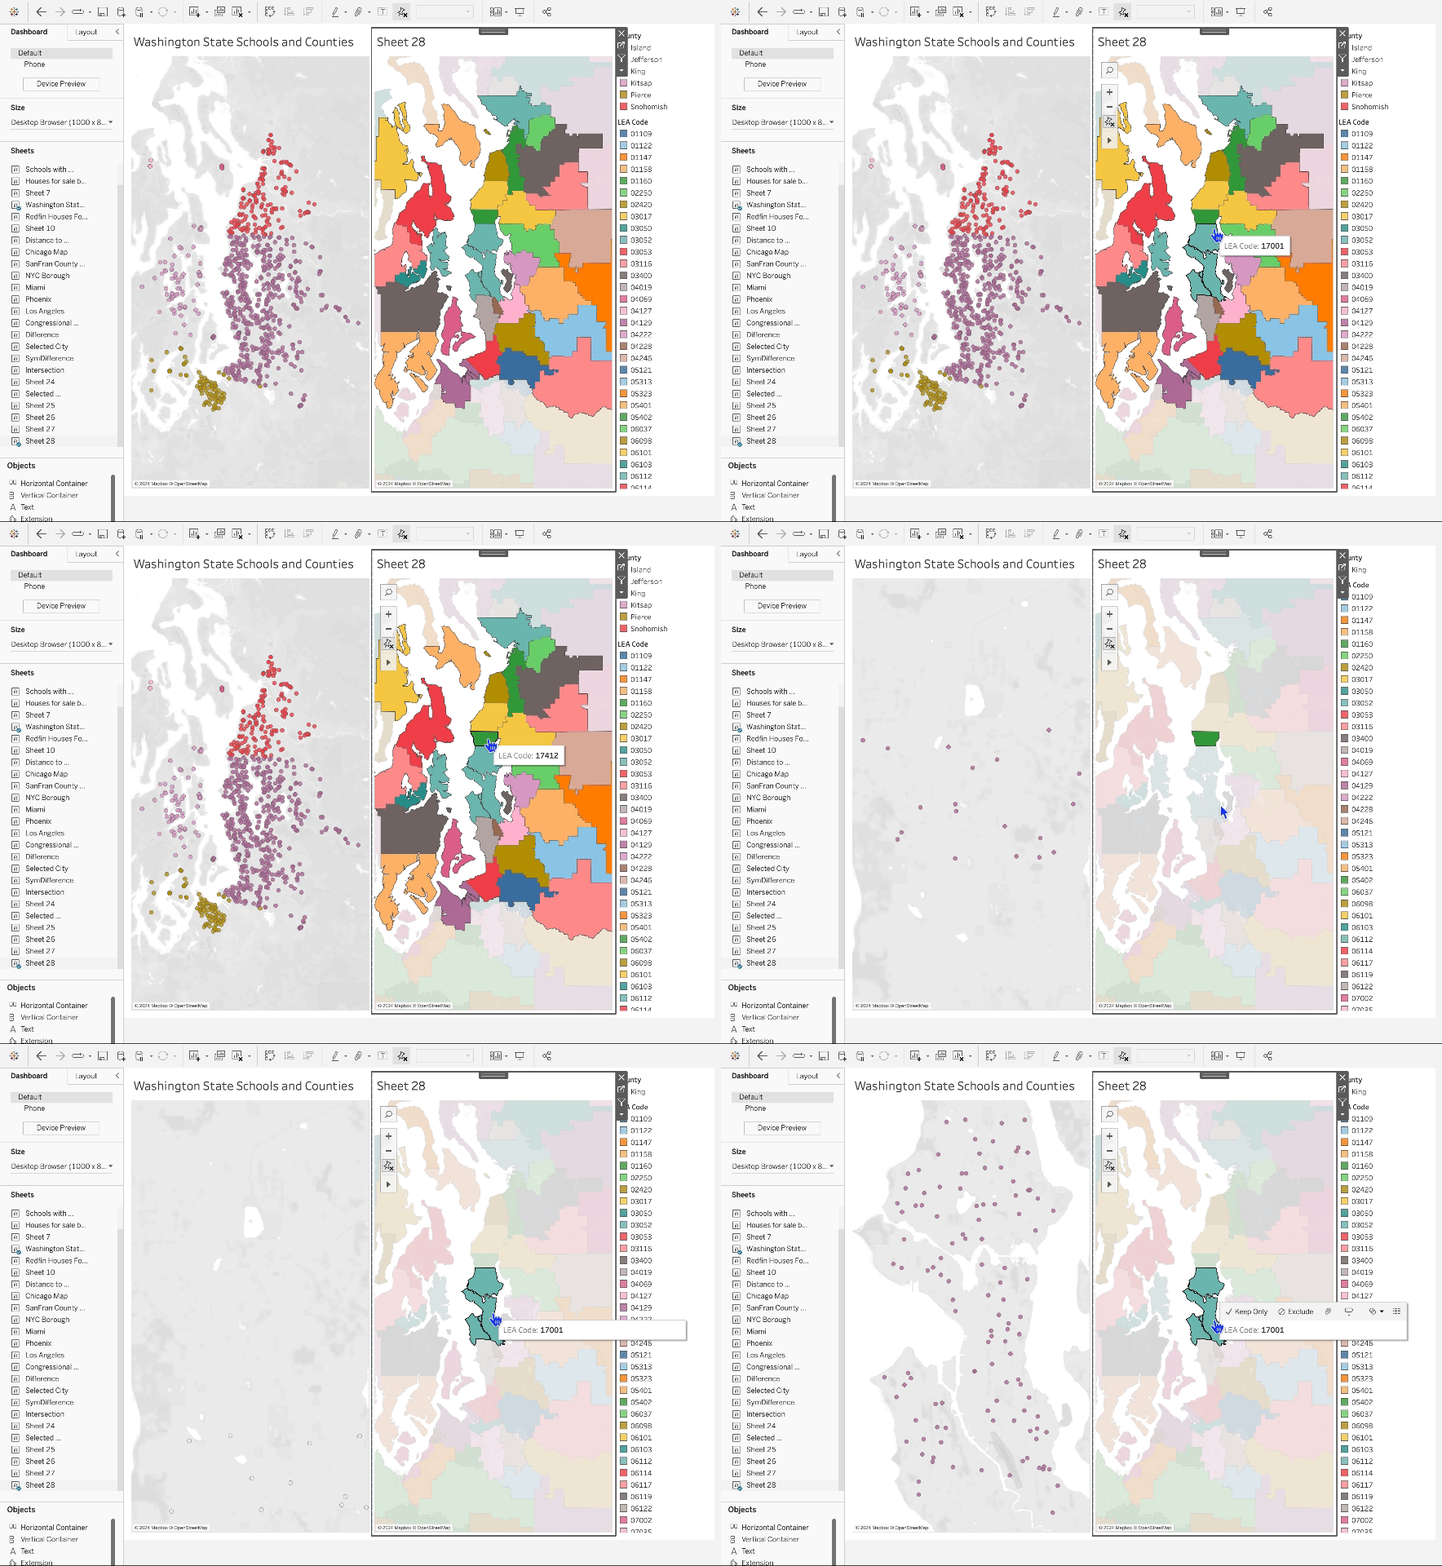
Spatiala parametrar
Ta med hela Tableau-upplevelsen till geospatiala data med geospatialt stöd för parametrar. Spatiala parametrar skapar rika, interaktiva dashboards så att användarna kan ställa och svara på frågor om geospatiala data.
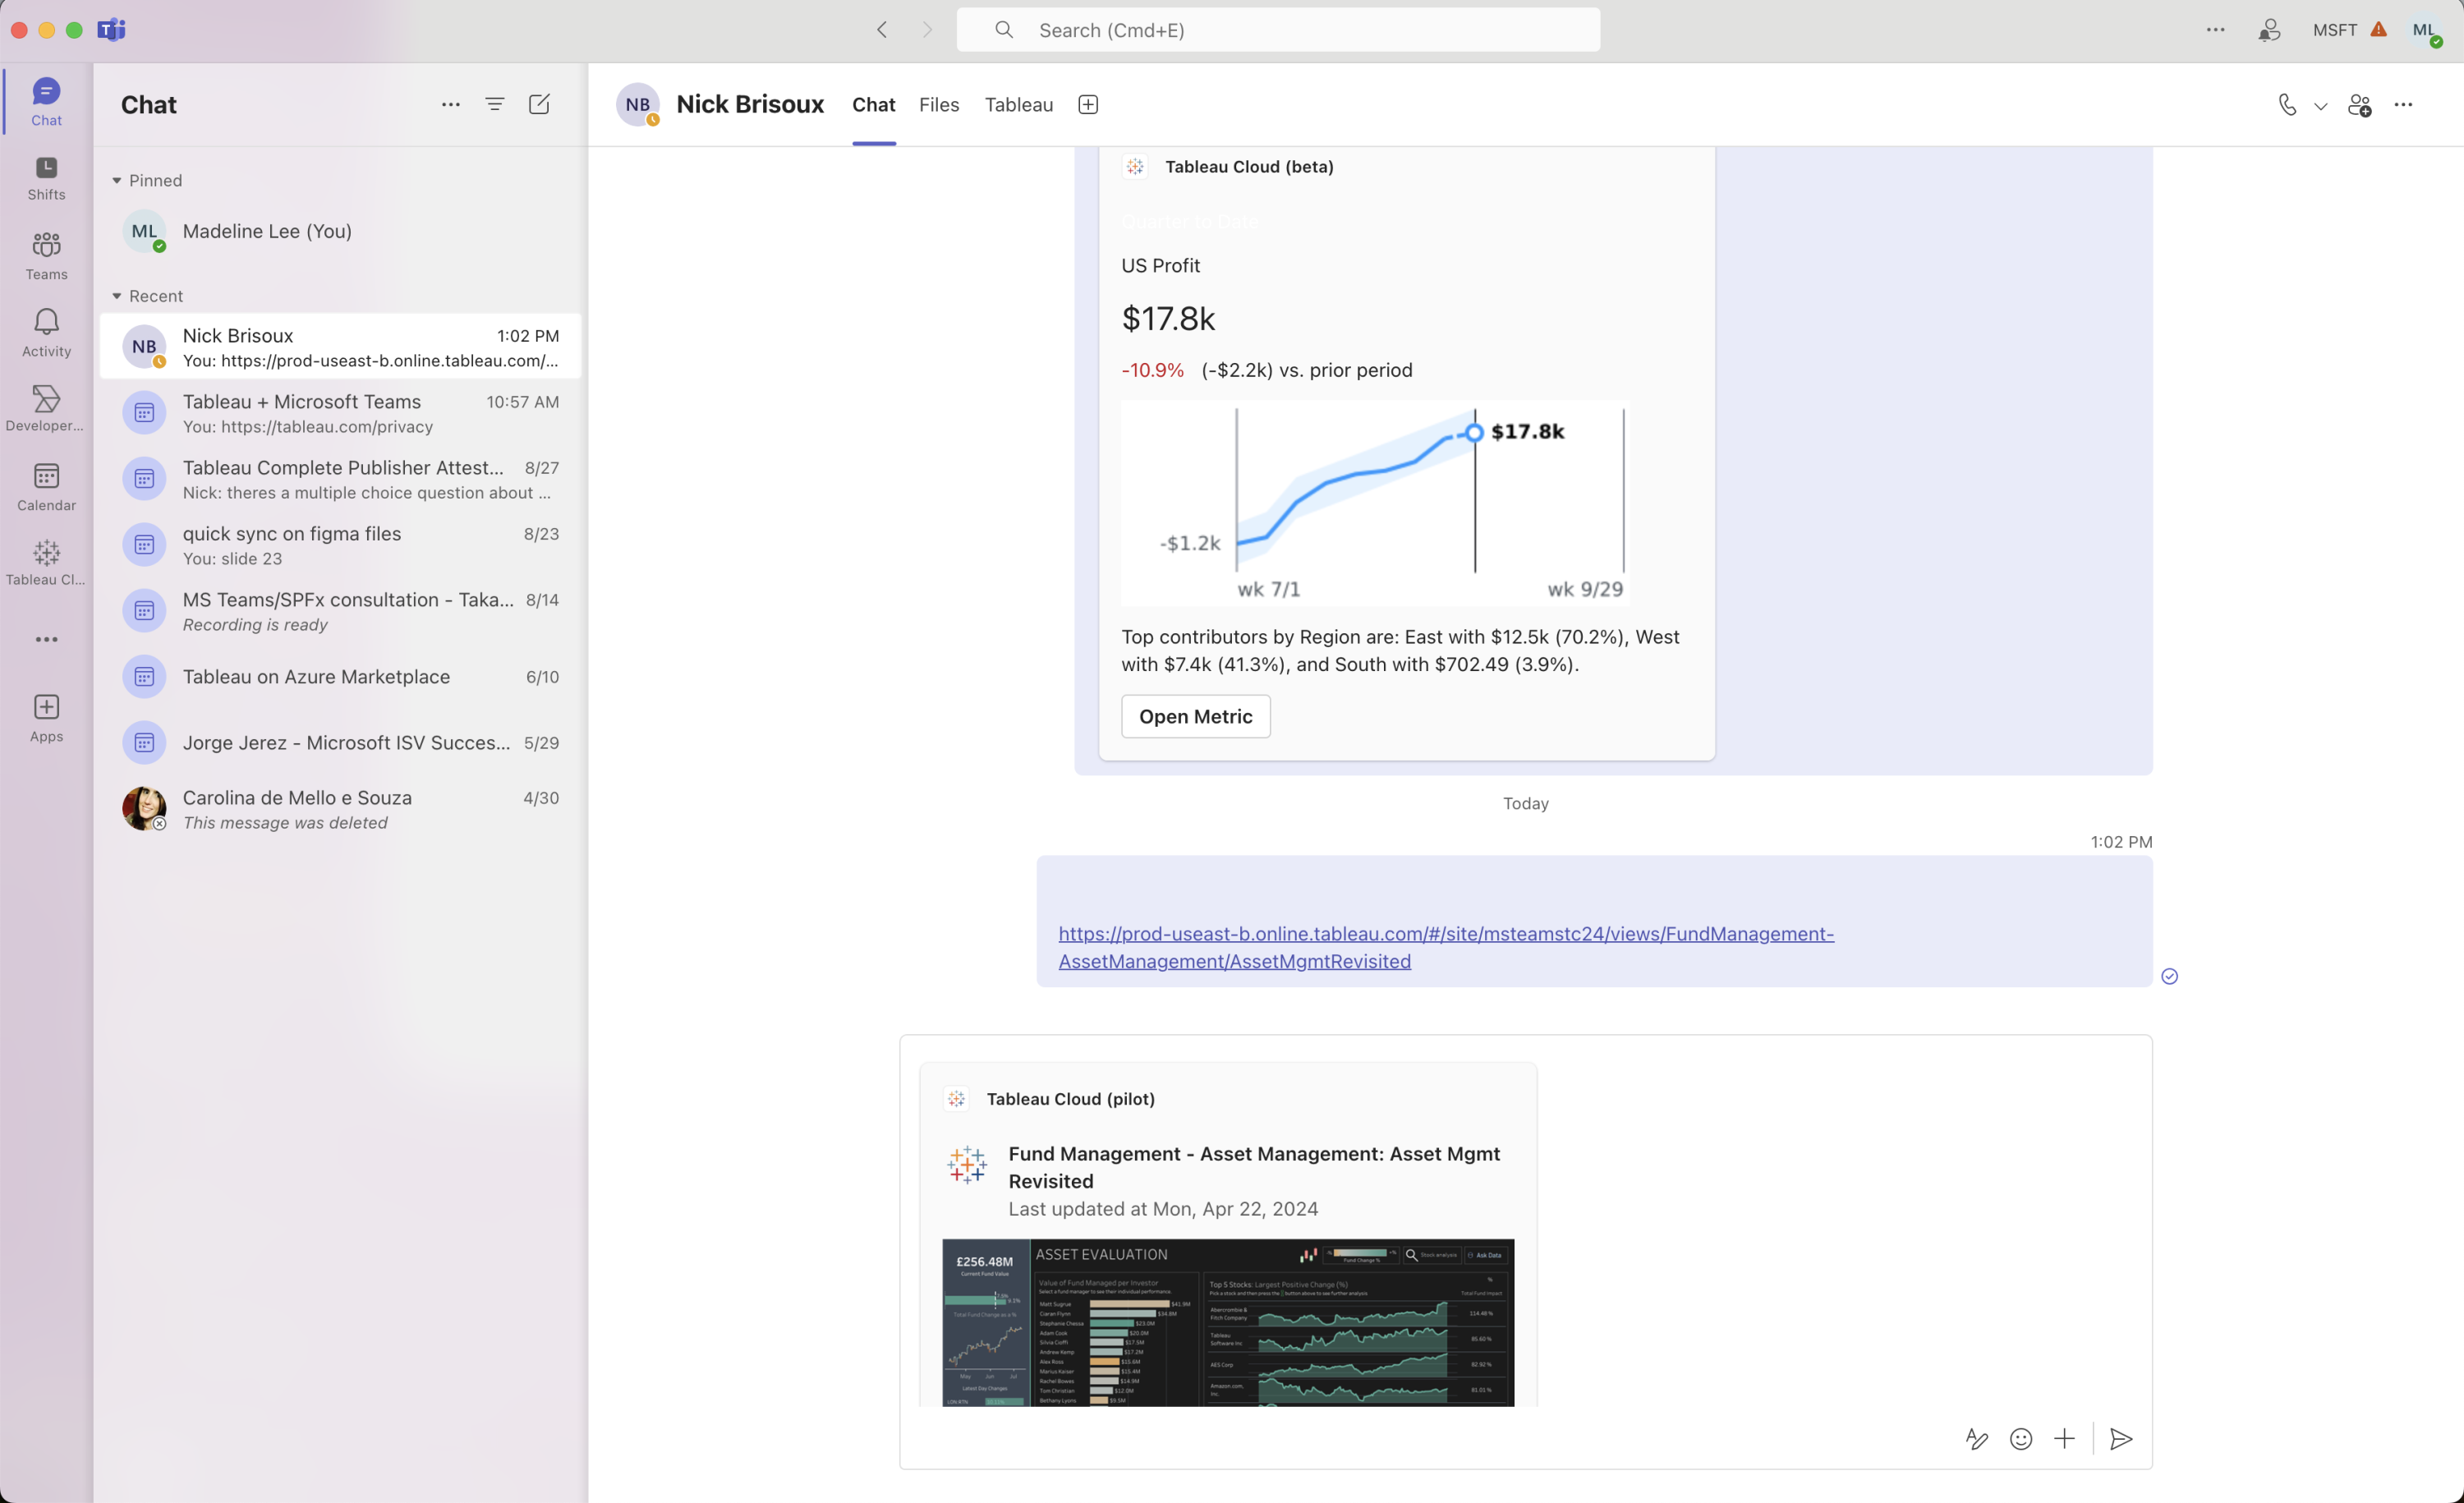
Tableau-app för Microsoft Teams
Med den nya Tableau-appen för Microsoft Teams kan användare enkelt integrera datadrivna insikter i sina dagliga arbetsflöden, vilket leder till snabbare och effektivare beslutsfattande. Integrationen möjliggör datadelning i realtid, så att användarna enkelt kan dela Tableau-visualiseringar, dashboards och insikter direkt i Teams chattar och möten.
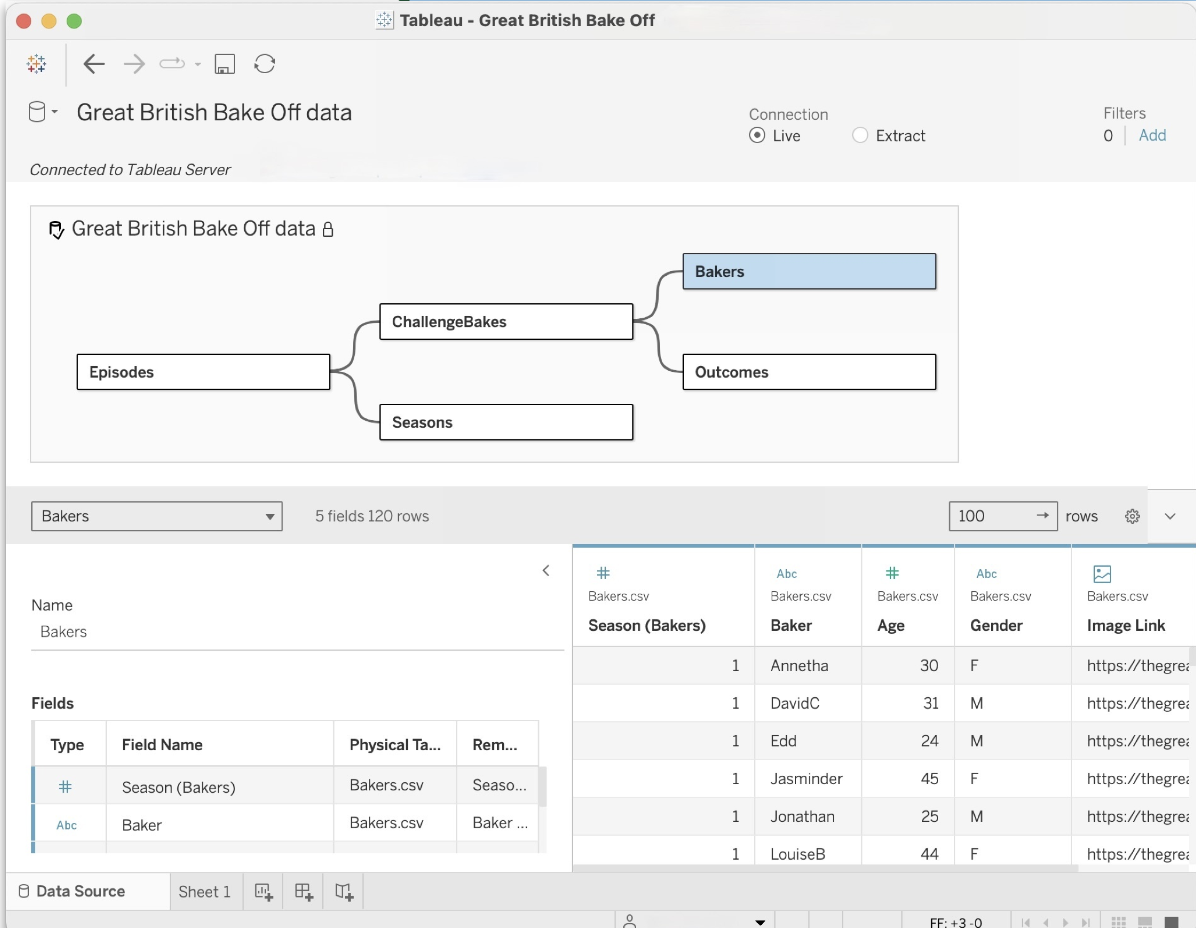
Visa datamodeller för publicerade datakällor
Visa och förstå hur tabeller i din datamodell är relaterade i publicerade datakällor. Skapa exakta visualiseringar och förstå relationerna mellan olika tabeller och fält i Tableau genom att helt enkelt klicka på rutan Datakälla i en Tableau-arbetsbok.
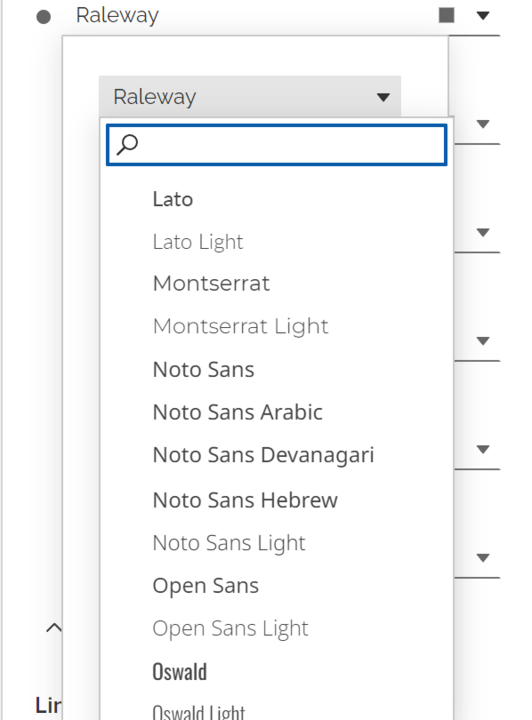
Stöd för Google Fonts
Få flera typsnittsalternativ på Tableau Cloud med stöd för en uppsättning med Google Fonts. Nu har Tableau Cloud stöd för Lato, Montserrat, Noto Sans, Noto Sans Hebrew, Noto Sans Arabic, Noto Sans Devanagari, Open Sans, Oswald, Poppins och Raleway.
Förbättrad tillgänglighet
Gör det möjligt för dem som använder tekniska hjälpmedel att utforska, navigera och interagera med visualiseringar och dashboards utan mus genom tre tillgänglighetsoptimeringar. Nu kan användarna använda Enter-tangenten för att navigera i en visualisering. Vi har också förbättrat meddelanden via skärmläsaren och växlingarna mellan tangentbord och mus.
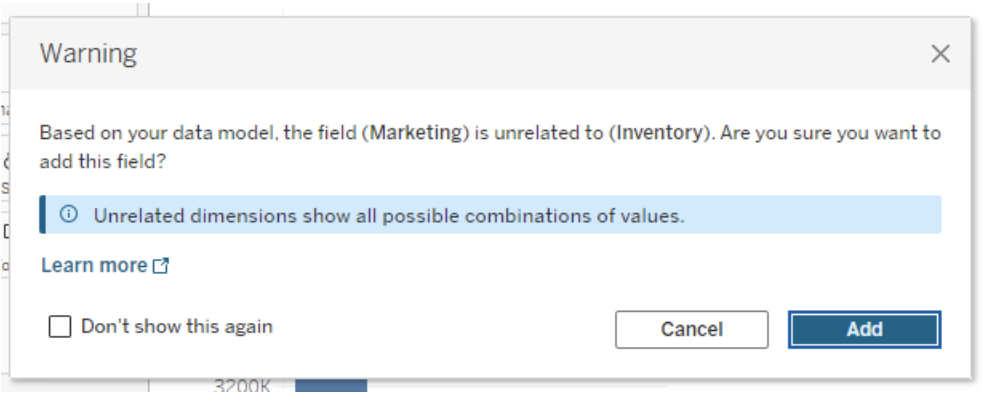
Information om flerfaktorsrelationer
Få proaktiv information i arbetsflödet utan att behöva förstå den underliggande datamodellen fullt ut. Information om flerfaktorsrelationer ger vägledning och ytterligare information om förhållandet mellan fält som används och de som finns i datafönstret.
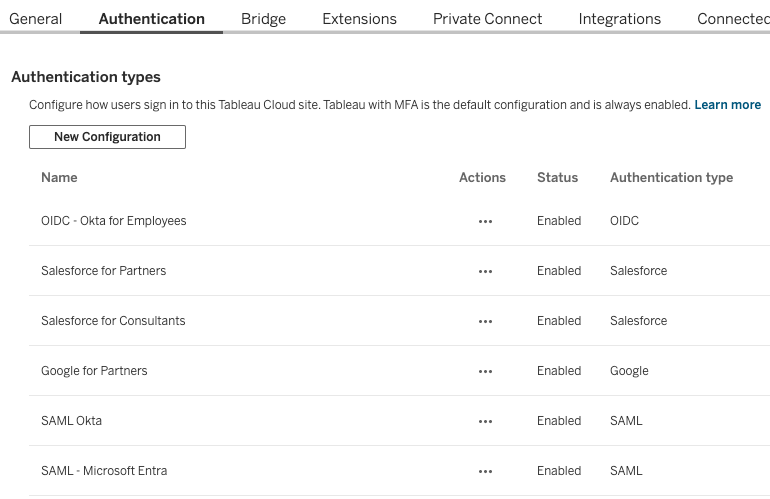
Flera externa identitetsleverantörer på en webbplats
Aktivera upp till 20 identitetsleverantörer på en enda Tableau Cloud-webbplats. Använd flera identitetsleverantörer för att ge externa användare, interna användare och partners säker åtkomst till din Tableau Cloud-webbplats.
Obs! Tillgänglig i en veckoversion som kommer efter att den först blivit tillgänglig i 2024.3.
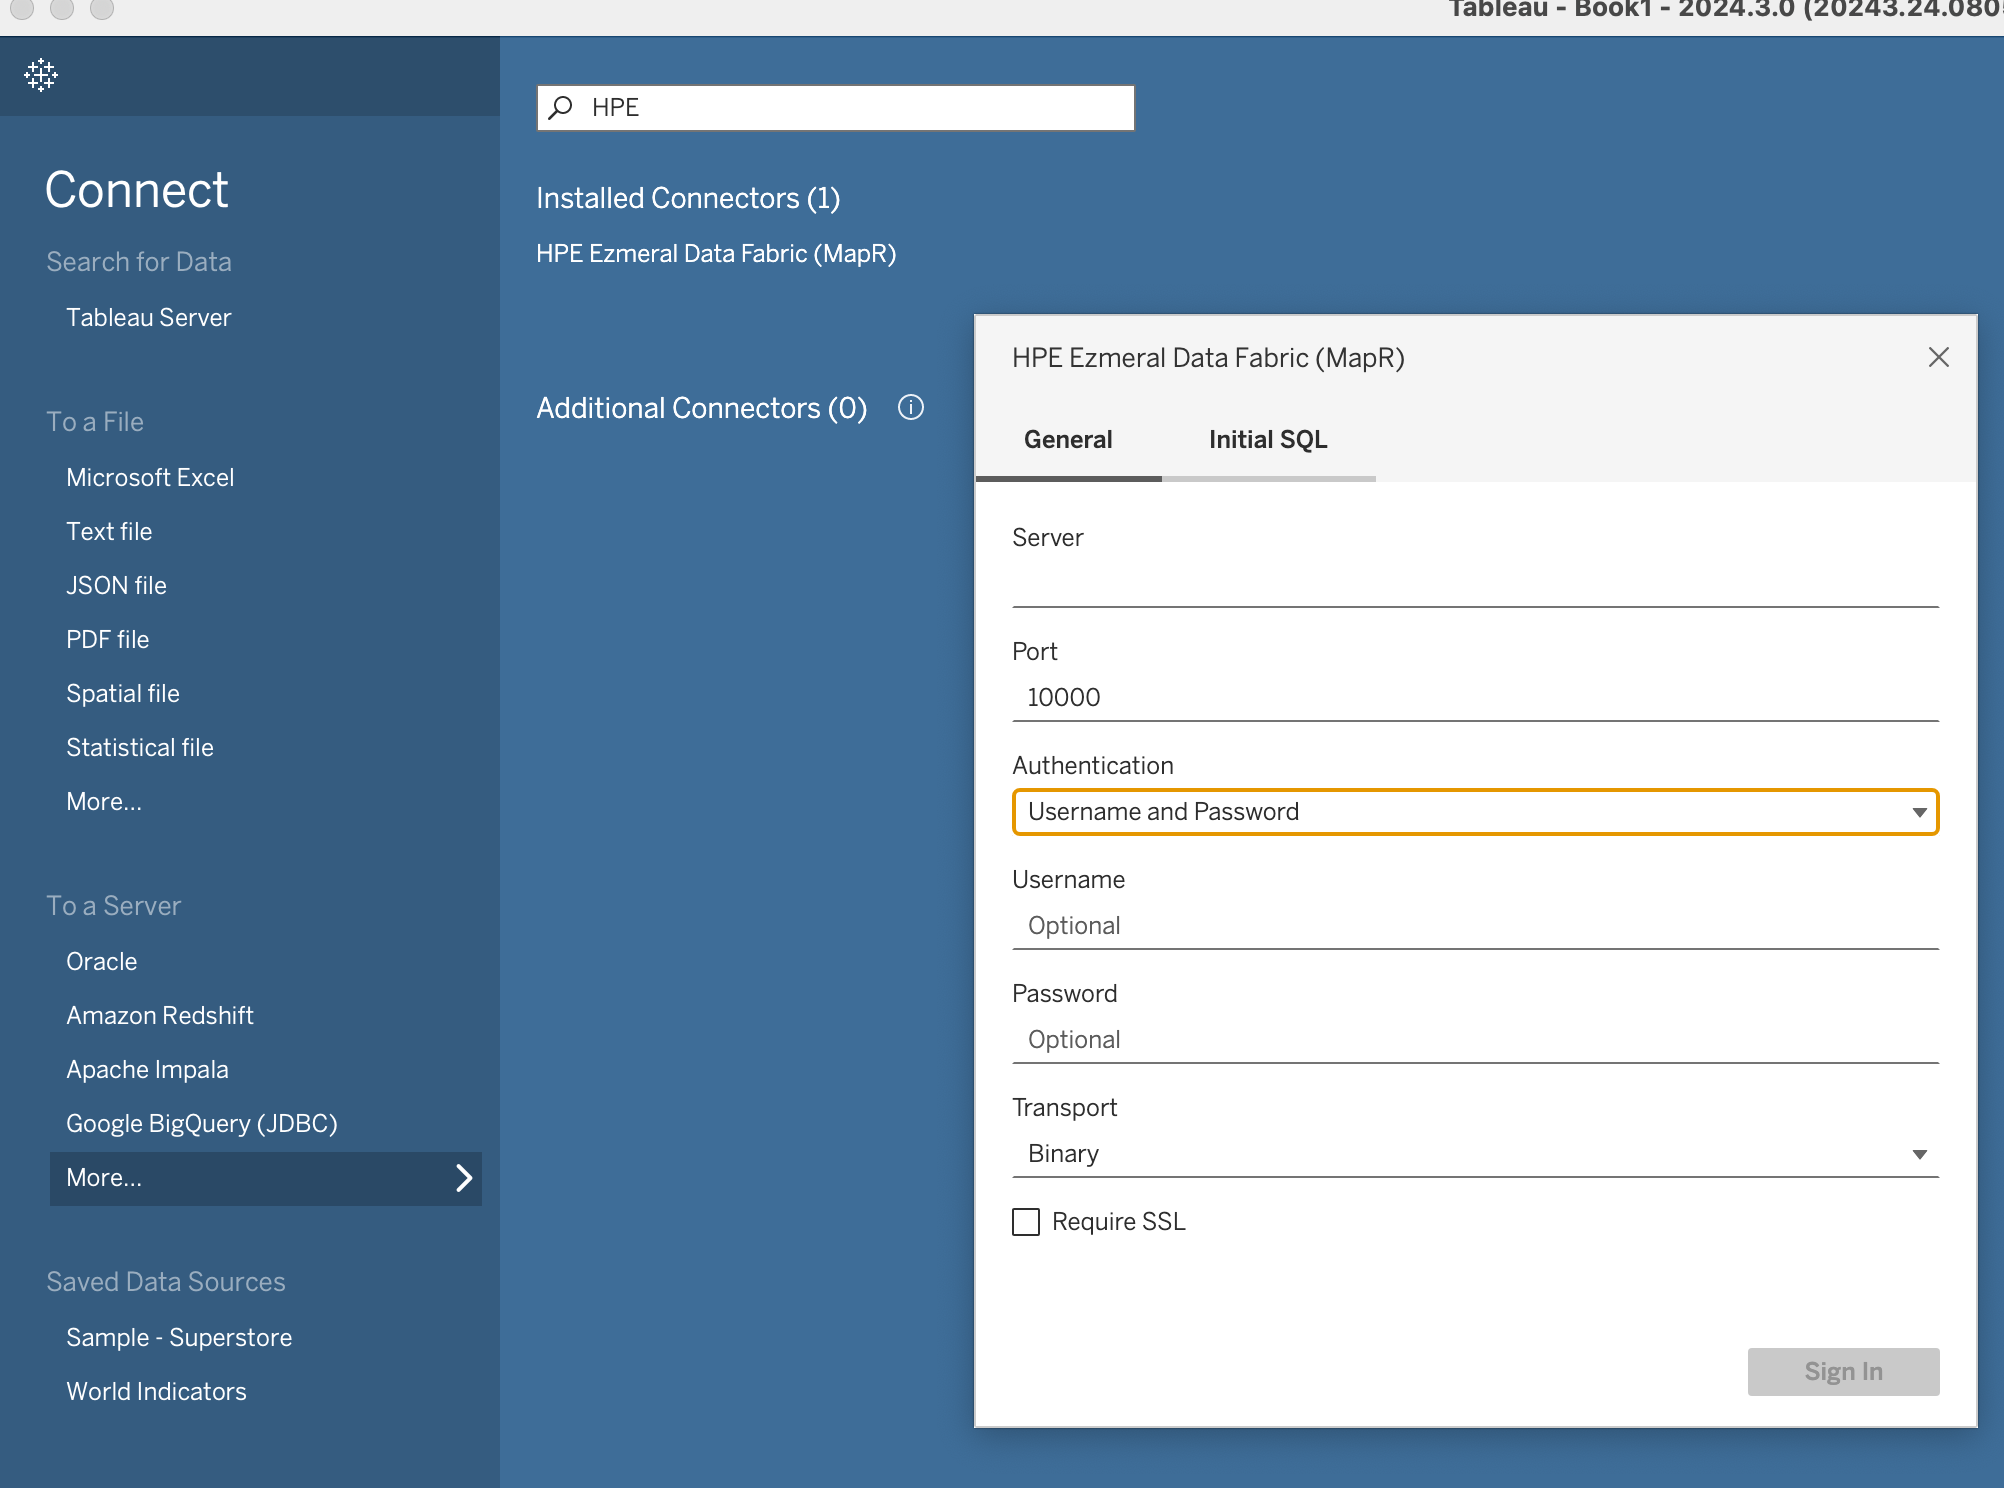
Kopplingen HPE Ezmeral Data Fabric (MapR)
Anslut till och analysera data som lagrats i HPE Ezmeral Data Fabric, tidigare med namnet MapR. Kopplingen finns tillgänglig som standard i listan över kopplingar från och med 2024.3.
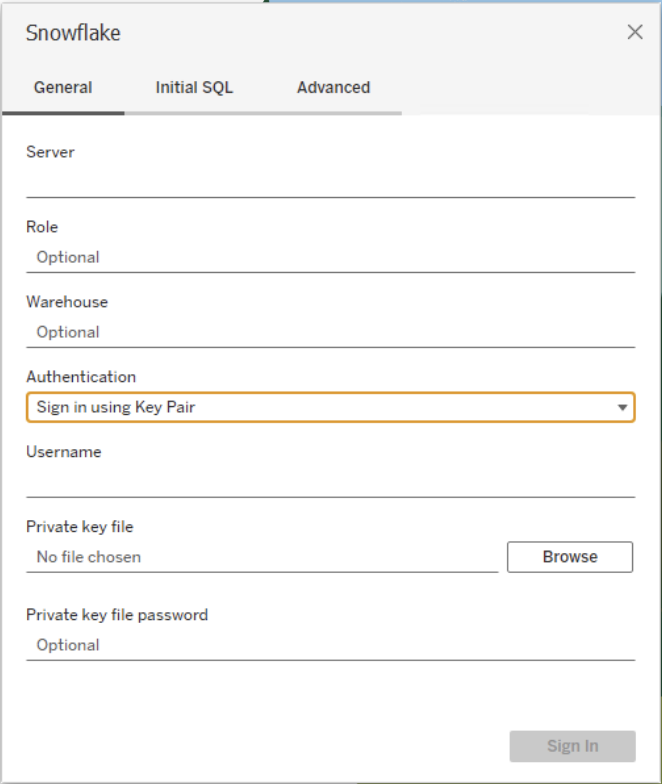
Autentisering med nyckelpar för Snowflake
Håll dina referenser säkra och trygga med ett nytt alternativ för att logga in med ett nyckelpar när du ansluter till Snowflake. Företagsanvändare kan publicera Snowflake-anslutet innehåll till Tableau Server eller Tableau Cloud med hjälp av enskilda användarkonton. Administratörer kan redigera anslutningar så att de använder ett servicekonto med nyckelbaserad autentisering.. Den här autentiseringen ger bättre kontroll över åtkomst och rotationen av inloggningsuppgifter.
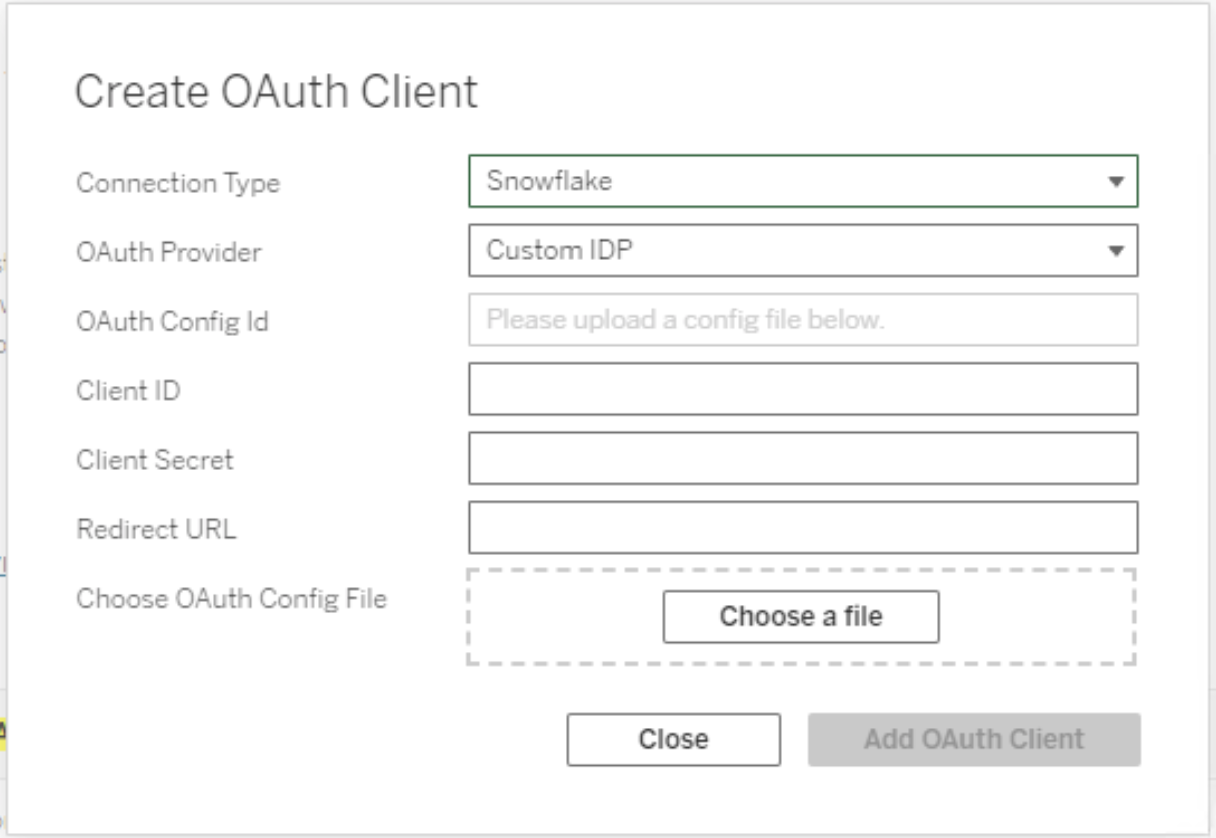
Extern identitetsprovider för Snowflake
Integrera Tableau och Snowflake med din befintliga identitetsprovider och dina säkerhetspolicyer. Säkerställ förtroende genom att konfigurera din identitetsprovider för relevanta Tableau-klienter och skapa och distribuera OAuth-konfigurationsfiler.
Utforska i Tableau API
Ge dina kunder möjlighet att starta en analyssession i Tableau från din dataplattform med ett enda klick. Tableau skapar en ny arbetsbok med en datakälla baserad på deras data, så att de direkt kan påbörja analysen utan att behöva ansluta till data eller omdefiniera sin datamodell.
Tableau Cloud region Tyskland
Ta med analys till de nya teamen i Europa och uppfyll samtidigt kraven på dataresidens. Använd den nya Hyperforce-regionen i Tyskland för att driftsätta Tableau Cloud-platser i Tyskland.
Obs! Kunder i Dublin-regionen kommer att flyttas till Tyskland-regionen.
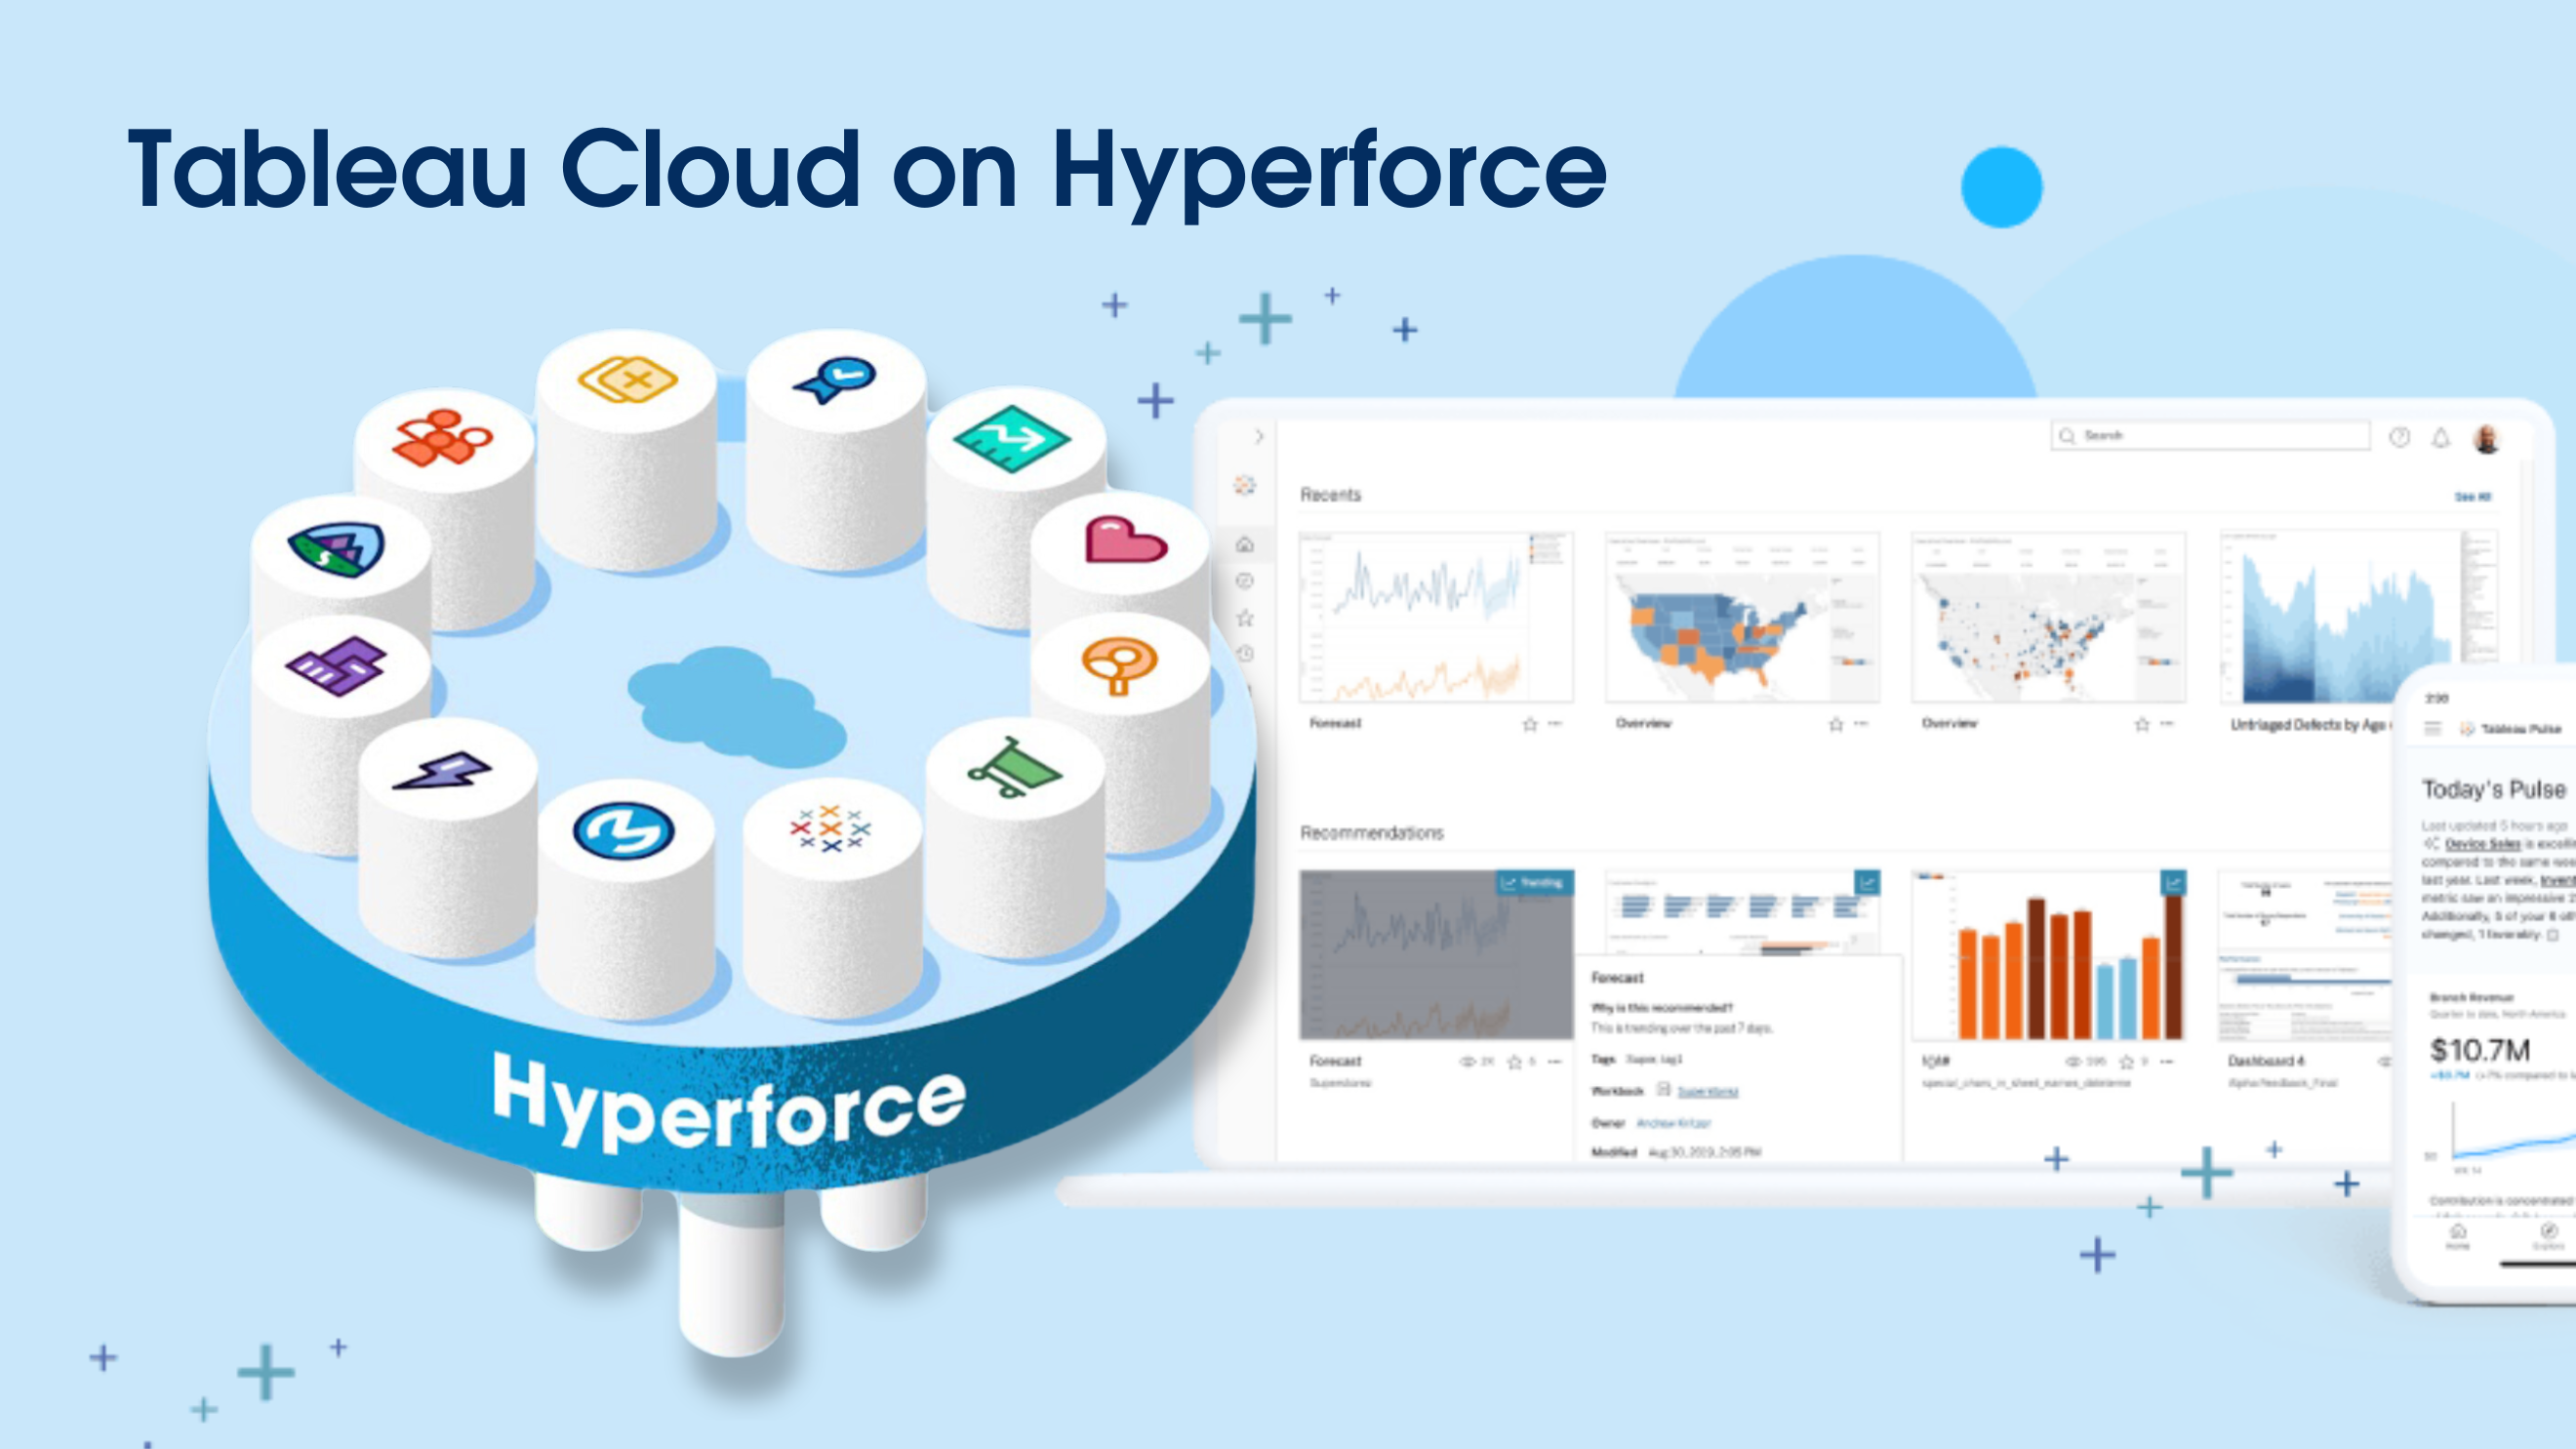
Tableau Cloud på Hyperforce
Salesforce Hyperforce-plattform är en banbrytande plattform som omdefinierar skalbarhet, säkerhet och efterlevnad över hela världen. För att möta kundernas efterfrågan på mer robusta, säkra och skalbara molnbaserade analyslösningar flyttas Tableau Cloud till Hyperforce.
Obs! Migreringen kommer att pågå under flera veckor. Administratörer kommer att meddelas innan migreringen äger rum.
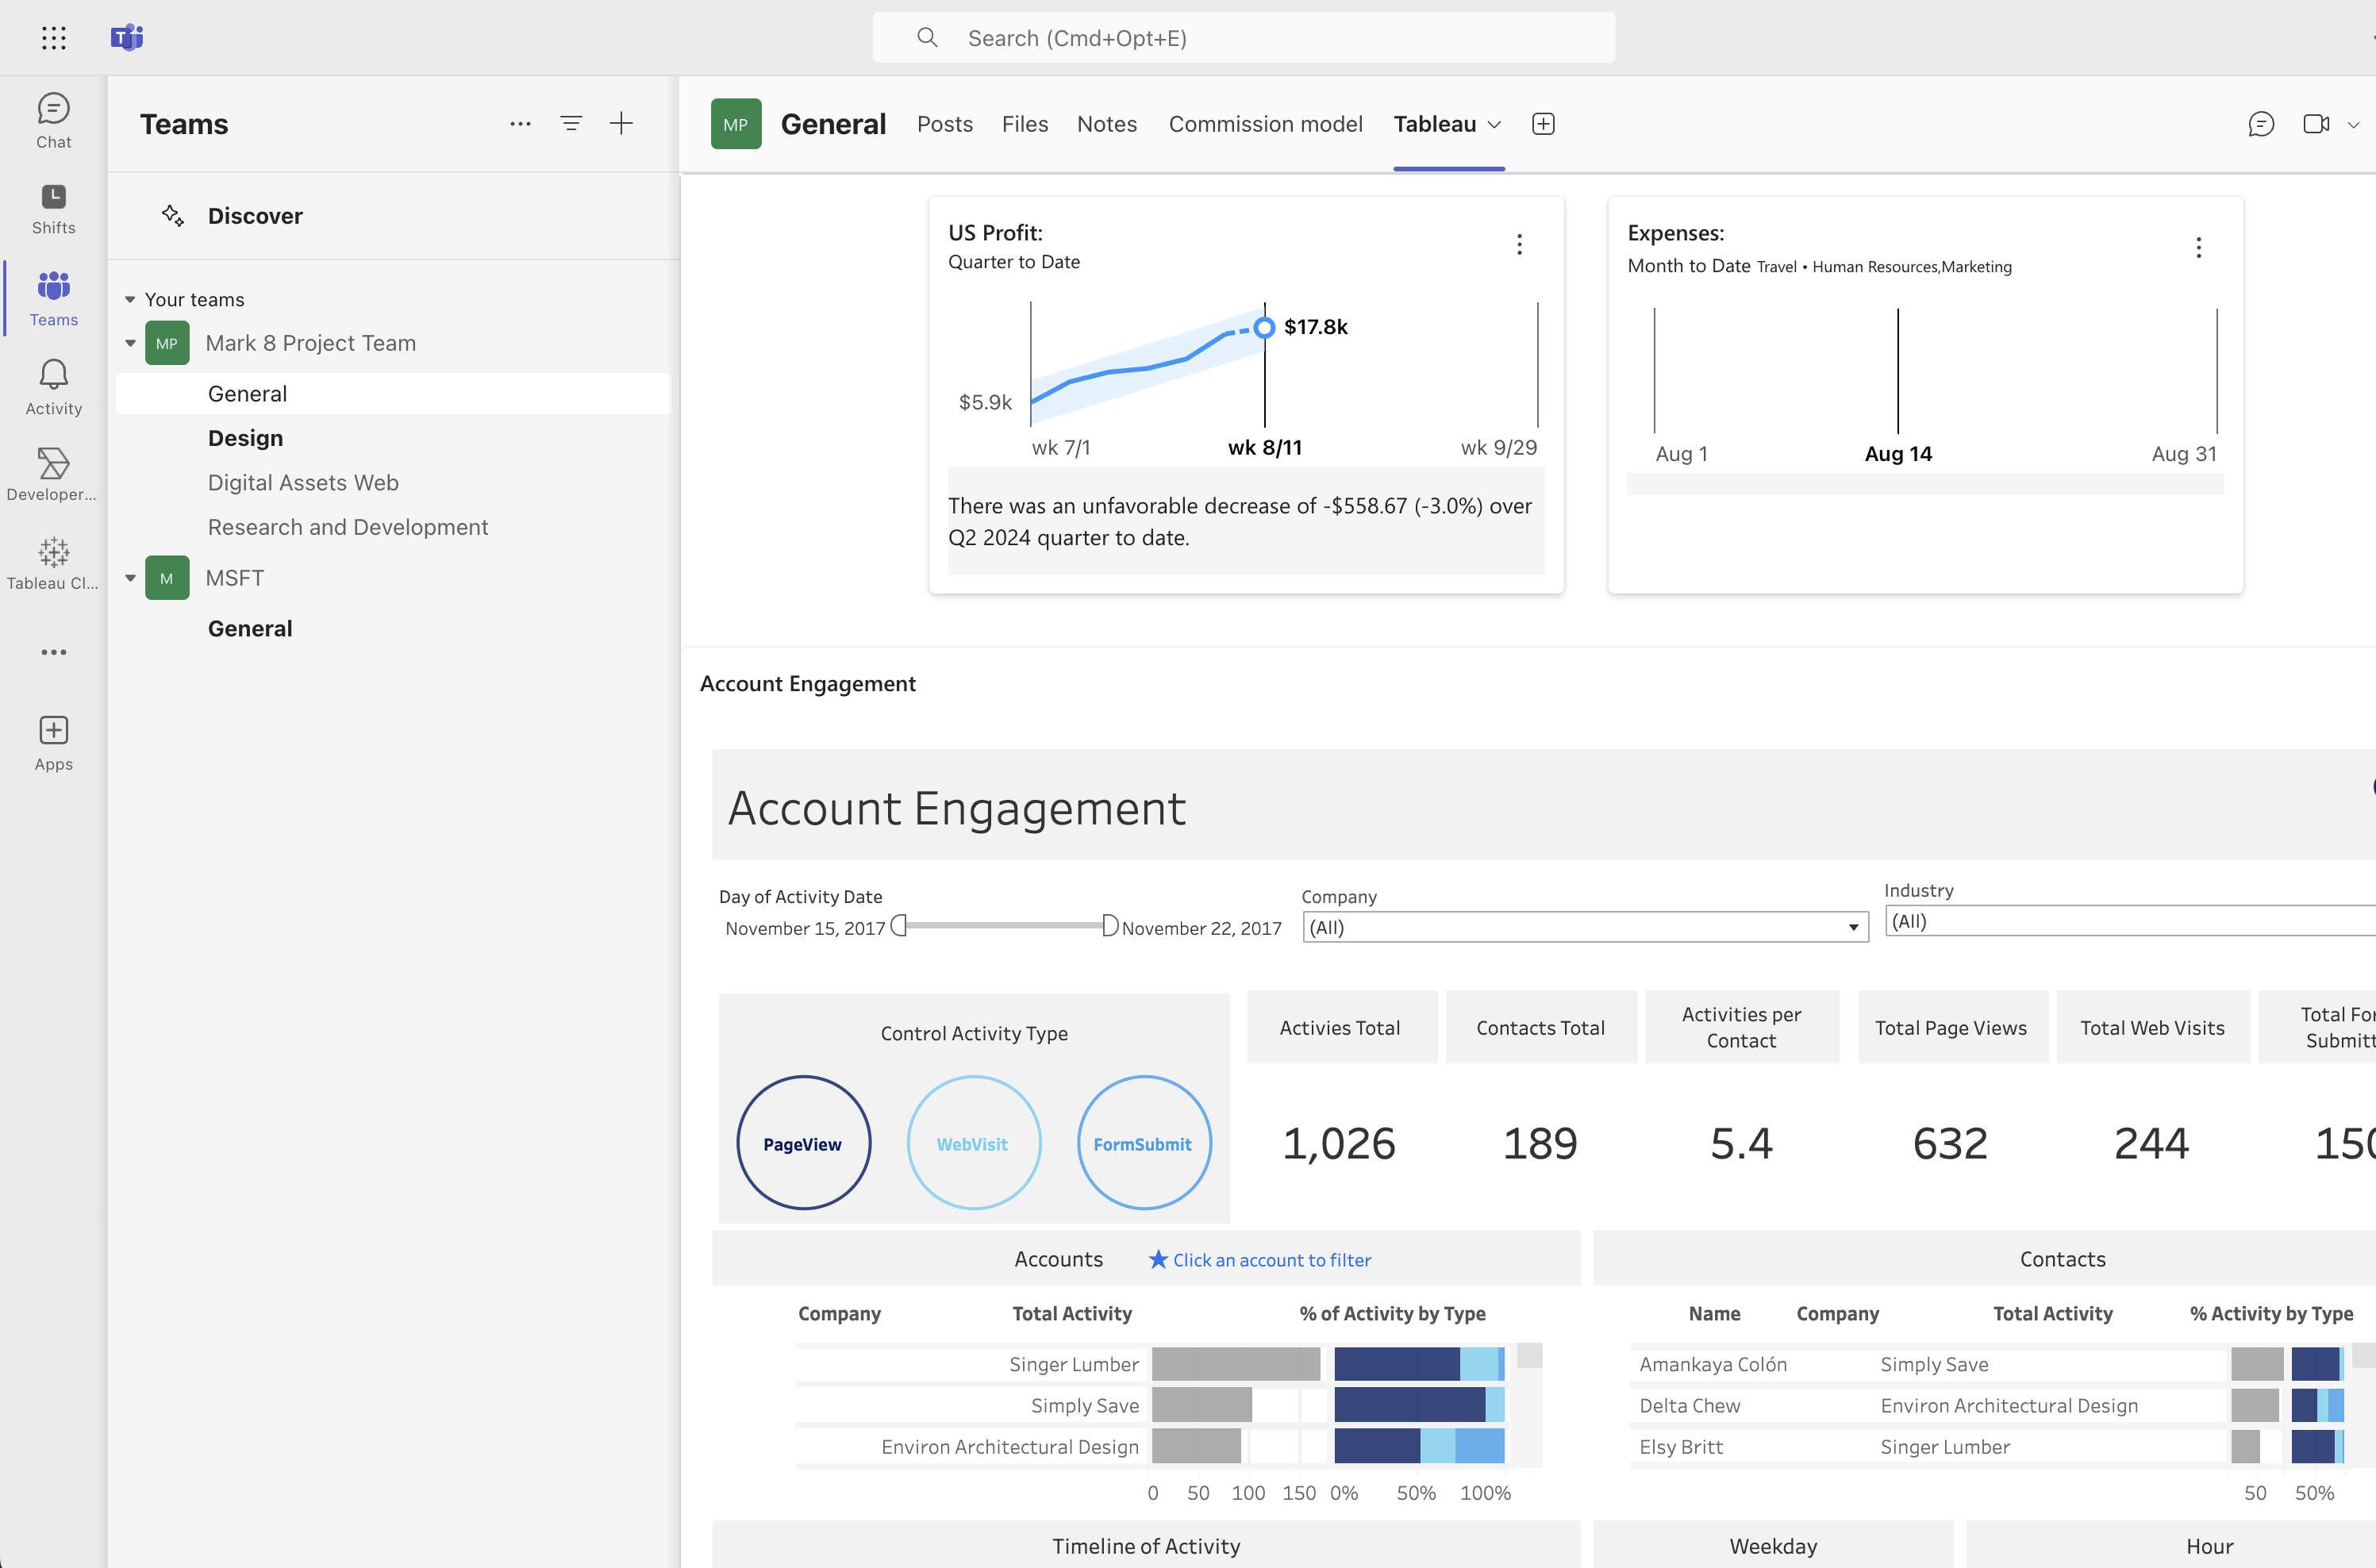
Tableau Pulse i Microsoft Teams
Upptäck, använd och dela Tableau Pulse-mätvärden i Microsoft Teams. Samarbeta kring analytiska insikter med Tableau Pulse inbäddat i möten, kanalflikar och meddelanden.
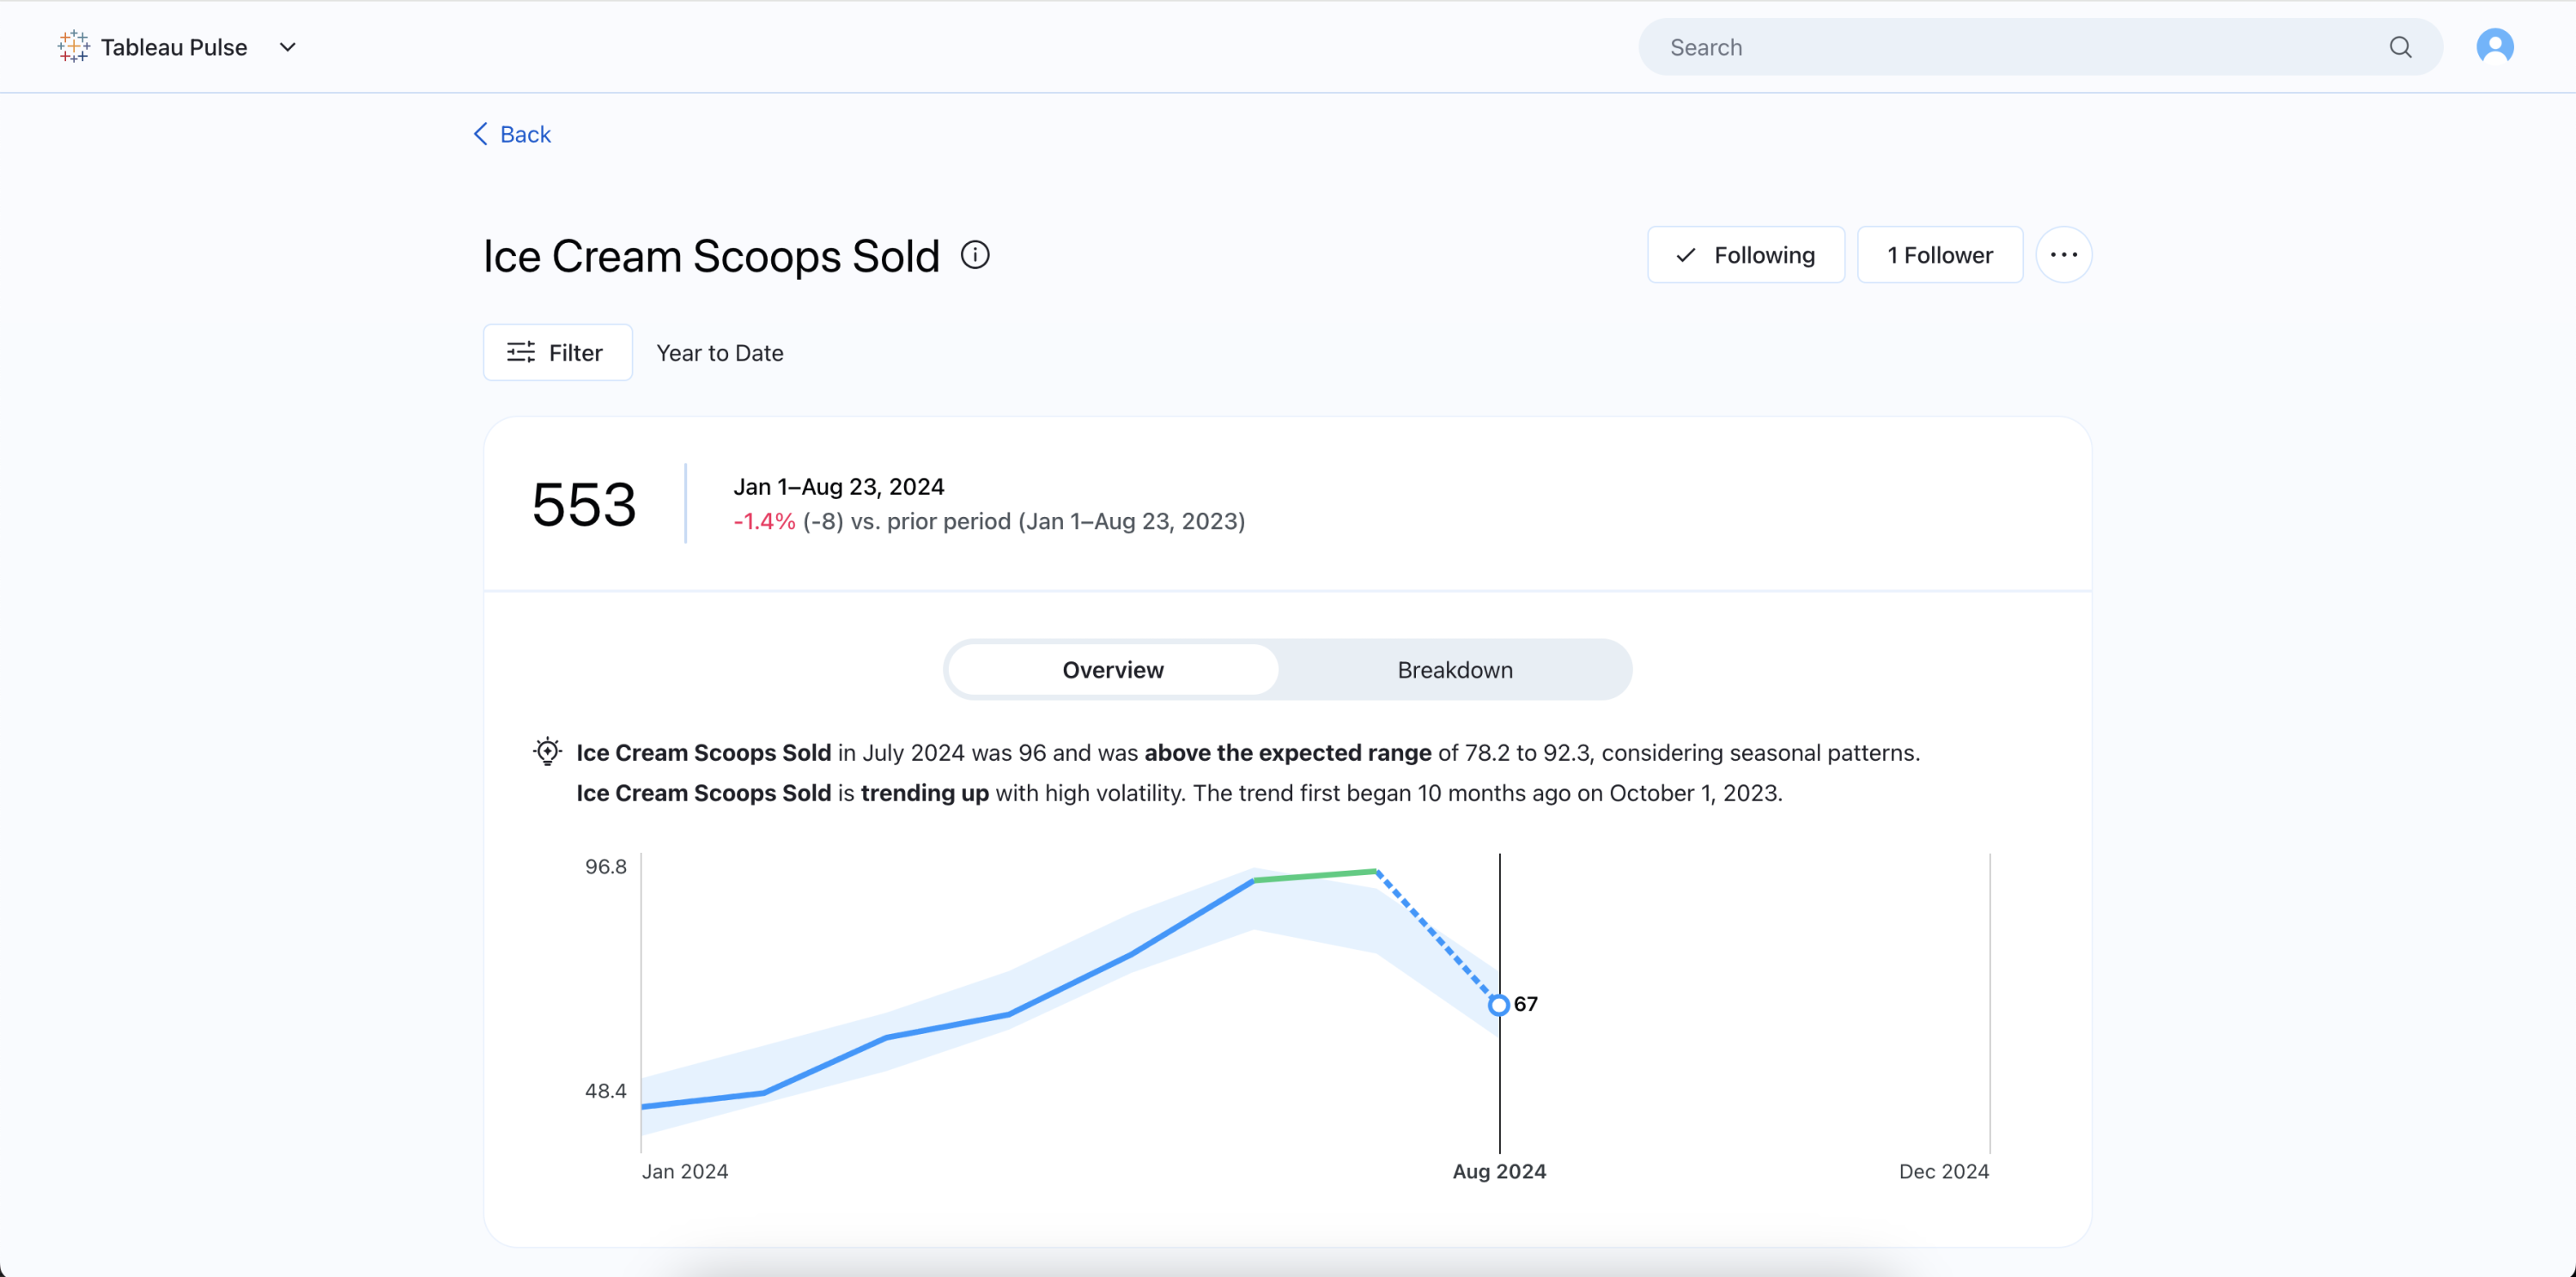
Tableau Pulse: Bättre insikter med säsongsvariation
Tableau Pulse återspeglar nu mer exakt det förväntade intervallet av mätvärden och känner igen ovanliga förändringar för data med säsongsvariationer och trender. *Lanserades augusti 2024
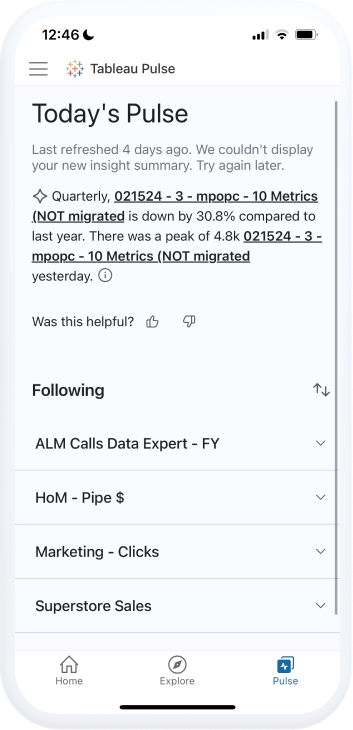
Tableau Pulse: Ordna och gruppera på Mobile
Möjligheten att sortera och ordna dina mätvärden för att organisera och utvärdera relaterade mätvärden tillsammans finns i Tableau Mobile-appen. Du kan gruppera dina mätvärden från telefonen baserat på mätvärdets namn, datakällan och när du började följa dem. Ställ in standardvyn så att den är konsekvent i dina e-postsammanställningar, webbvyn och Tableau Mobile-appen.
*Det här är en premiumfunktion som finns tillgänglig i Tableau+

Växla mellan Tableau Mobile-platser
Eliminera repetitiva manuella steg och spara tid genom att enkelt växla mellan flera molnplatser från en listruta i Tableau Mobile. Med funktionen för att växla till en annan webbplats slipper du söka manuellt och mata in en URL eller ange inloggningsuppgifter igen på nytt varje gång du växlar.
Funktionen är allmänt tillgänglig.
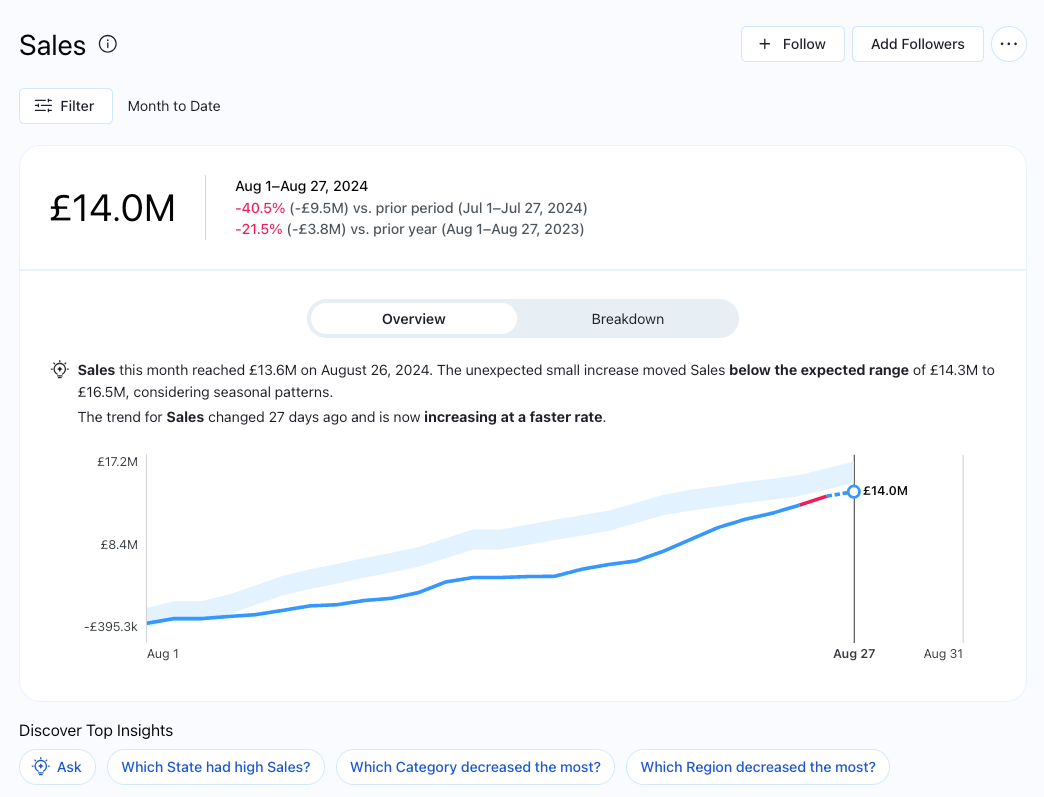
Tableau Pulse: Globala valutasymboler
Gör dina Tableau Pulse-mätvärden tydligare och mer personliga genom att visa rätt valutasymbol. Pulse stöder nu över 130 olika symboler. När du har angett valutasymbolen i din mätvärdesdefinition kommer värdet att användas i alla mätvärden som använder den centrala definitionen. *Lanserades september 2024
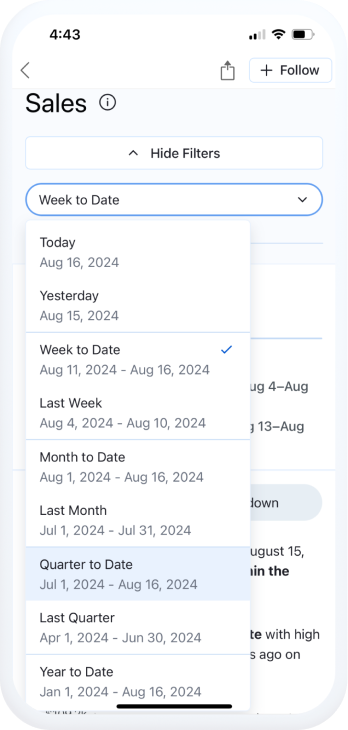
Tableau Pulse: Ändra tidsperiod på Mobile
Pulse på mobilen matchar nu bättre webbfunktionerna kring de vanligaste Pulse-interaktionerna. Välj rullgardinsmenyn ”filter” för att ändra tidsperioden för ett mätvärde när du bläddrar i dina mätvärden på mobilen – utan att behöva växla till webben för att utforska. *Lanserades augusti 2024
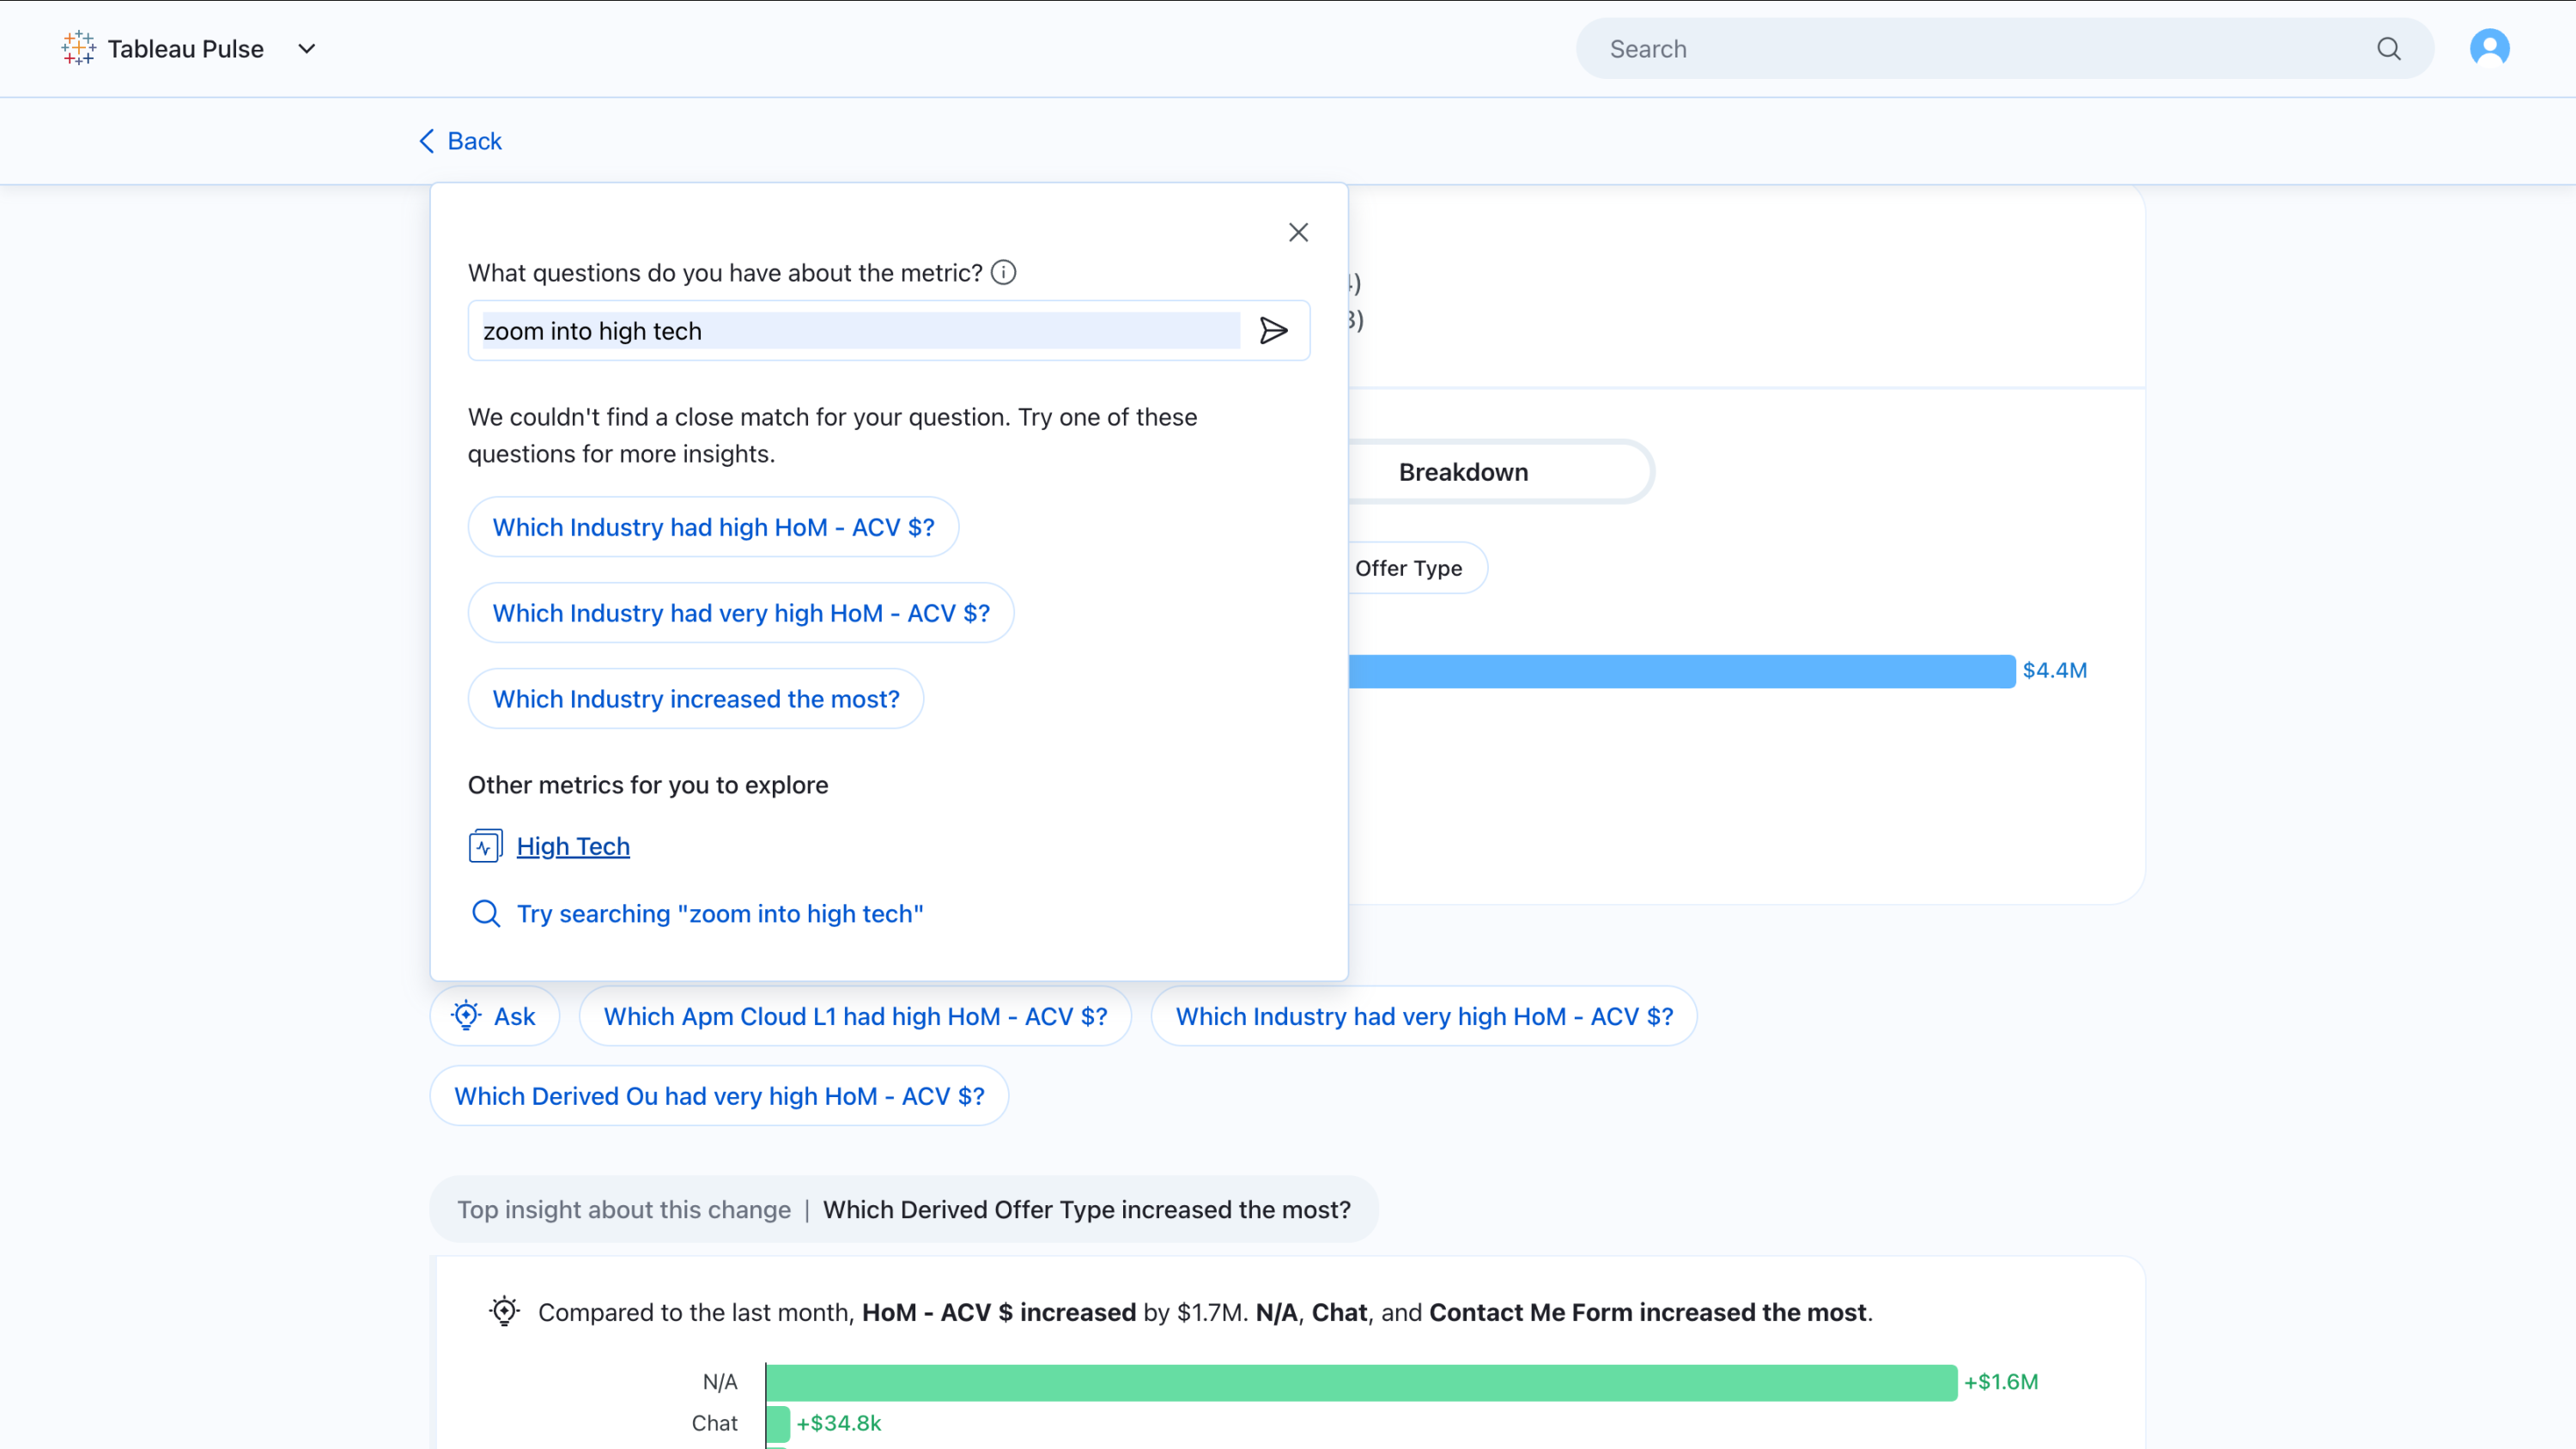
Tableau Pulse: Förbättrade mätvärden för frågor
Svara på frågor som sträcker sig längre än vad Pulse-insikterna tidigare kunde upptäcka. Fråga om ett annat mätvärde från samma mätvärdesdefinition för att bättre upptäcka relevanta insikter.
Det här är en premiumfunktion som finns tillgänglig i Tableau+ och lanserades i augusti 2024
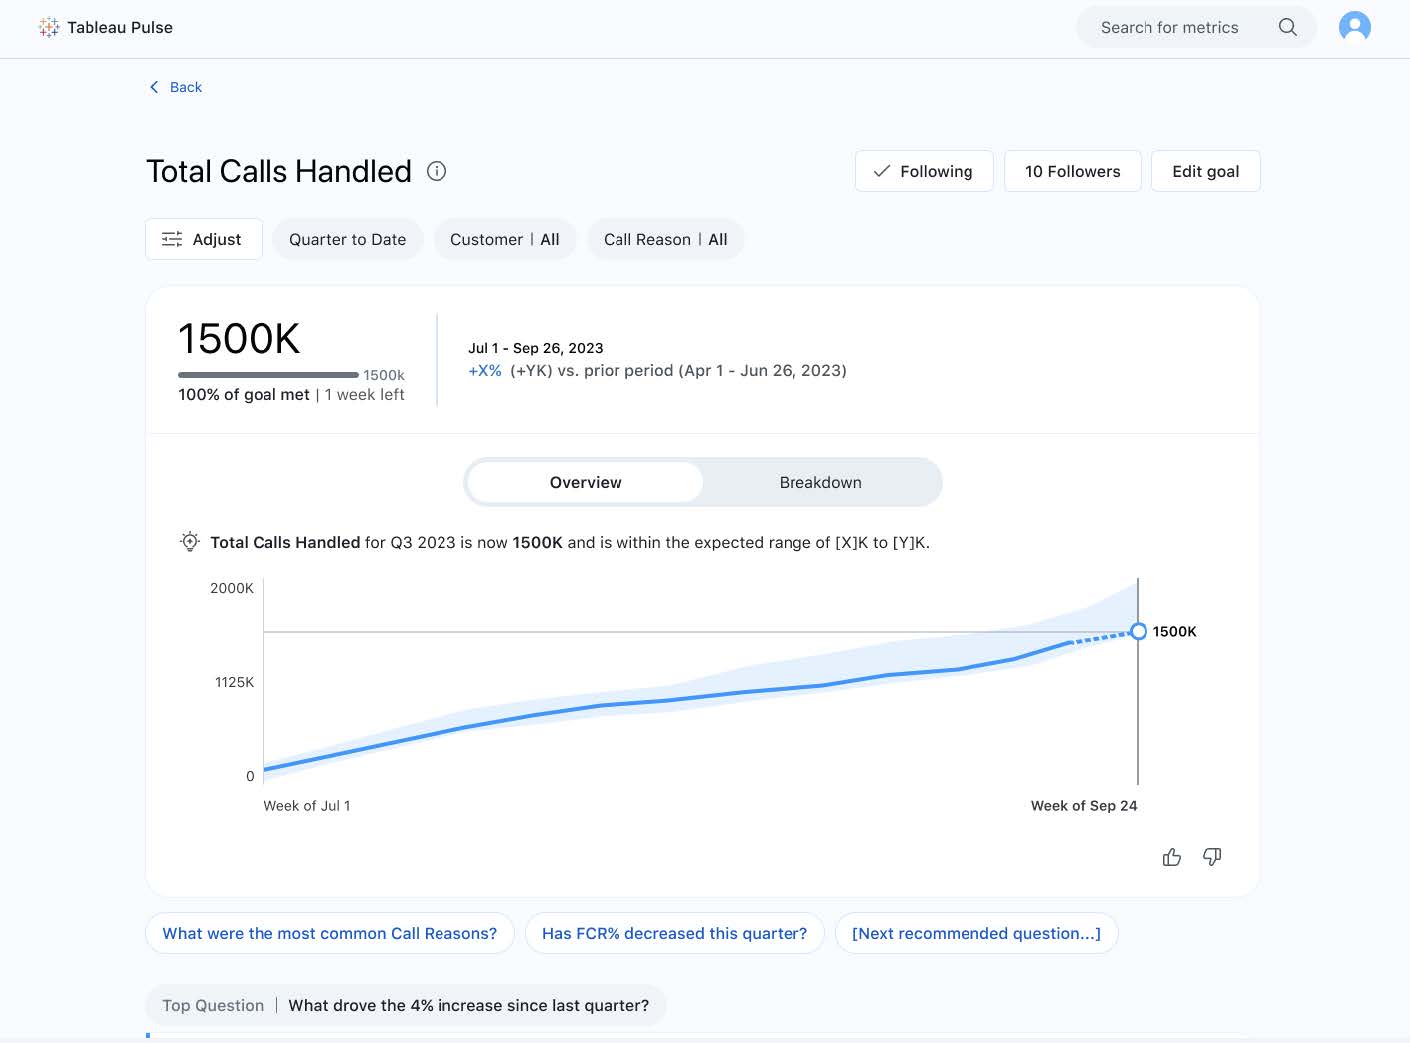
Tableau Pulse: Mål som skapats manuellt
Ställ in ett mål på sidan Insight Exploration och övervaka mätvärdenas prestanda mot det målet i olika arbetsflöden. Analytiker kan begränsa vem som kan skapa, redigera och ta bort manuella mål som är kopplade till en mätvärdesdefinition för att säkerställa att endast behöriga användare kan göra ändringar.
Det här är en premiumfunktion som finns tillgänglig i Tableau+ och lanserades i augusti 2024
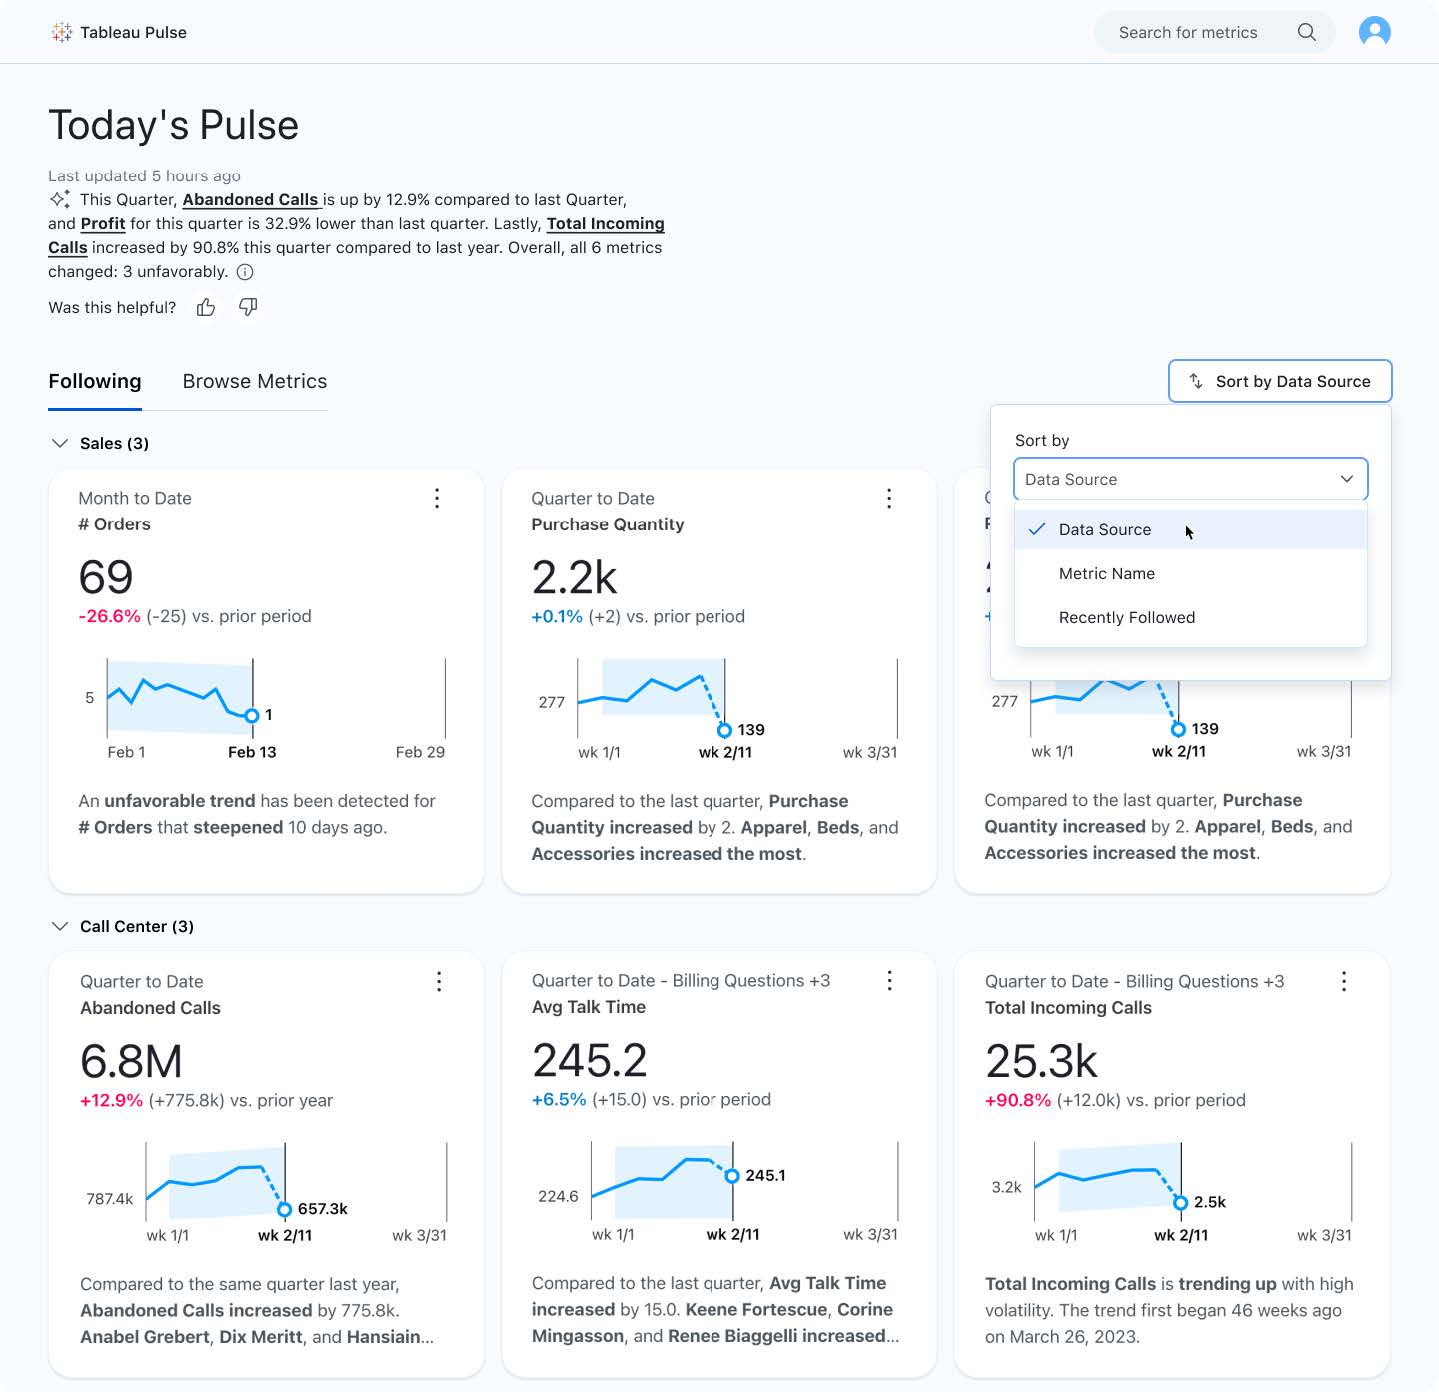
Tableau Pulse: Dynamisk sortering och gruppering
Sortera och ordna dina mätvärden med hjälp av metadata som mätvärdenas namn, datakälla och tidsintervall. Med den här funktionen kan du organisera och utvärdera relaterade mätvärden tillsammans. Upptäck viktiga mönster och trender i dina data med en flexibel och användarvänlig metod för organisering och gruppering av mätvärden.
Det här är en premiumfunktion som finns tillgänglig i Tableau+ och lanserades i augusti 2024
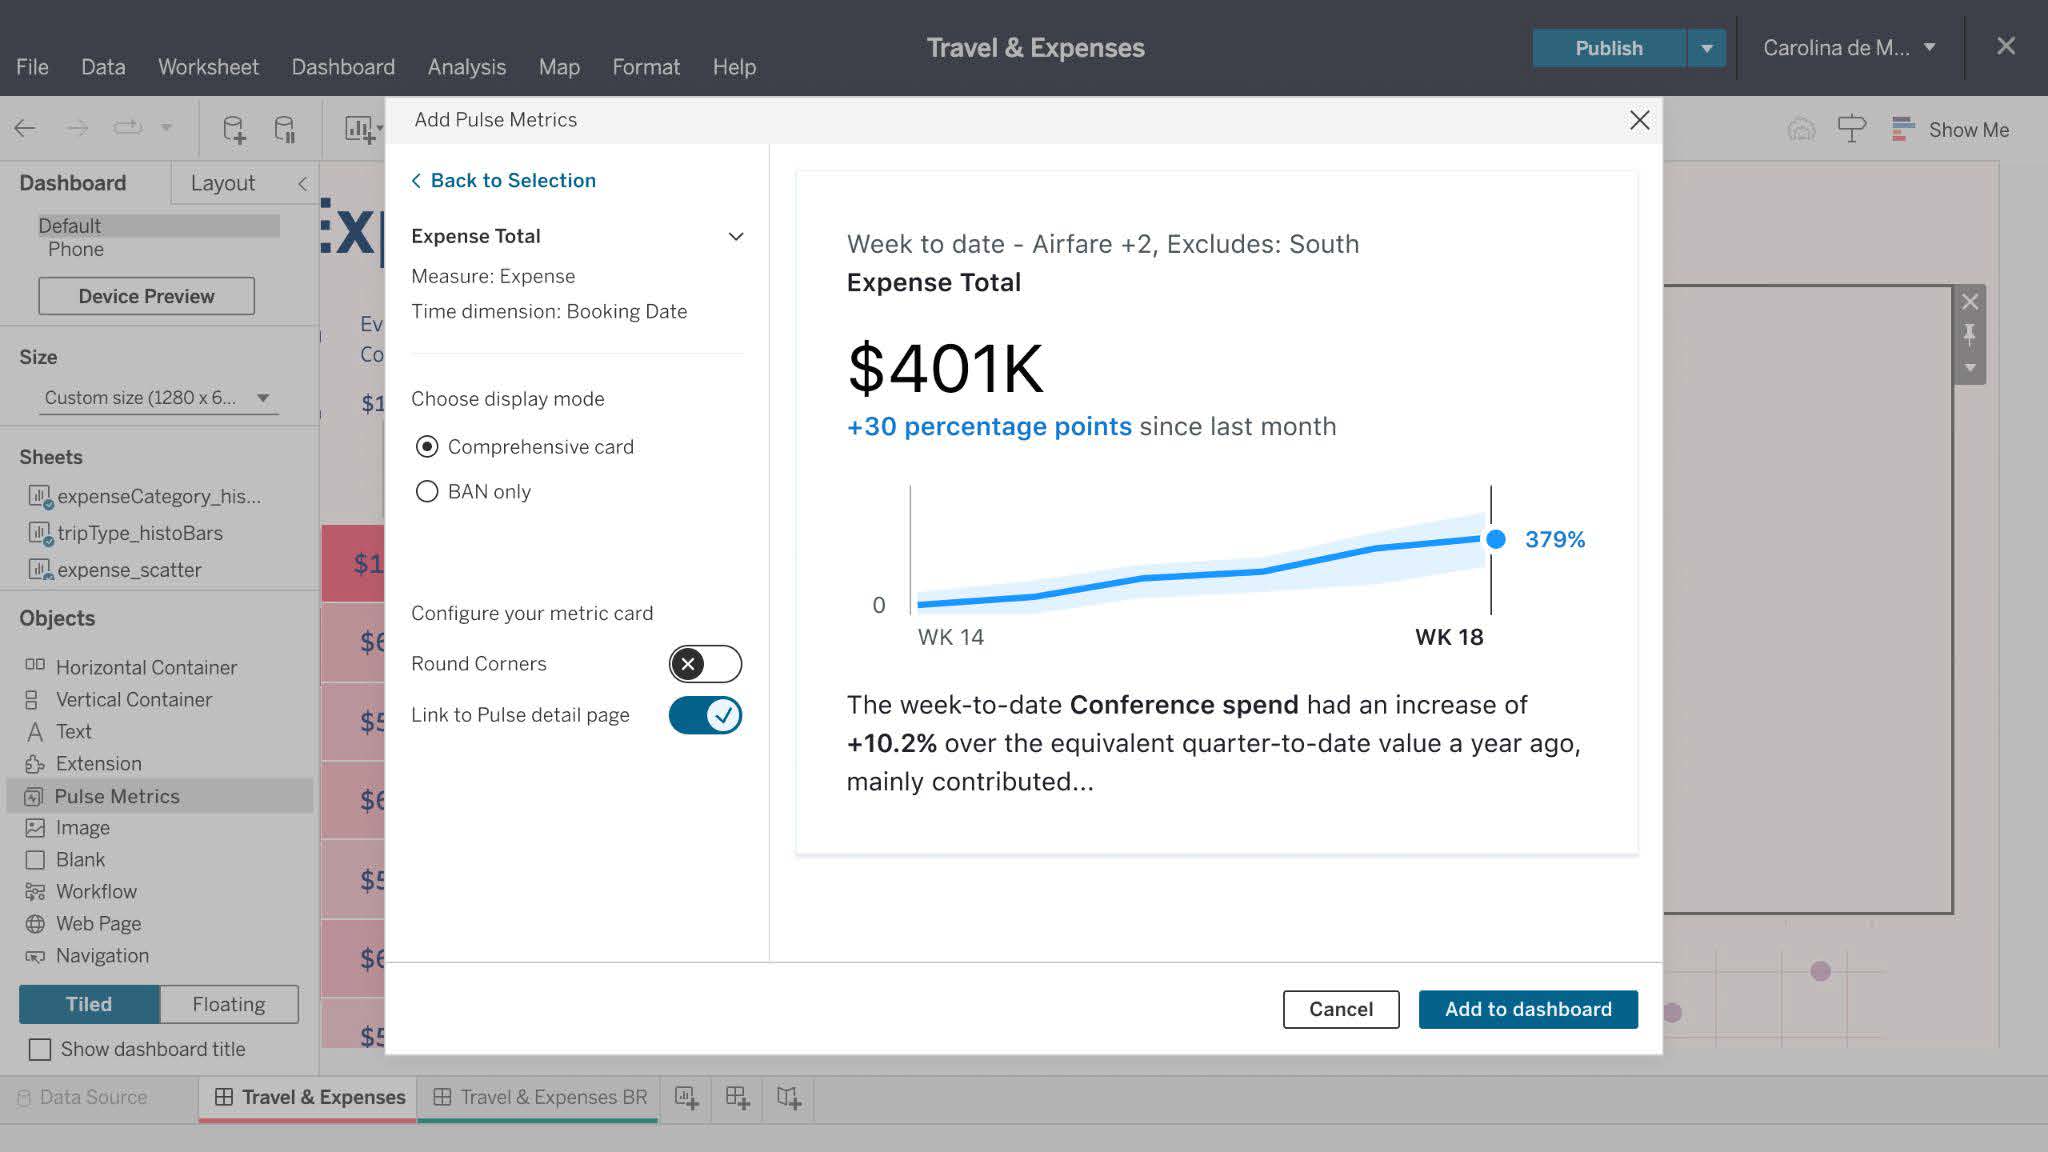
Tableau Pulse: Mätvärden i dashboards
Skapare av Tableau-dashboards kan nu bädda in Pulse-mätvärden med hjälp av ett inbyggt dashboard-objekt som är tillgängligt när du utvecklar dashboards både i Desktop och Server. Genom att bädda in Pulse-mätvärden i operativa, strategiska och prestationsbaserade dashboards kan användare klicka på ett mätvärde för att navigera till detaljsidan. Där kan de fördjupa sig i mätvärdestrender och läsbara insikter. *Lanserades augusti 2024
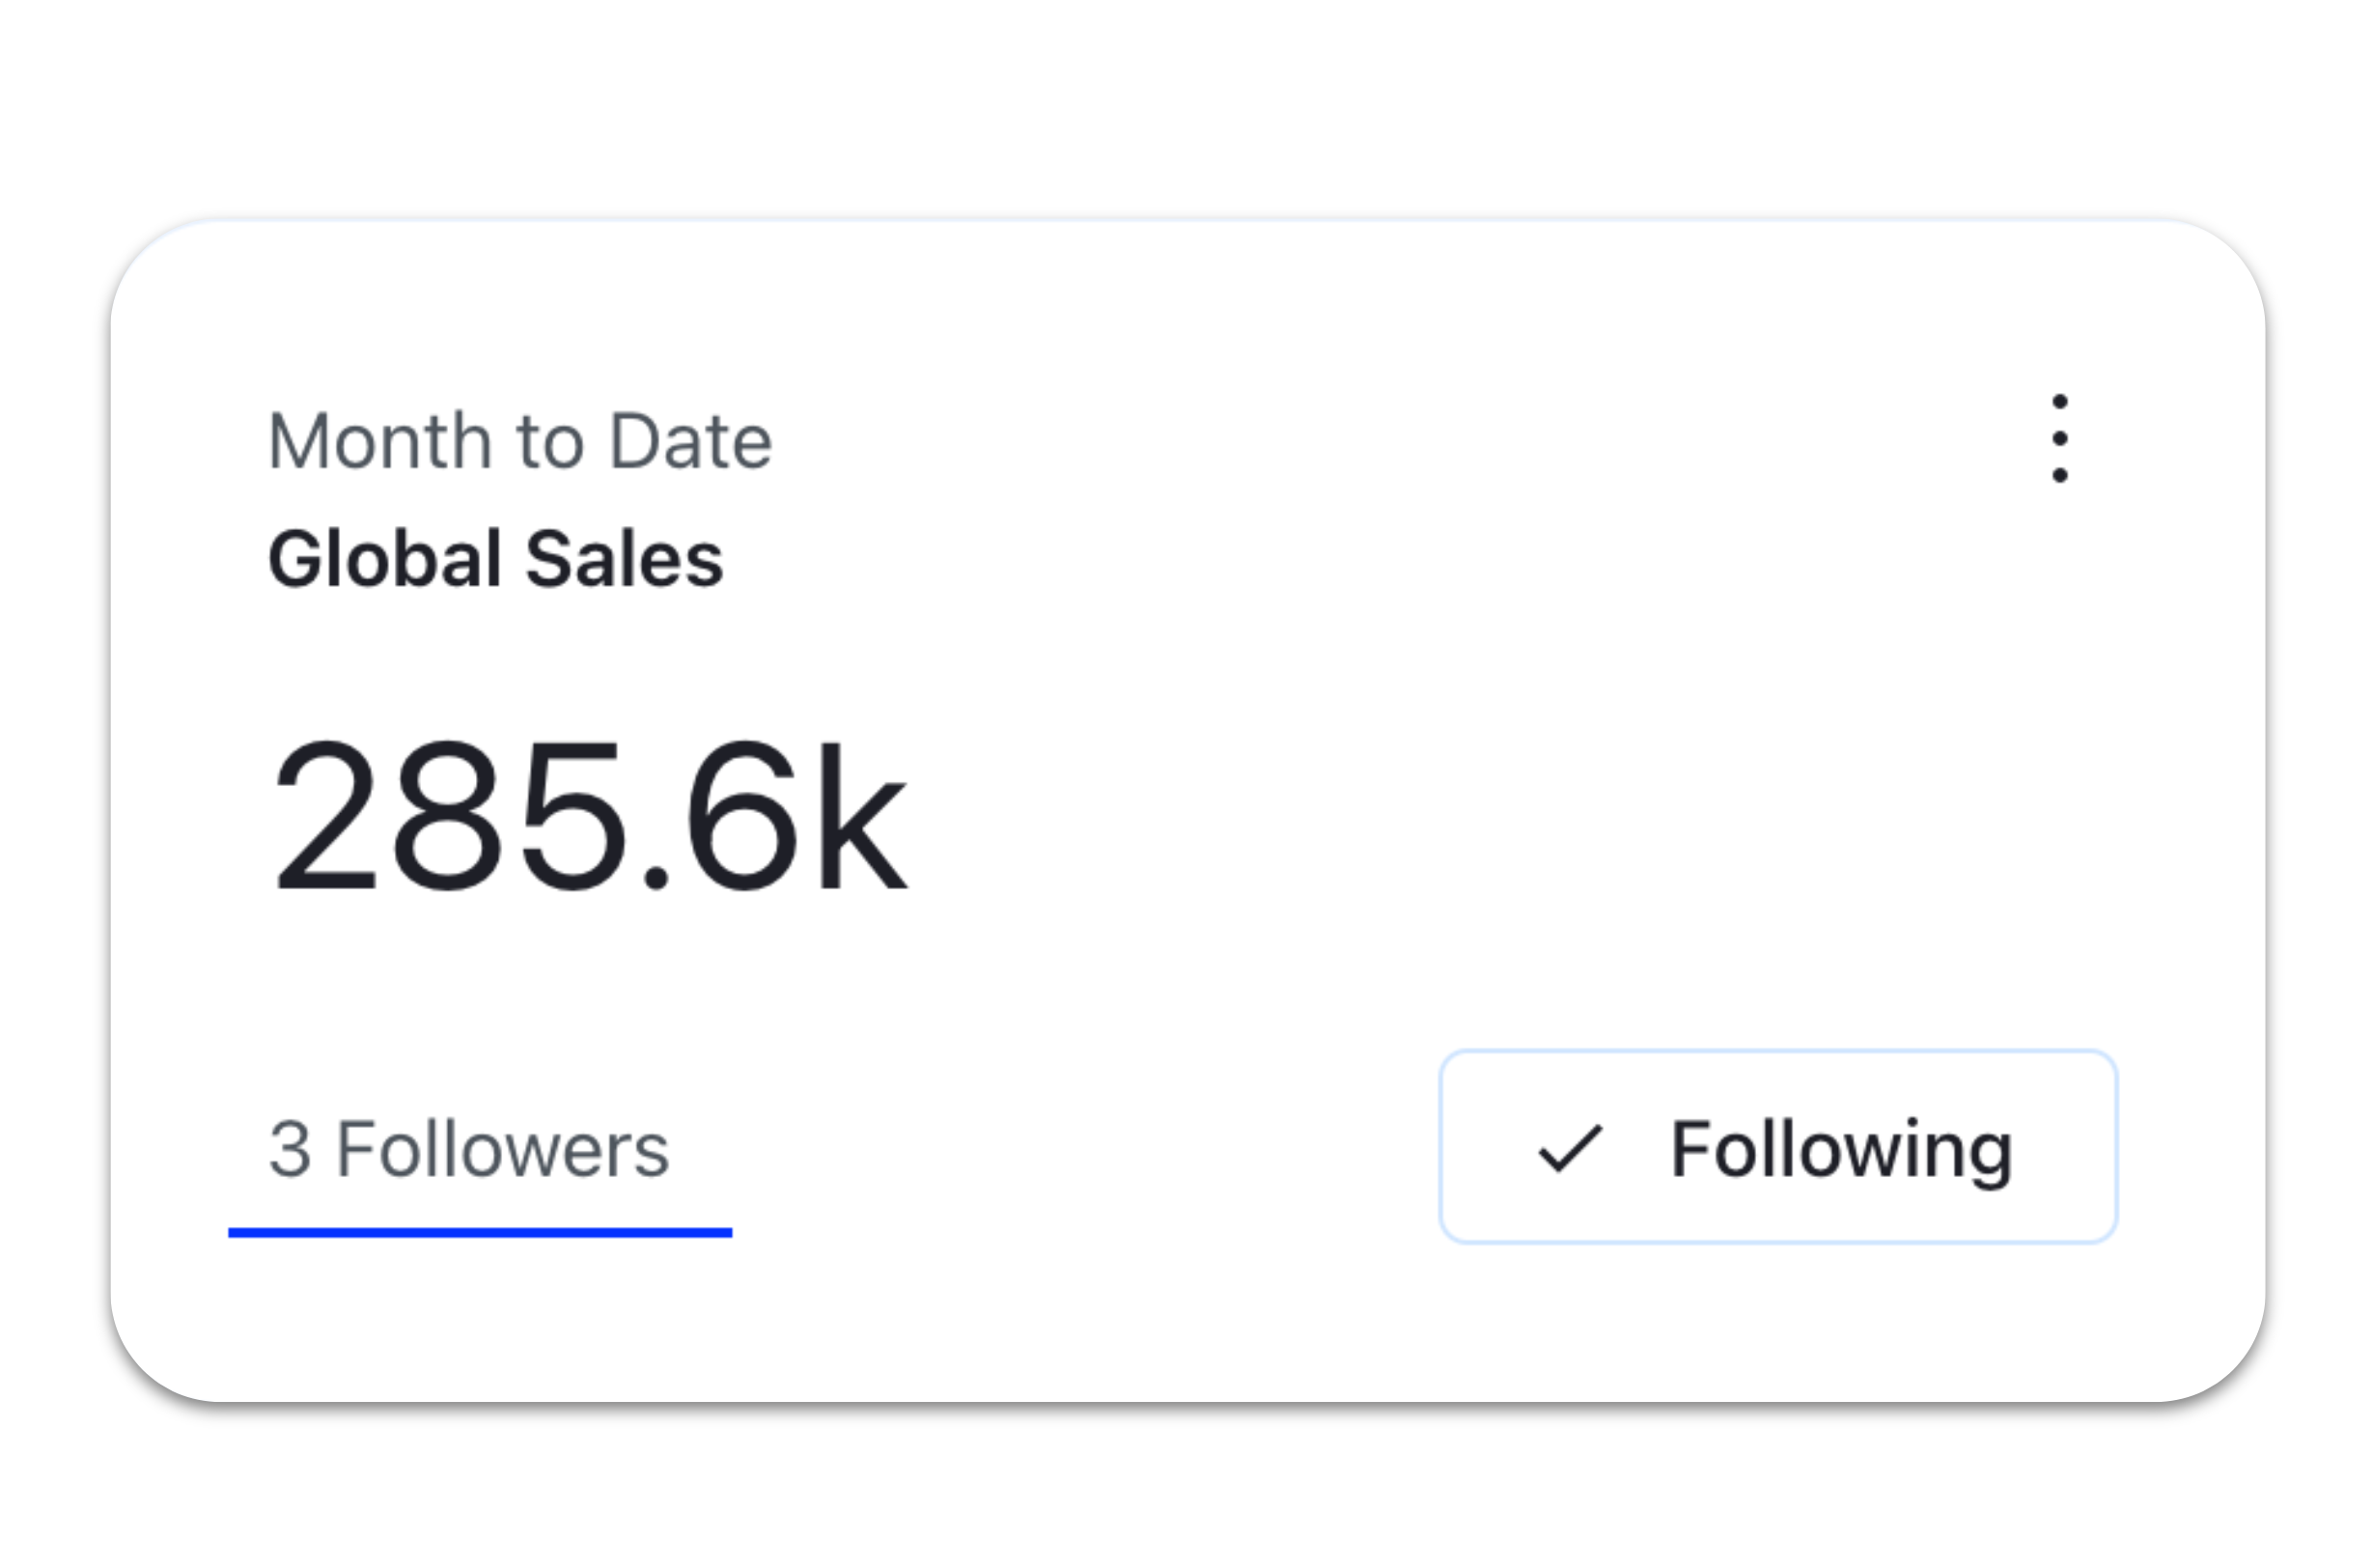
Tableau Pulse: Populära mätvärden
Tableau Pulse hjälper dig att upptäcka mätvärden enklare genom att visa antalet följare för mätvärdena på sidan för insiktsutforskning och mätvärdessökning. *Lanserades augusti 2024
Exchange på Tableau Public
Upptäck kostnadsfria dashboard- och visualiseringstillägg som är tillgängliga för Tableau Public-webbredigering och Tableau Desktop Public Edition. Förbättra din visuella analys med ytterligare funktioner och visualiseringstyper. Förbättra din dataanalysportfölj och ta fram nya insikter med anpassade visualiseringar och dashboards genom att utöka kärnfunktionerna i Tableau Public.
Bridge-stöd för Taco-filer
En undergrupp av kopplingar i Tableau Exchange är nu aktiverade för Tableau Cloud via Bridge, vilket gör dina data mer tillgängliga och enklare för dig att ansluta till.
Bland kopplingarna som stöds finns Actian JDBC, Altinity Connector for ClickHouse, Guidanz BI Connector, Couchbase Analytics, Stratio Crossdata, Data, Virtuality JDBC, Jethro ODBC, Oracle NetSuite, SAP Successfactors, ServiceNow, SingleStoreDB JDBC
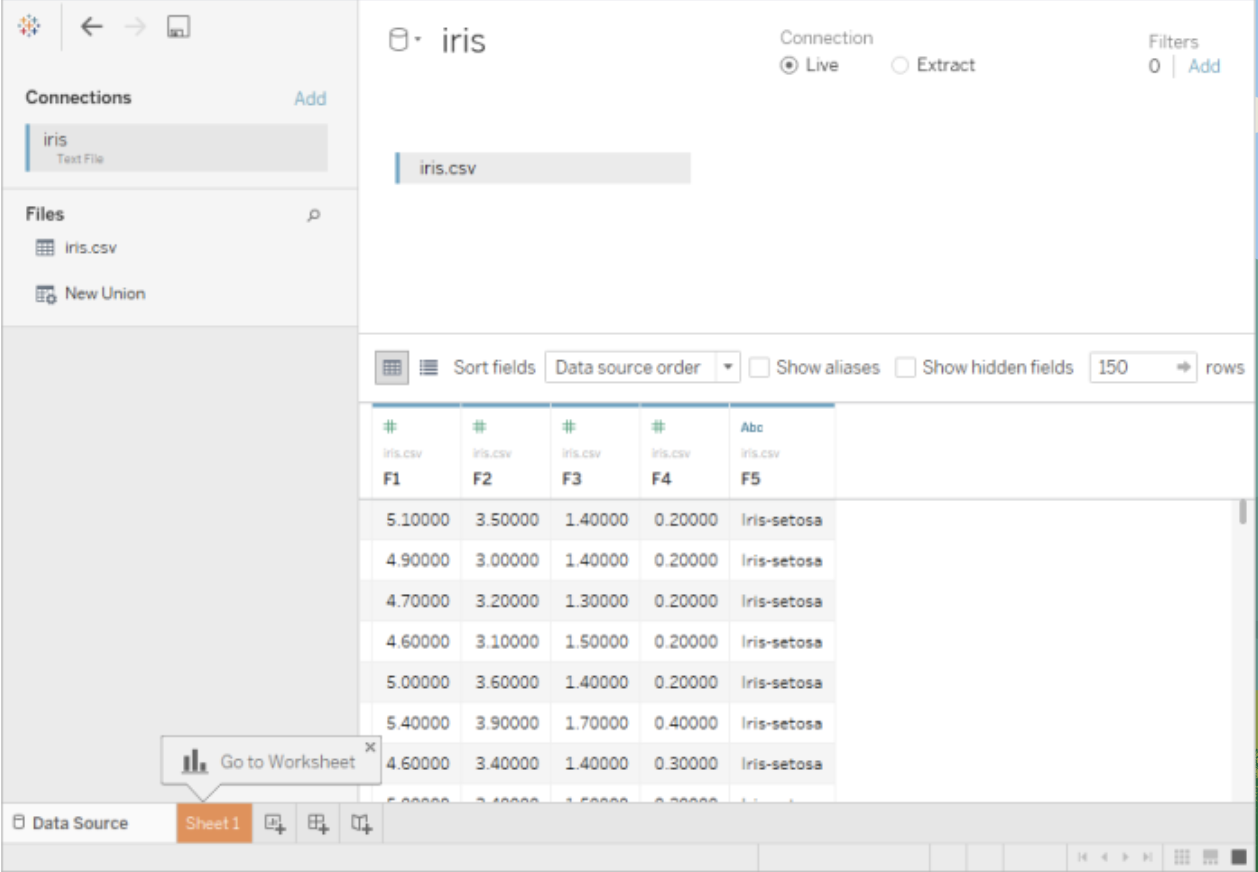
Stöd i Bridge för inbäddade platta filer
För Tableau Bridge på Windows kan du bädda in platta filer direkt i din Tableau-arbetsbok och få större tillgång till filbaserade källor. Spara tid genom att uppdatera inbäddade Excel-, CSV-, PDF-filer och spatiala filer.
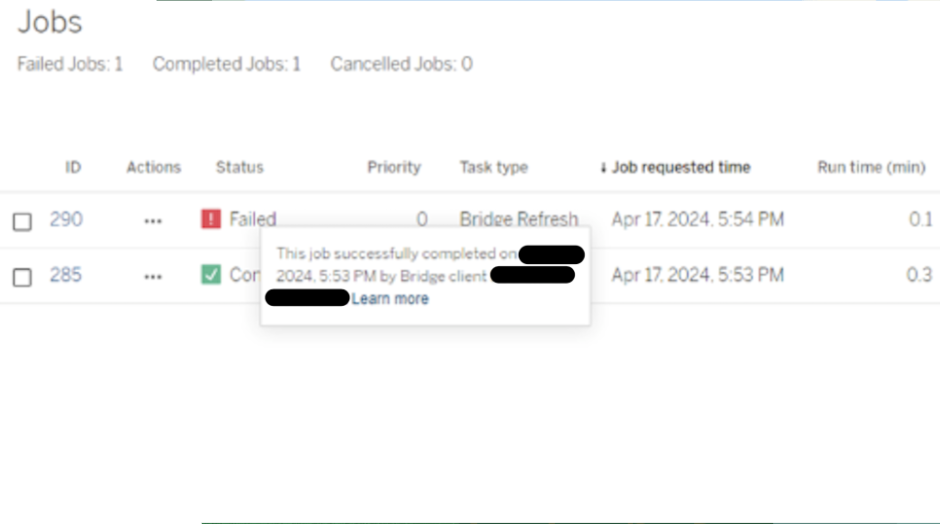
Förbättrad prestanda och övervakning i Bridge
Analysera data i Tableau Bridge snabbare och med större tillit. Livefrågor och inbäddade dataextrakt är betydligt snabbare (över 20 %) i både Windows och Linux, och på jobbsidan visas nu statusuppdateringar i realtid. Om du använder Bridge kommer du att se snabbare prestanda på dina jobb och kunna lösa problem med relevant felsökningsinformation.
Obs! Tillgänglig i en uppdatering i februari som kommer efter den ursprungliga tillgängliga versionen 2024.3
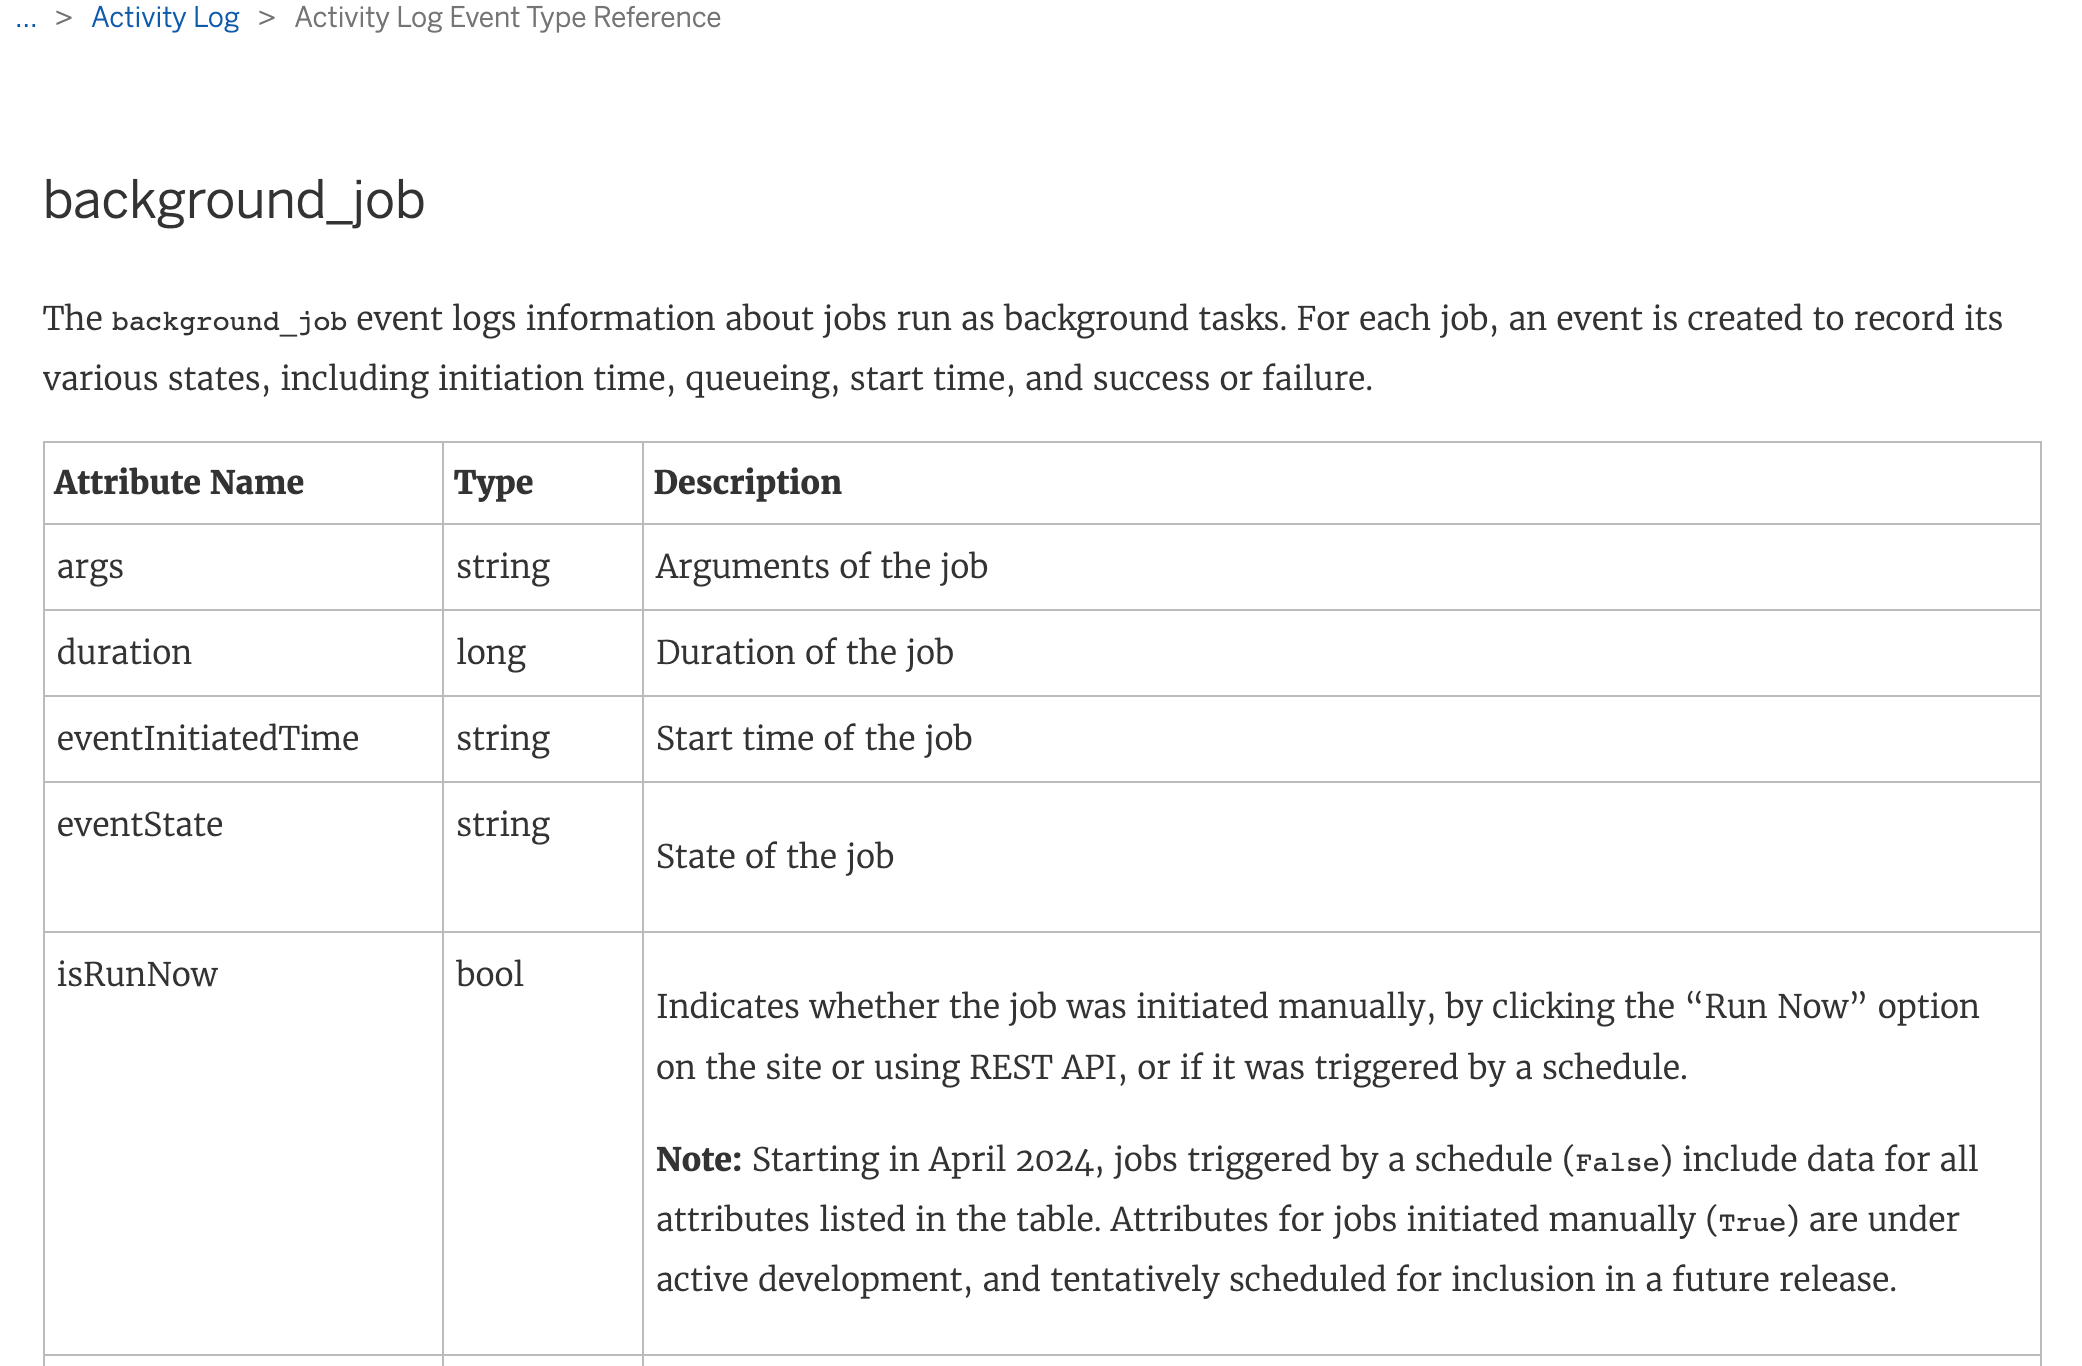
Förbättringar i aktivitetsloggen
Övervaka extraktuppdatering i realtid för att uppfylla kraven på dataaktualitet. Se till att data är aktuella och felsök snabbt problem med händelsetypen background_job.
Förbättringar i SAP HANA-autentisering
Förbättra säkerheten i din anslutning till SAP HANA från Tableau Cloud. Anslut till SAP HANA med hjälp av OAuth (JWT) och använd befintliga åtkomstpolicyer.
Obs! Tillgänglig i en veckoversion efter att den först blivit tillgänglig i 2024.3.
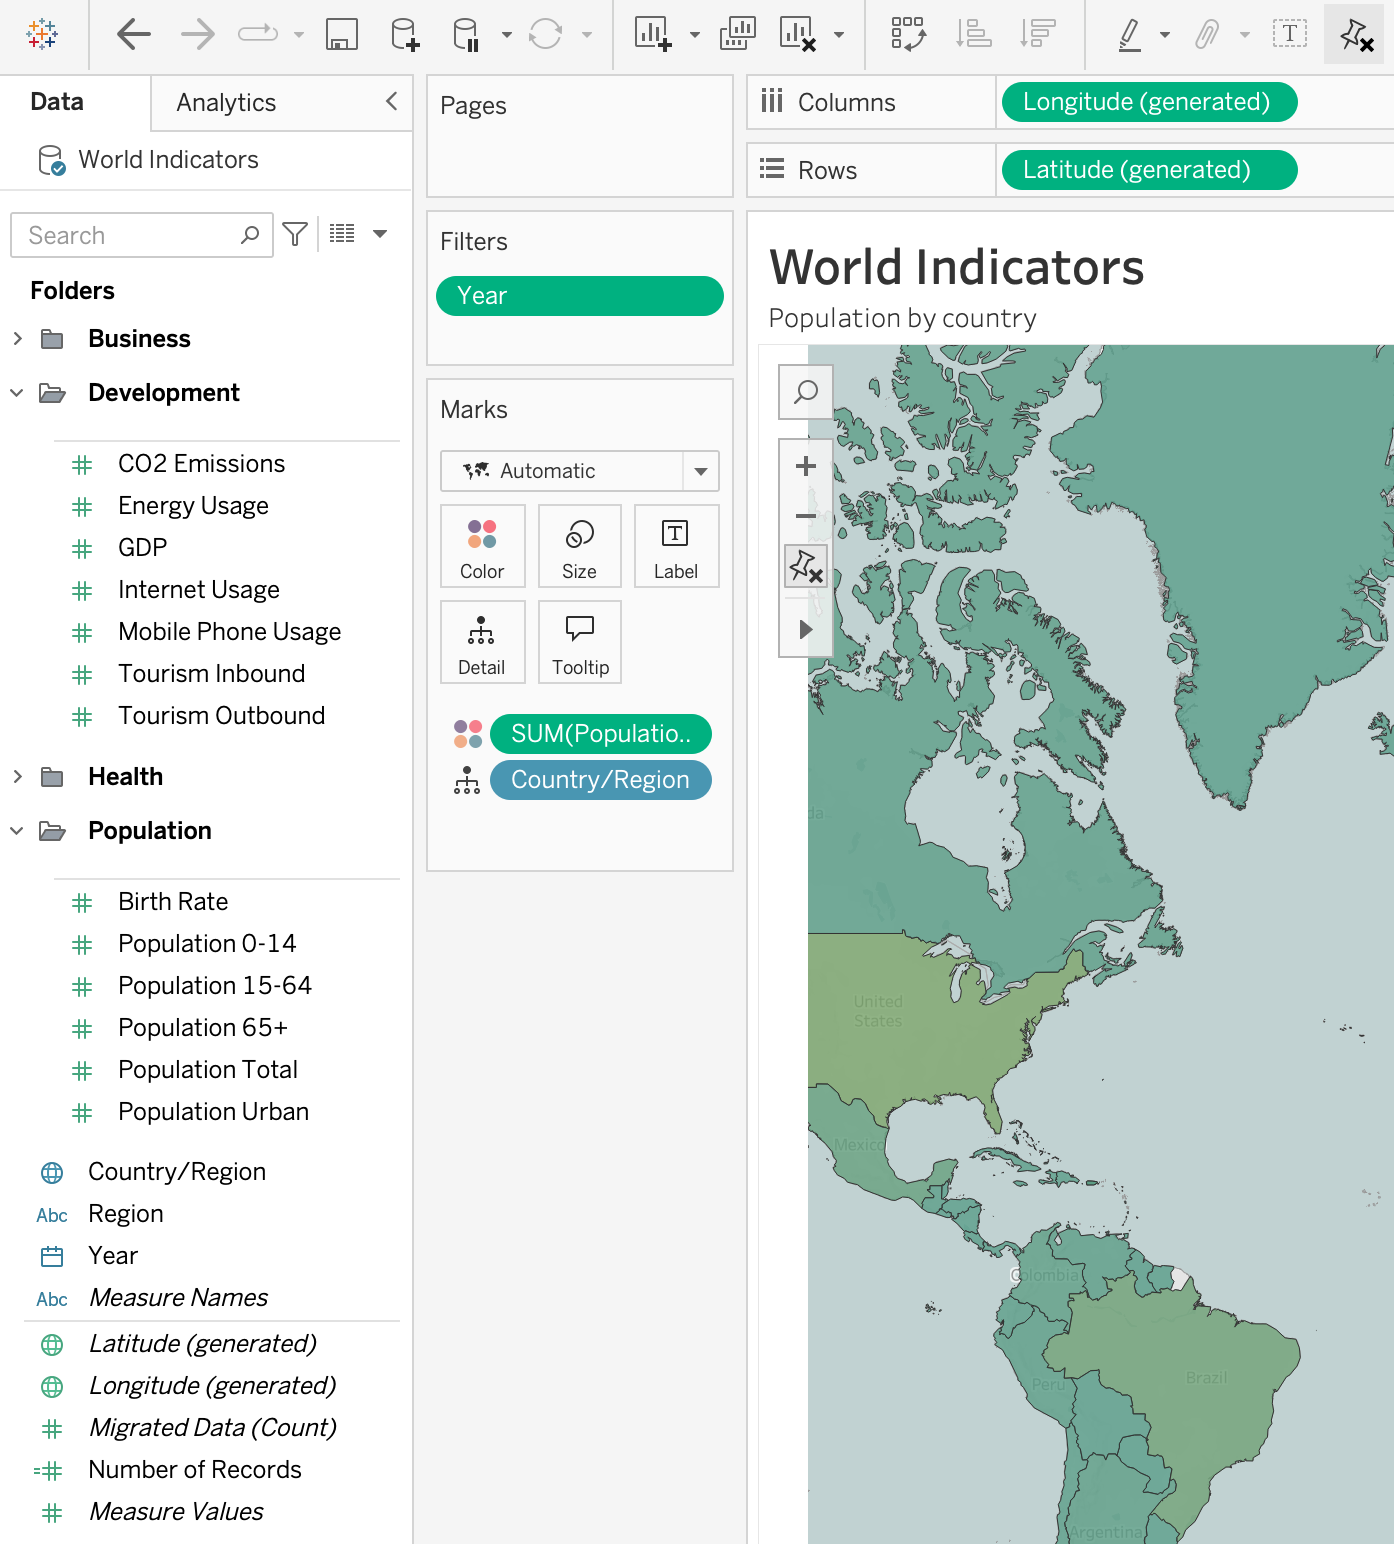
Behålla mappstrukturer vid datamappning med acceleratorer
Analytiker kan enkelt komma igång med Tableau-dashboards med hjälp av acceleratorer och bibehålla fältstruktur och kategorisering.
Migrera inbäddade OAuth-inloggningsuppgifter
När administratörer migrerar från Tableau Server till Tableau Cloud måste de kunna migrera Oauth-inloggningsuppgifter som är inbäddade i datakällor och arbetsböcker genom programmering och i stor skala. Nya REST API-metoder gör det möjligt för administratörer att ladda ner inloggningsuppgifter via programmering från Tableau Server och ladda upp dem på nytt till Tableau Cloud-platsen.
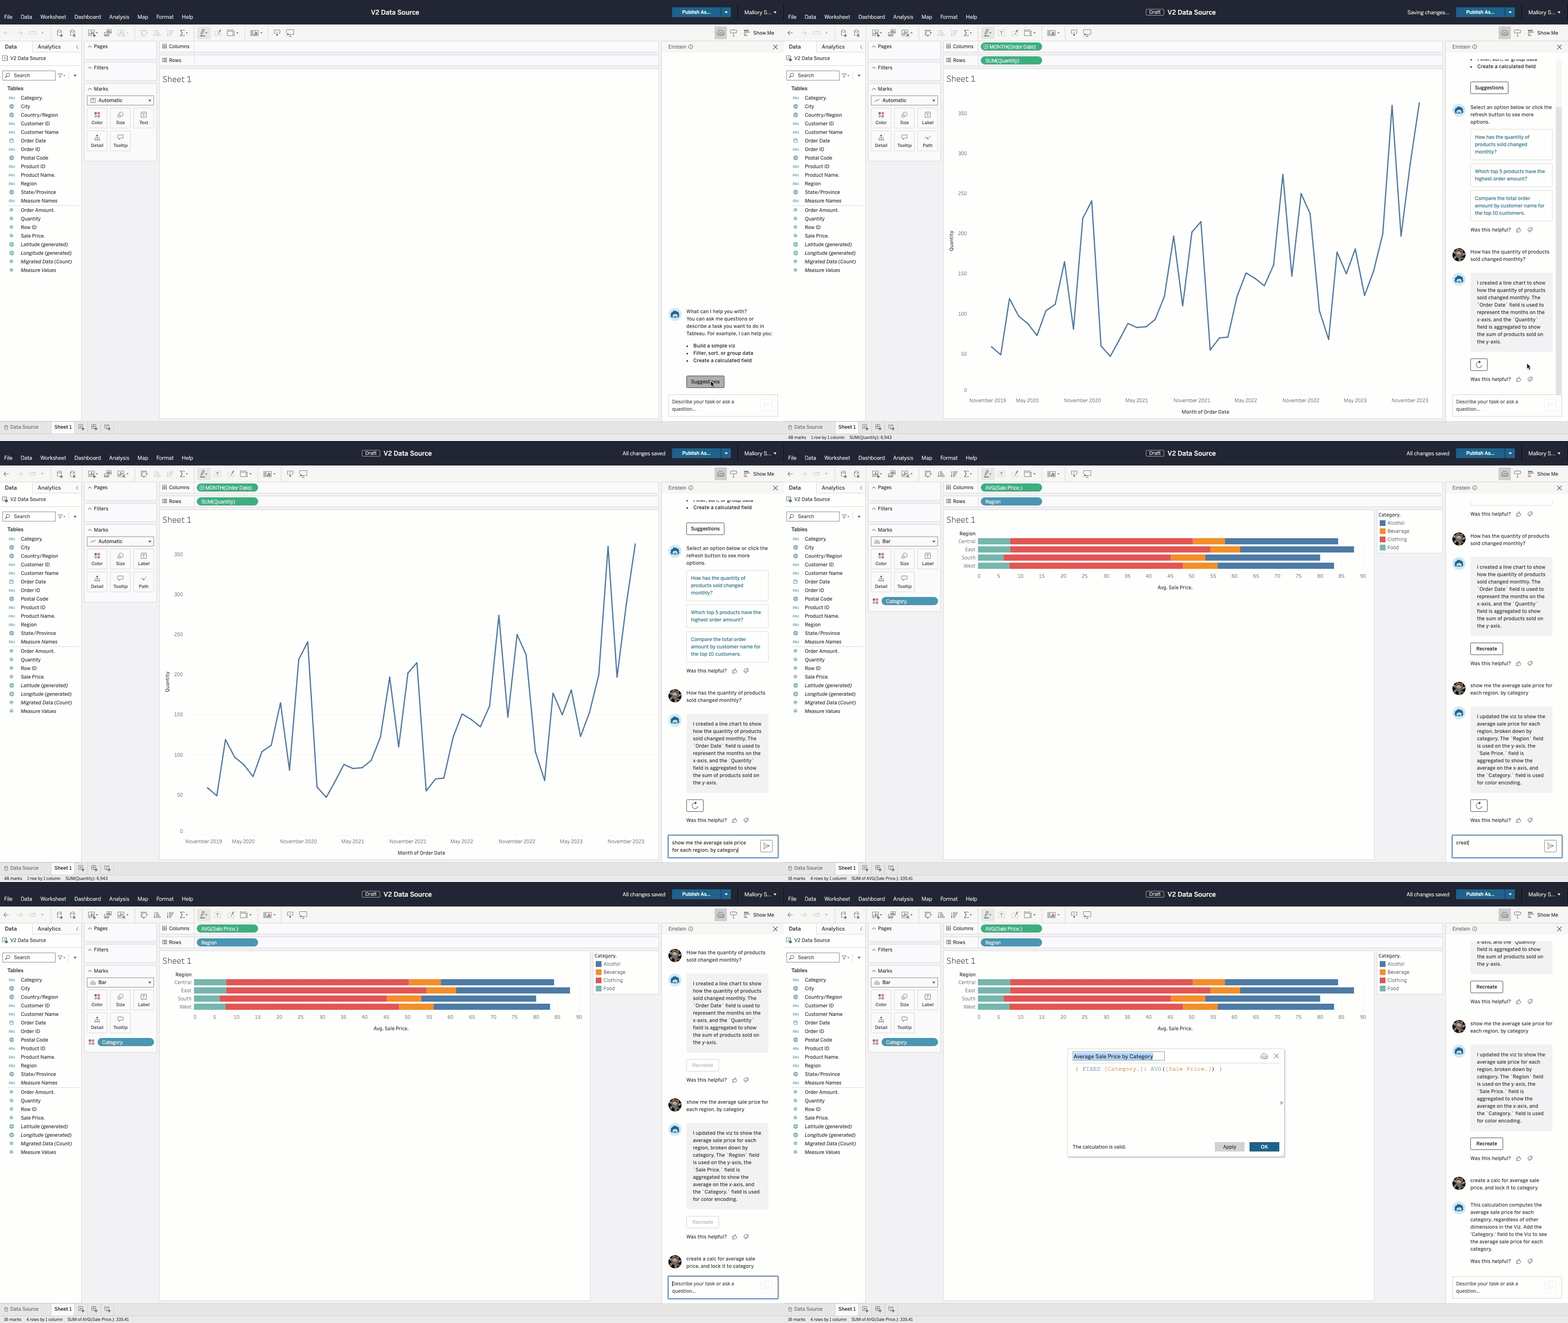
Einstein Copilot för Tableau: Webbredigering
Förenkla analysprocessen med hjälp av en pålitlig AI-assistent. Omvandla uppmaningar på naturligt språk till visualiseringar, formulera beräkningar för att förbättra din analys och få förslag på frågor baserat på dina data. Einstein Copilot för Tableau arbetar tillsammans med dig, så att du kan röra dig fritt mellan manuella dra-och-släpp-åtgärder och formelredigering till att kommunicera förfrågningar med Einstein.
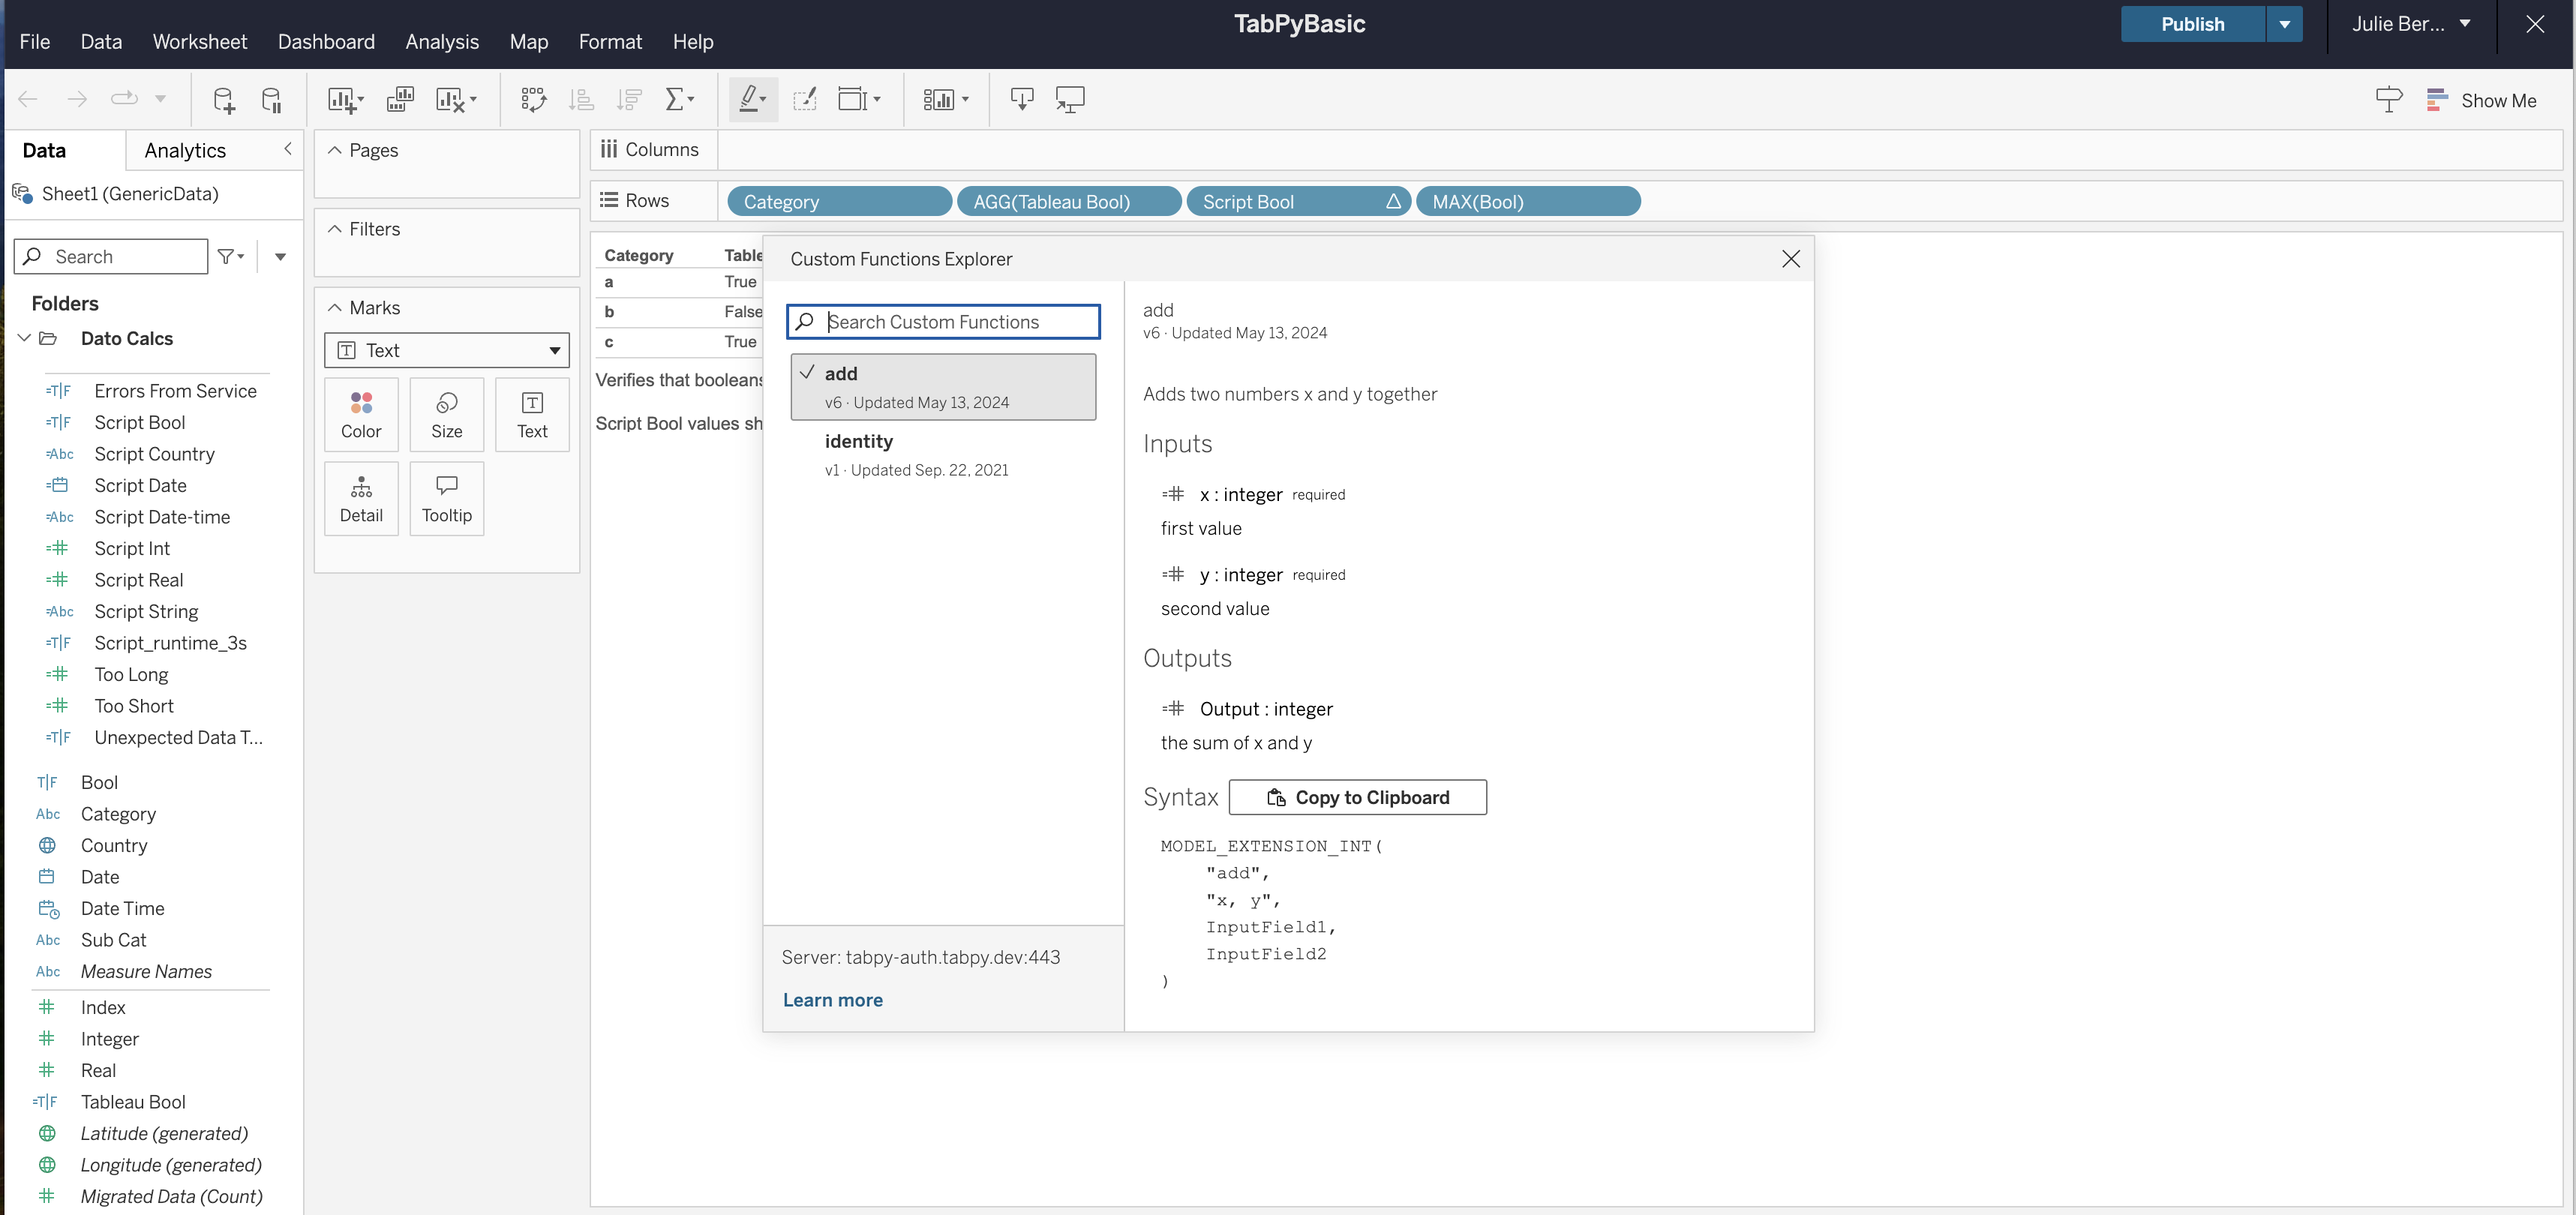
Custom Functions Explorer
Seamlessly integrate custom functionality into your Tableau visualizations without manual communication or external documentation. When analysts need to leverage deployed models or functions, they can open the custom functions modal, easily discover functions & their specificities, copy the syntax to use a particular function and seamlessly implement in downstream visualizations.

Tableau Pulse: Gå nedåt från fördelnings- eller insiktsdiagram
Hitta och förstå insikter snabbare och mer exakt genom att gå nedåt till ett specifikt dimensionsvärde. När du klickar på ett specifikt objekt i en insikt eller uppdelning får du se data och insikter som enbart fokuserar på det objektet. På så sätt kan du snabbt gå en nivå djupare för att bättre förstå förändringar i dina mätvärden.
Funktionen är allmänt tillgänglig.

Tableau Pulse: Inaktivera förväntade intervall
Gör dina insikter tydligare genom att stänga av oväntade värden direkt i mätvärdesdefinitionerna på fliken Insikter. På så sätt inaktiverar du det förväntade intervallet och tar bort insiktstexten och den blå visuella indikatorn från diagrammet på insiktssidan.
Funktionen är allmänt tillgänglig.

Tableau Pulse: Easier Metric Definition Deletion
Clean up your data more easily and get to your insights faster by deleting metric definitions directly from the All Metrics page with the new 'Delete Definition' button.

Tableau Pulse: Förändringar mellan perioder i fördelningsdiagram
Identifiera vad som driver din verksamhet med hjälp av dimensionsförändringar från period till period i fördelningsdiagrammet på informationssidan för mätvärden. Nu visar Pulse den procentuella förändringen av dimensionsvärdena bredvid det totala värdet i ditt fördelningsdiagram.
Funktionen är allmänt tillgänglig.
Förbättrad övervakning av resurser
Öka efterlevnaden av säkerhetskraven för IT-nätverk med ytterligare kontroll över säkerhetsfunktioner. Administratörer kan tillämpa en minsta TLS-version och anpassa HTTP-svarsrubriker med Resource Monitoring Tool.

Tableau Pulse: Mål för datakällan
Öka effektiviteten och precisionen genom att spåra mätvärdenas resultat i förhållande till målen från datakällan. I stället för att skapa ett mål för varje mätvärde kan du nu referera till mål från datakällan i mätvärdesdefinitionen. Målen för datakällan är valfria, gäller för alla relaterade mätvärden och kan användas på partiella och fullständiga perioder.
Funktionen är allmänt tillgänglig.

Tableau Pulse: Stöd för flera språk
Driv skalbarhet och minska antalet feltolkningar av dina affärstrender genom att få insikter på ditt lokala språk både på webben och i mobilen. Pulse är tillgängligt på alla språk som Tableau stödjer och följer även lokala inställningar i ditt Tableau-konto. Det betyder att specifika regionala inställningar, till exempel valuta, återspeglas i dina insikter.
Funktionen är allmänt tillgänglig.

Tableau Pulse: Gruppering efter tidsintervall
Få mer relevans från dina insikter och möjlighet att agera på dem genom att gruppera mätvärden efter tidsintervall. Det gör att du kan granska resultaten för mätvärden inom en specifik tidsram, utöver de befintliga grupperingsalternativen. Om du anger en standardvy används den för sammanställningar via e-post och Slack, i Tableau-mobilappen och på webben.
Funktionen är allmänt tillgänglig.

Tableau Pulse: Gruppera och sortera i Slack-sammanställningar
Organisera och utvärdera mätvärden med större relevans i Slack-sammanställningar med hjälp av gruppering och sortering. Inställningarna på fliken ”Följer” kommer att återspeglas i Slack-sammanställningarna.
Funktionen är allmänt tillgänglig.

Tableau Pulse: Länka relevant innehåll.
Få enkelt tillgång till innehåll som är relevant för analys genom att länka relaterat innehåll till mätvärden. Du kan nu lägga till upp till fem länkar i det grundläggande definitionssteget, som visas på sidan för insiktsutforskning och sidan för relaterade mätvärden.
Funktionen är allmänt tillgänglig.

Tableau Pulse: Hörnstil för Pulse-mätvärden
Förbättra utseendet på Pulse-mätvärdena i dina dashboards med möjligheten att växla mellan kvadratiska och rundade hörn. Du kan nu växla mellan olika hörnstilar för Pulse-mätvärden i inställningarna för Pulse-dashboardobjekt.
Funktionen är allmänt tillgänglig.

Tableau Pulse: Omarbetad startsida i mobilen
Få enkel åtkomst till och jämför nyckelmätvärden på den omarbetade Pulse-startsidan i mobilen. Du kan nu se minst tre mätvärden på en gång och omedelbart identifiera trender för att snabbare och enklare fatta beslut.
Funktionen är allmänt tillgänglig.


