Large data sets can now be extracted and visualized in just 2-3 hours, compared to an overnight process
Employee training for Tableau only takes 1-2 days, where they used to take more than ten days to gain confidence with BI tools
Analytics is now self-service, eliminating the need for business users to wait for specialist experts to access insights
Democratizing analytics capabilities across the organization
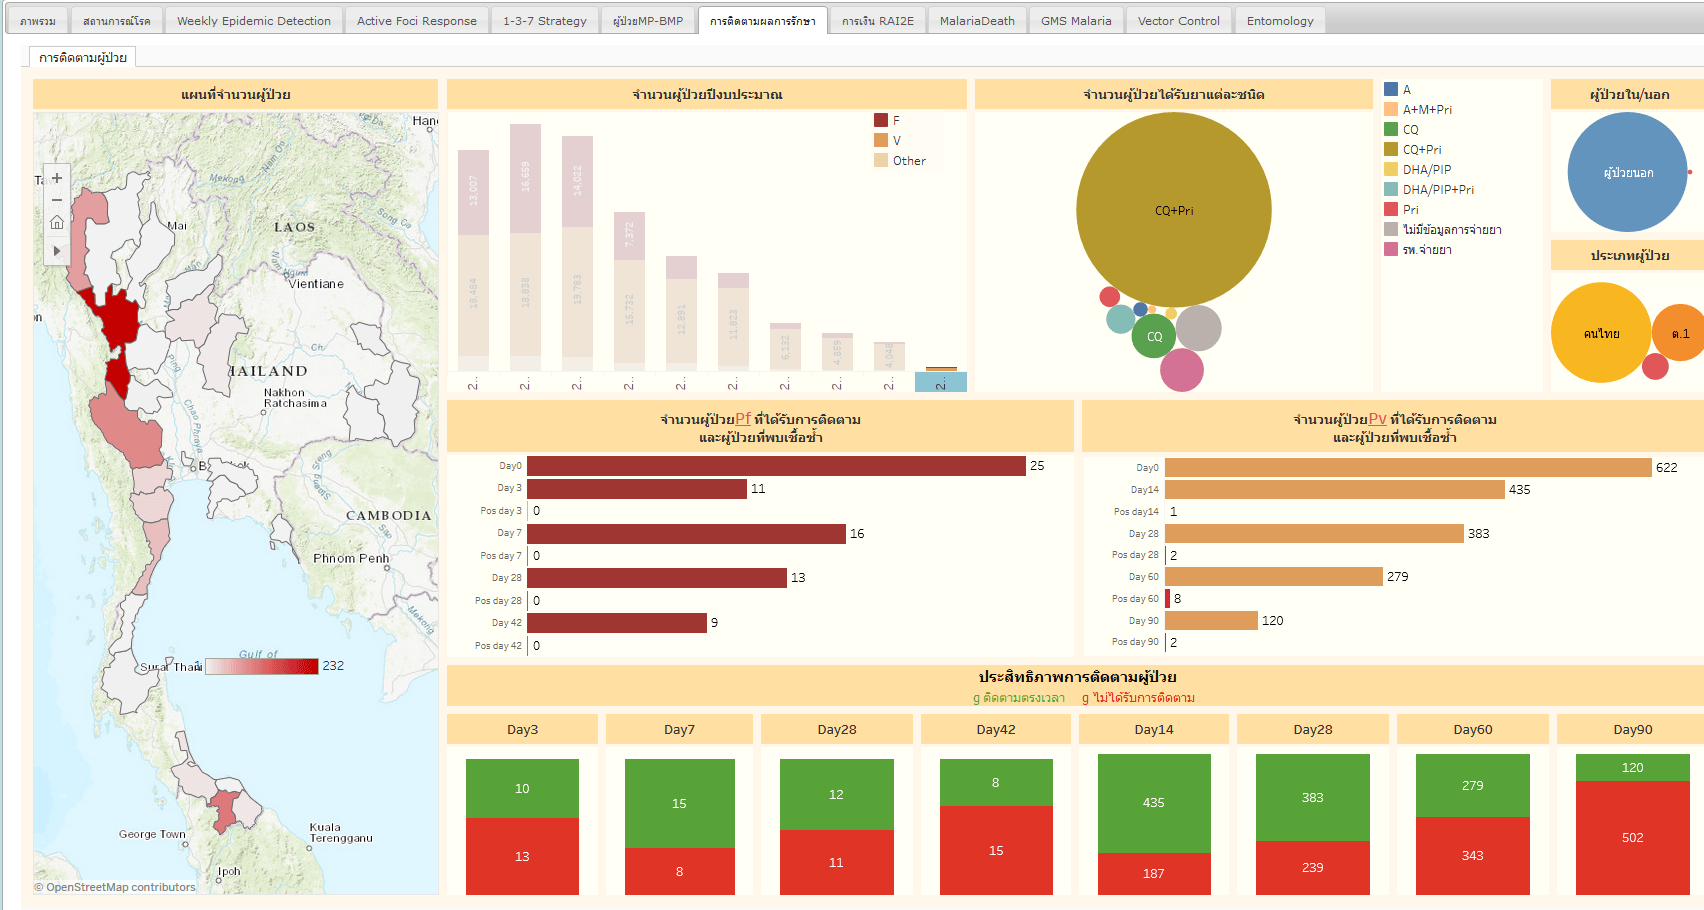
The Department of Disease Control (DDC) is an important government department under the Ministry of Public Health in Thailand responsible for the public health of the Thai people through disease prevention and control. To achieve this mission, they have tapped on data as a strategic asset. Using Tableau, the DDC was able to efficiently work with large sets of data to understand the healthcare situation amongst the Thai population to guide policy working. Complicated data sets were also broken down according to common disease types such as dengue, malaria and food poisonings and regularly published on its website to inform and educate the public.
Traditionally, data analysis had been a very manual process. When dealing with data from multiple sources and in various formats, the DDC often had to rely on a small group of skilled programmers to clean and prep the data for analysis. This process took a lot of time. To improve its operational efficiency, the DDC wanted to democratize analytics to more of its employees who are medical professionals so that they can benefit from the data insights directly.
One of Tableau’s greatest strengths is the way it allows us to quickly and easily connect with our data. As an analytics tool, it also helps people to understand their data better and make decisions.
This was made possible by using Tableau - even with just basic computer skills, DDC employees were able to create their own visualizations within one to two days, hugely reducing the reliance on IT teams. This marked improvement from the past, when employees can take more than ten days to gain enough confidence with business intelligence tools. Extracting data from complex data sets also became much faster; instead of an overnight process, this can now be done in just two to three hours.
“The learning curve with Tableau is very short compared to traditional business intelligence tools, and it makes it easier for our business users to interact with and make sense of their data,” said Yongjua Laosiritaworn MD, MPH, PhD who is the Information Centre Director at DDC.“ One of Tableau’s greatest strengths is the way it allows us to quickly and easily connect with our data. As an analytics tool, it also helps people to understand their data better and make decisions.”

Mapping the pandemic
Democratizing analytics capabilities across the organization afforded the DDC a critical advantage in managing the Covid-19 crisis. When employees in the field responsible for disease control are equipped with the skills needed to work with data insights, they can plan in advance knowing where, which group and when there might be an outbreak. For instance, following a recent outbreak, DDC was able to identify a specific region of concern and create a control zone to minimize the spread.
During the pandemic, the DDC relied heavily on Tableau to inform its response. They have had to maintain oversight on the situation over the whole of Thailand and leveraged Tableau to consolidate information from various regions in the country. By developing real-time visualizations to understand the impact of Covid-19 in different regions, they could remain agile to make real-time public health decisions.
Data has also been a critical asset to support the efficient allocation of resources. The DDC collates data from 500-600 hospitals in their data warehouse - ranging from the number of available hospital beds, availability of medicine and vaccinations and number of patients serving quarantine. Combining all this information in a central place like Tableau empowered the DDC to better manage their resources in line with the most immediate priorities.
It has also been crucial for the DDC to maintain public trust and confidence. They rely on data as a single, objective source of truth and frequently publish visualizations on their website to keep people informed of the ongoing situation. As the situation continues to evolve, the DDC is able to maintain this an effective channel of communication with the public.
One of the Department of Disease Control's major missions is to protect Thai people from sickness. Accurate and easy to understand data in the form of Tableau visualizations will help the department to achieve this mission.
The future of healthcare
The pandemic has cast a spotlight on the need for the DDC to rely on data-driven decision-making. Still, they must be intentional about maintaining a data-first approach even beyond Covid-19.
"One of the Department of Disease Control's major missions is to protect Thai people from sickness. Accurate and easy to understand data in the form of Tableau visualizations will help the department to achieve this mission," said Dr Laosiritaworn.
At the same time, the healthcare industry as a whole has become more mature in their understanding and advocacy of data-driven decisions. They have a responsibility to make accurate and timely decisions that have profound implications on their broader community. They must continue to invest in strengthening their data competencies - both with regard to data tools and upskilling - to deliver quality care experiences.
For one, the DDC plans to mature its use of analytics with machine learning and AI. This will allow them to better leverage data analytics as a tool to not only streamline their operations but also turn to more granular data insights to support efforts to diagnose, develop treatment plans and predict future diseases.

