Monitor your Snowflake account cost and usage
Diving into a new technology can often feel risky, but with the growth of the cloud, more organizations have decided it’s time to leverage the speed, flexibility and scale that moving to the cloud offers. More specifically, many customers are leveraging the partnership of Snowflake—the data warehouse built for the cloud—with Tableau.
No matter where you are in your own cloud story, you’re likely invested in a number of initiatives—things like managing costs, optimizing performance, mitigating risk, and ensuring adoption. To address these top-priority items, Tableau has designed a number of dashboards in partnership with Snowflake. Now IT departments and stakeholders can seamlessly explore these initiatives to maximize your technology investment.
"These Tableau dashboards help monitor and manage our Snowflake deployment, which ensures we maximize Snowflake effectiveness and efficiency."
 |
 |
 |
Snowflake Cost Monitoring Dashboards
By hosting these views on Tableau Server, you can also take advantage of additional features. For example, the Account Usage views provide information down to the user level. Tableau’s user-based filters ensure that managers aren’t able to drill down to teams other than their own, while also providing more detail to administrators. Setting up data-driven alerts also allows real-time notification in the event daily or monthly spend crosses a given threshold.
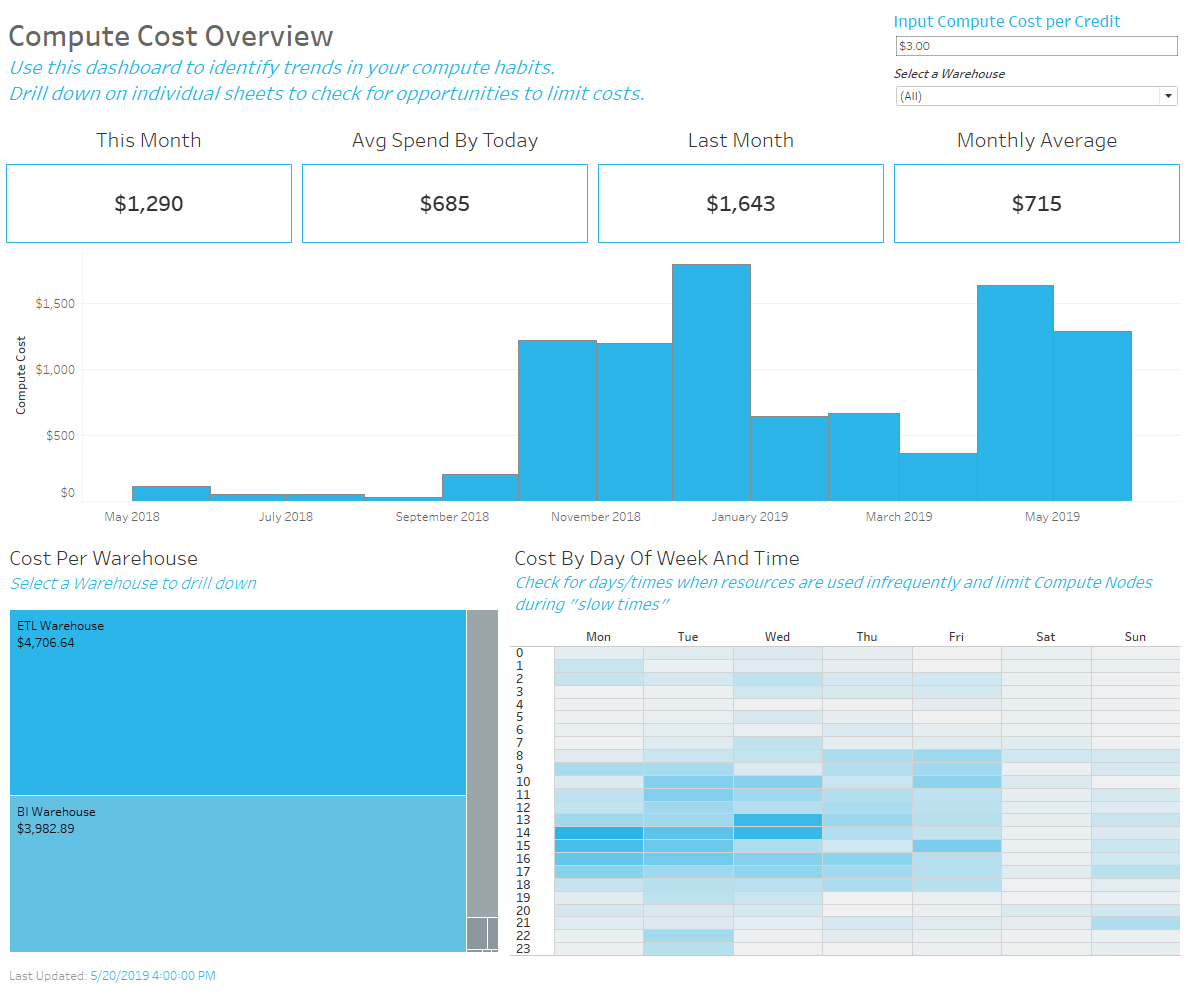
The Compute Cost Overview dashboard can be used to understand credit burn, plan budget allocation, and identify peak outliers to reduce unnecessary spend. For example, you can identify times of the day when utilization is lower and optimize Warehouse sizing accordingly. At Tableau, our Enterprise Analytics team uses these dashboards to uncover emerging user patterns and optimize Warehouse cost efficiency.

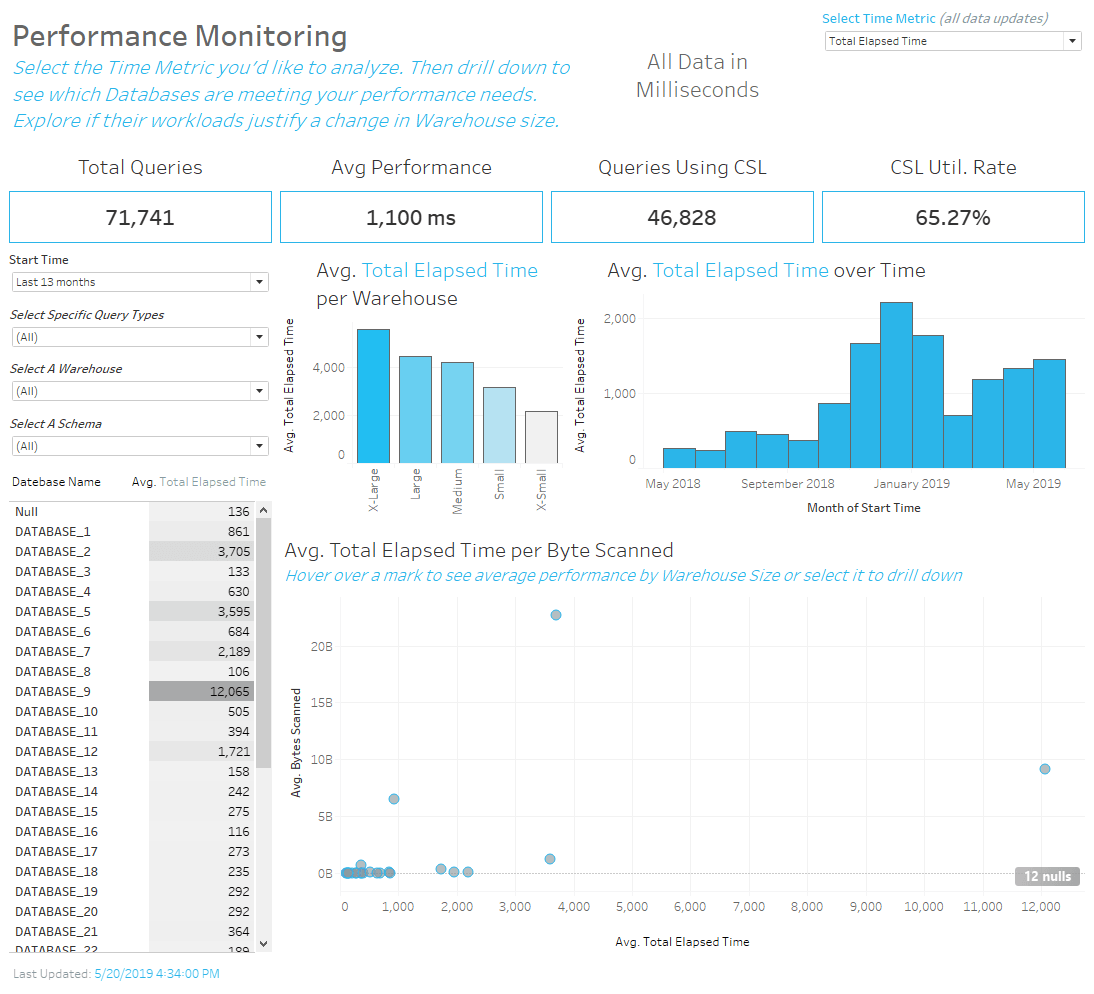
With the flexibility of the cloud, it’s important to make sure you’re getting the performance you’ve been planning for. With the Performance Monitoring dashboard you can dig into the data to see if you’re meeting the SLAs you’ve established. Using Tableau’s drill-down capability, identify any workloads outside of those SLAs that could be optimized with a different warehouse, and take action on any outliers skewing the experience of your data stakeholders.

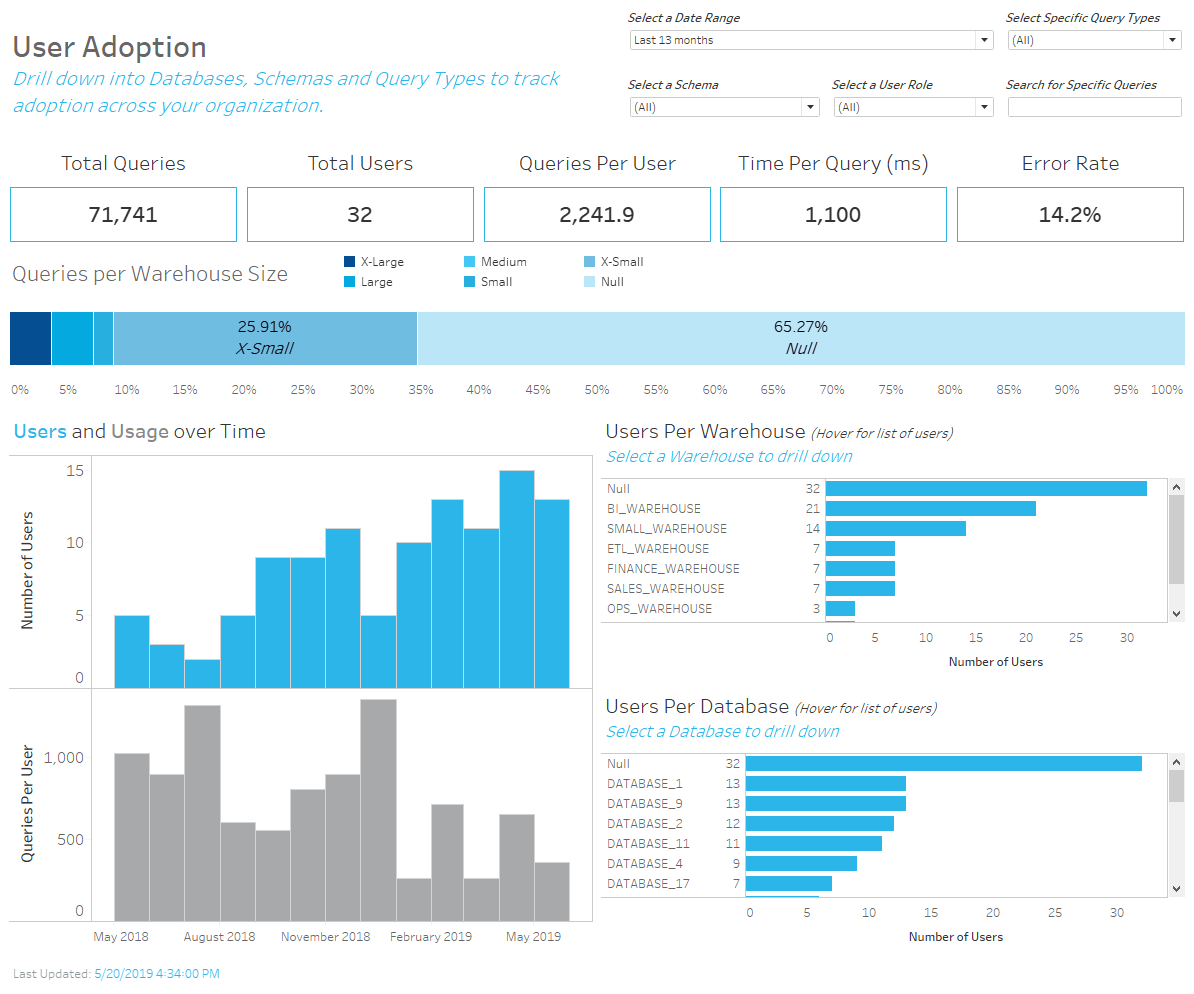
As you move to the cloud, you’ll also need to ensure that workloads and FTE resources are prioritized according to your needs. Use the User Adoption dashboard to track adoption of your new cloud platform and see where time is being allocated. Drilling down to teams or databases, you can not only check migration progress, but you can even see how your data is being used across the organization. This provides actionable insight on where data literacy training opportunities may still exist and can help your team to more fully realize the value of your data investments.

Getting Started: How to set up Snowflake Cloud Monitoring Dashboards in Tableau
Included below are instructions on how to set up your Cloud Monitoring dashboards using our downloadable workbook.
Part One: Enable access in Snowflake
By default, only account administrators (users with the ACCOUNTADMIN role) can access this data. However, privileges can be granted to other roles in your account to allow other users access. If you are not an account administrator, you will need to be granted access.
Part Two: Open Tableau’s Account Usage dashboards
Download and open the Snowflake Account Usage Tableau workbook. You will need Tableau Desktop (version 2018.3 or greater) to open this file. If you have not downloaded Tableau Desktop before, you can start a trial here.
Part Three: Direct the workbook to your Snowflake Data Warehouse
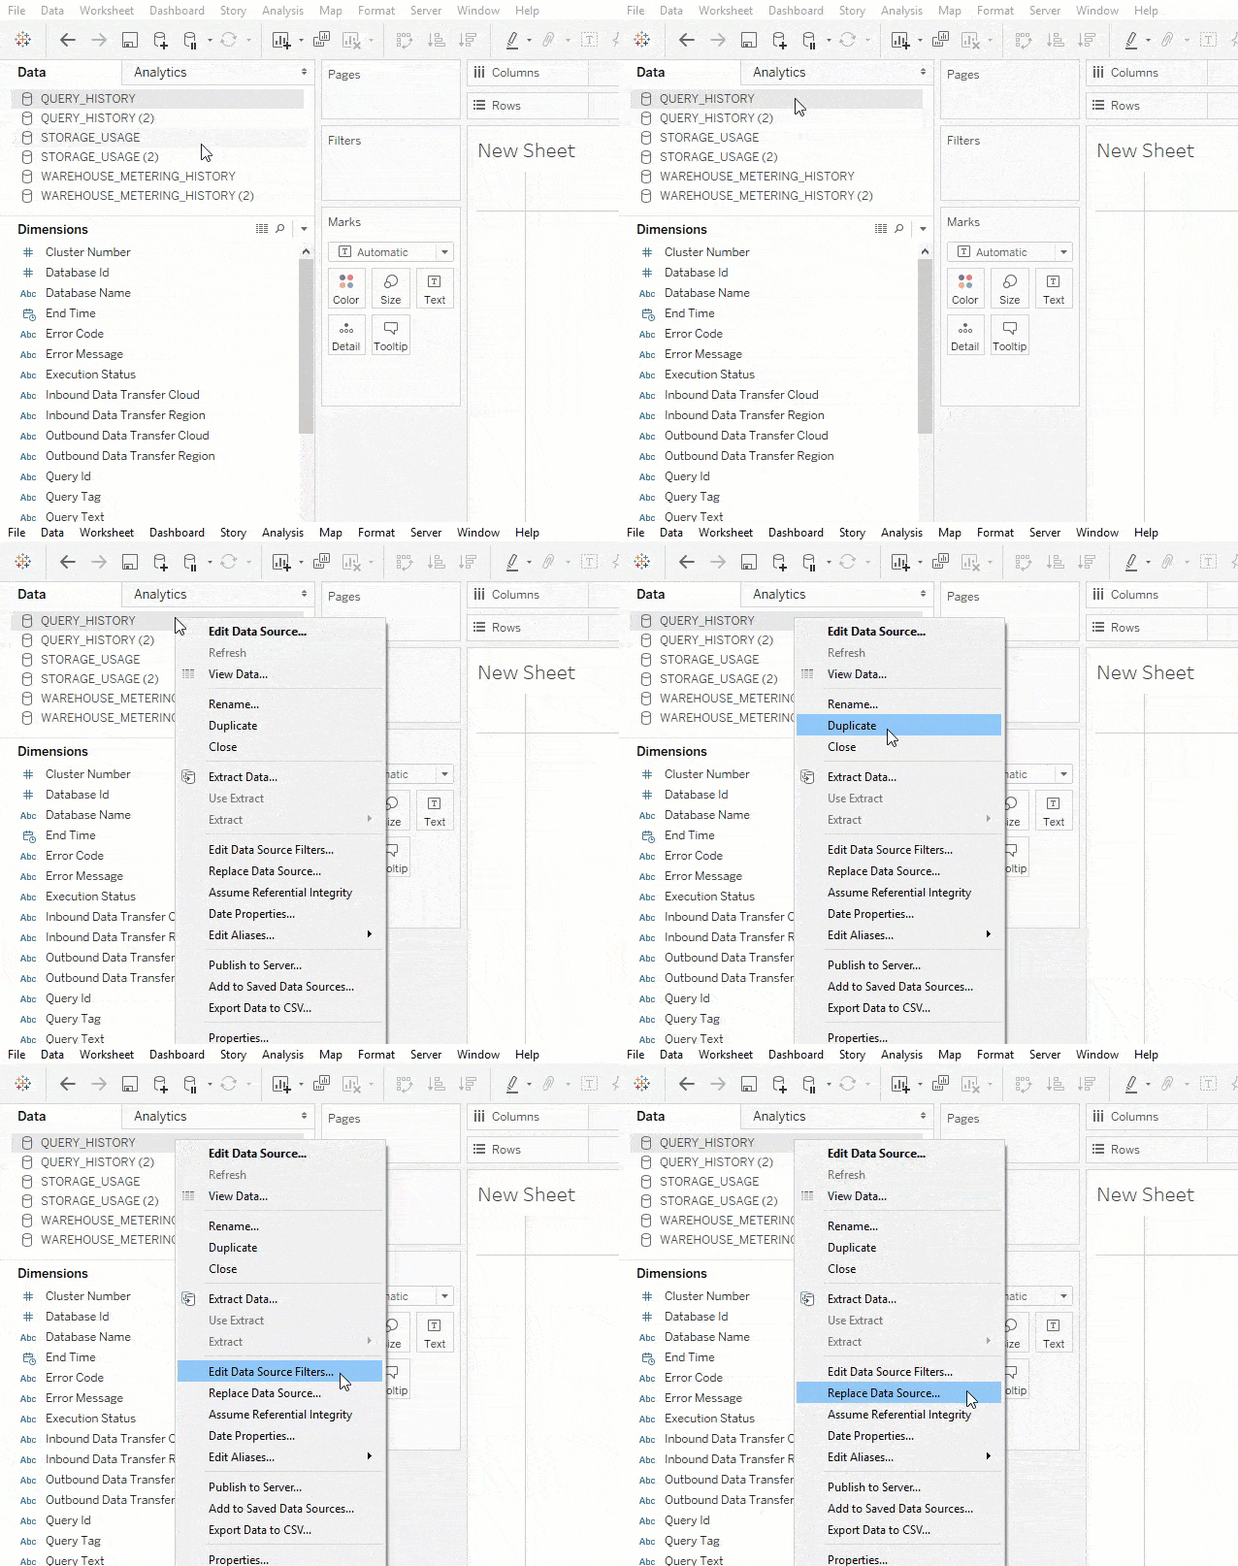
- Upon opening the workbook you will be prompted to Edit the Data Source Connection. Ignore that prompt and instead create a new Sheet.
- Once on a new Sheet, establish three data source connections to your Snowflake instance. One data source for each of the tables identified below. If you have never connected to Snowflake from Tableau before, you can learn how here. (Please note: a driver is required.)
Database: SNOWFLAKE Schema: ACCOUNT_USAGE Table: QUERY_HISTORY
Database: SNOWFLAKE Schema: ACCOUNT_USAGE Table: WAREHOUSE_METERING_HISTORY
Database: SNOWFLAKE Schema: ACCOUNT_USAGE Table: STORAGE_USAGEPlease note: As of May 2019 these tables do not contain any cost information pertaining to Materialized Views, Automatic Clustering, or Snowpipe. That information is contained in separate tables.
- It’s important to note that these dashboards are designed to give you complete insight into your Snowflake account usage history. The Account Usage tables contain up to 12 months of your account usage, and depending on the extent of your adoption, may contain a large amount of data. Please keep in mind that dashboard performance is proportional to the extent of your adoption. If you'd like to focus analysis on a specific period of time consider using a data source filter or extracting the data after connecting successfully.
- Once you have connected to all three tables, replace those data sources with the respective tables in the workbook.

- This will need to be done for all three data sources.
- Right click and “Close” each of the old data sources.
That’s it! Your dashboards are now ready to be explored. If you’d like to share with your team, publish these data sources and publish the dashboards to Tableau Cloud or Tableau Server so that you can collaborate with any other data stakeholders.
Check out a completed example (using anonymized data) of the Snowflake Account Usage workbook on Tableau Public.
Get more value from Tableau and Snowflake
And of course, there’s no need to stop there. While we’ve provided a number of ways to see and understand your data, you can use Tableau’s industry-leading drag-and-drop experience to customize your own dashboards. Let your curiosity and creativity drive you to the story that best brings your data to life.
Interested in sharing your unique ideas? Check out our Community Forum Discussion to collaborate on ideas and connect with the Tableau and Snowflake community.
No matter where you are on your data journey, Tableau and Snowflake are committed to guiding you along the way. With data to light your path, you can act confidently, knowing that all your cloud decisions are informed decisions.
Acknowledgments
Special thanks to Shobha Joshi (Snowflake), Kelly Hotta (Snowflake), and Madeleine Corneli (Tableau) for their collaboration in the development of these materials.