Generation Data: Join the competition with students worldwide
Editor’s Note: At Tableau, data skills are essential for the next generation of workers and business leaders. Tableau’s Academic Program arms students with the valuable analytical skills to help them discover insights and make data-driven decisions in everything they do academically and professionally. Our Generation Data blog series highlights students and recent graduates who use Tableau.
Whether it’s Iron Viz, Workout Wednesday, or #MakeoverMonday, viz competitions have always been fierce in the Tableau community. The Tableau Academic Team is hosting a Student Viz Assignment Contest, but before you enter, we’d like to celebrate some student winners from other recent competitions.
A national VizArt challenge
CIBC, Deloitte, and Tableau hosted the inaugural Data VizArt Student Challenge, a nationwide competition for data visualization, storytelling, and analytics open to students across Canada. Teams of two to three students were given a few weeks to submit a viz via Tableau Public to qualify for the final round of the competition. With ten data sets to choose from, their challenge was to propose a solution to the question: How well is Canada positioned as a leading global business hub?
The top ten teams flew to Toronto, Canada to present their final viz in person to a panel of three judges. I had the opportunity to a judge for the competition and can say without a doubt that I was impressed by every single one of the final presentations!

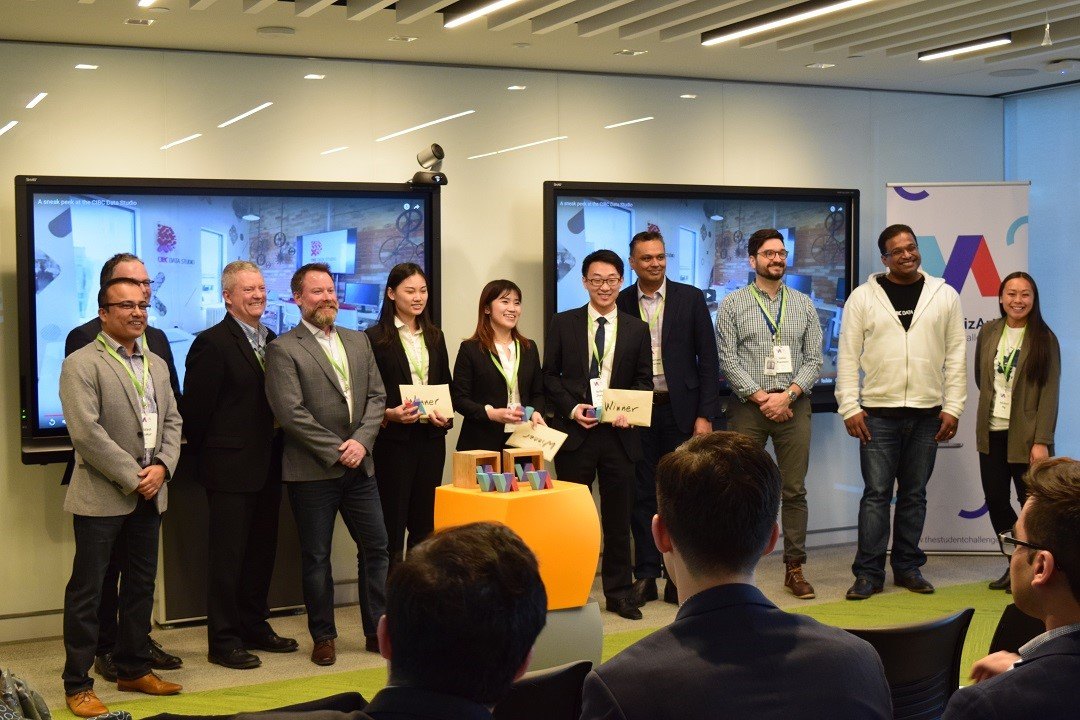
Winning team of the Data VizArt Challenge with judges and industry partner leaders
Ruibo Zhang, Ning Wu (Doris), and Zhuoran Jiang from the University of Toronto took home first place and a $3000 CAD cash prize. Check out their winning viz here.
The classroom viz competition
It’s no secret that data analytics is a skill in high demand for new graduates. Zen Master, Yvan Fornes is making sure his MBA students at the EDHEC in Nice, France are prepared for the workforce with Tableau skills in his classroom viz competition. The students were learning data visualization best practices—while also competing for Tableau swag.

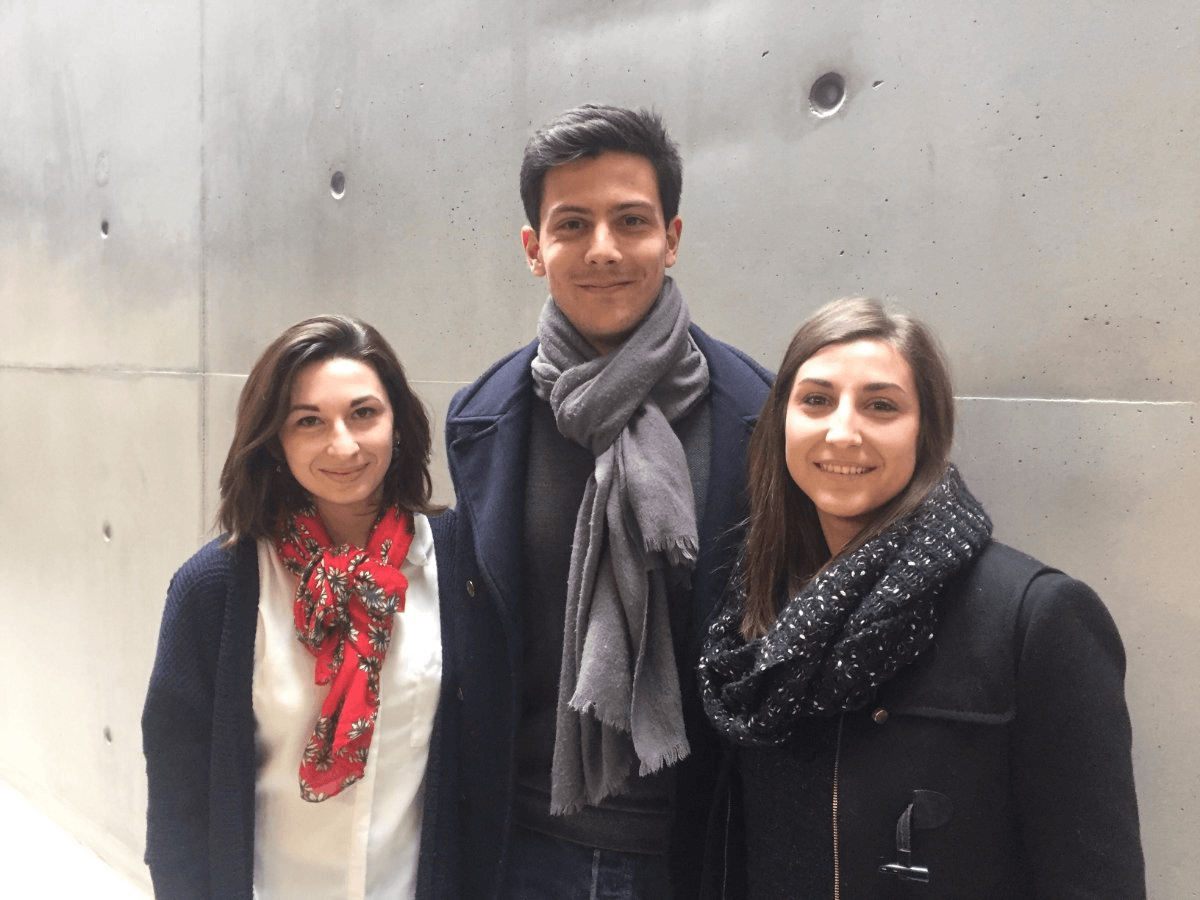
From left to right: 3rd Place - Camille Bedard, 1st Place - Martin Parenti, 2nd Place - Elisa Gach-Camera
You can explore the top three winning vizzes on their Tableau Public profiles linked above.
Data storytelling day with Tableau
Meanwhile in Brisbane, 80 students attended the Data Storytelling Day at Queensland University of Technology (QUT). The day started with a two-hour Tableau workshop on the basics of data visualization, taught in collaboration with KJ Kim, Senior Academic Programs Strategist from Tableau, and Frederic Fery, IT and Digital Services Manager at QUT. Students were then broken into groups of four and given one hour to create a visualization based on Shark Control Program data. The judging criteria included storytelling, analysis techniques, and design aesthetics.

Photo of the Brisbane Competition Winners, Team “These Stats Ain’t Loyal”
The winning team, comprised of Elliott Flowers, Brodie Wilson, John Beckinsale, and Haron Jamil, called themselves “These Stats Ain’t Loyal” and used the shark data set with a sense of humor. Students said they went from “not really understanding how to use Tableau” to feeling “relatively comfortable with it”—all in the span of one day!
Student Viz Assignment Contest–open now!
With all this talk of competition, we want to share the Student Viz Assignment Contest hosted by the Tableau Academic Team. Share a viz you’ve published to Tableau Public. Enter by May 29th and you’ll have a chance to win tons of Tableau swag!
Are you a student who’s not using Tableau? Start your own data journey with a free student license.
Histórias relacionadas
Subscribe to our blog
Receba em sua caixa de entrada as atualizações mais recentes do Tableau.


