
Is your analytics strategy generating value?
Three models for calculating BI value
There are different methods you can use to assess the value you derive from your software choice.
Today’s data driven world demands that people and organizations are conversant in data to drive decisions and create value—but it may seem hard to differentiate between products.
39%
lower cost with Tableau when evaluating license, platform, and labor costs
40%
higher value generated from improved efficiencies when using analytics
Yesterday's BI is focused on cost
BI platforms are built around providing standardized, operational reporting, with an emphasis on distributing data in a repeatable way. Many modern BI tools still adhere to this model. Visual dashboards improve end-user ability to understand information, and chart-building software reduces the time required for BI consultants to create dashboards - but they fall short of enabling users to adopt analytics as part of their decision-making process.
Today, analytics is focused on value
If you’re looking to create value with your data strategy, you should embrace modern analytics. New revenue streams, cost savings, and efficiencies contribute value to an organization rather than a recurring expenditure. The value for companies who build their culture around insights generated from real, verifiable facts dwarfs the cost savings gained by organizations who deliver report and dashboard-based solutions.
Understanding the value of business intelligence needs to be assessed not just in terms of the cost and functional benefits of the software, but also in terms of the business benefits that are enabled by data-driven decision-making.
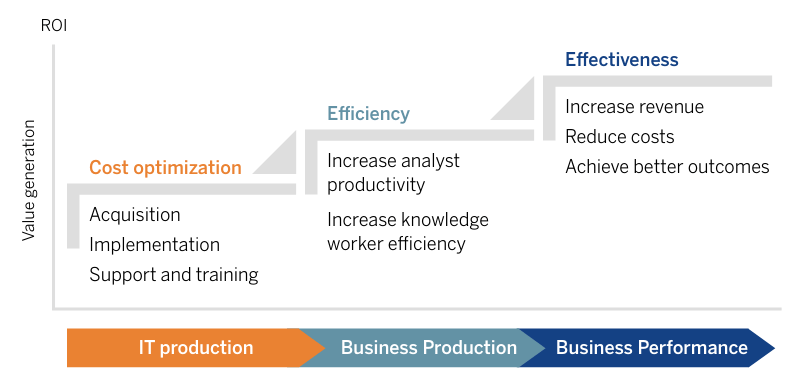
Tableau Business Value Hierarchy
Depending on where your organization is on its journey to becoming data-driven, you might choose to focus on cost optimization, efficiency, or effectiveness.
Level 1: Cost Optimization - Total Cost of Ownership (TCO) Model
Calculate the total cost of owning a BI solution and choose the lowest-cost option.
Level 2: Efficiency - Worker Productivity Model
Compare gains in worker productivity achieved with different solutions, and use the cost of labor to compute a return on your investment.
Level 3: Effectiveness - Expected Impact Model
Quantify the value gained from improved decision-making across your organization, as produced by a more informed workforce.
01: Total Cost of Ownership Model
Calculate the total cost of owning a BI solution and choose the lowest cost option.
Often customers evaluate license costs, but do not consider support, training and add-on technologies that add to their total cost. This model assumes that the gross value you’ll receive from the many BI technologies available to you will be about the same, meaning that the most important thing is to choose the option that will cost you the least amount of money. This isn’t always true, but it works in some situations.
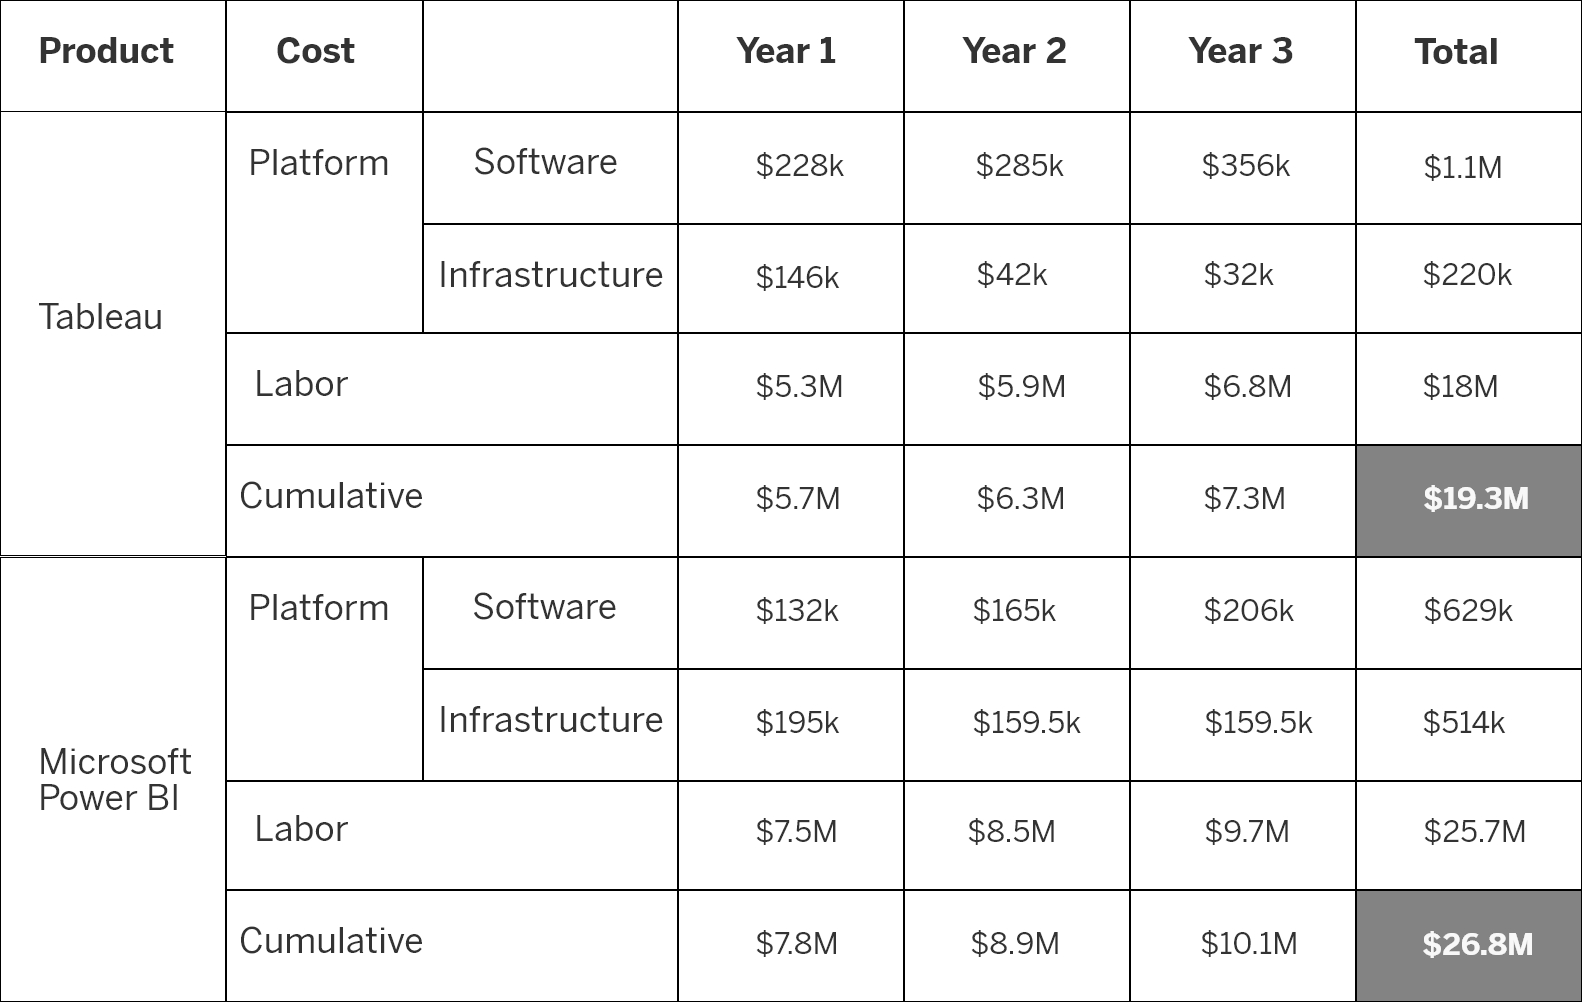
There are several factors that should be included in Total Cost of Ownership, not just license cost. These include platform and labor costs:
PLATFORM COSTS
Infrastructure: Hardware, infrastructure as a service, data (commute/storage), system services
Software: Licensing, partner integrations, data connectors/storage fees, API access, usage fees
LABOR COSTS
Installation
Setup
Report Creation: IT staff to build and curate content
Support: Technical support and continued maintenance
Training: User enablement, training the trainer, coursework
When to use the TCO Model
-
If you have analytics that are run by consultants or other for-hire technologists.
-
In use-cases focused around dashboard distribution with little need for ad hoc analytics.
-
With embedded visualizations where static content will be distributed and look-and-feel is more important than interactivity.
Recommended reading
How to Choose the Right Modern BI & Analytics Platform - a guide to help you define the supporting requirements for a modern analytics workflow.
Calculating TCO
Example
02: The Worker Productivity Model
Compare gains in worker productivity achieved with different solutions and use the cost of labor to compute a return on your investment.
Data analysis technology helps workers understand information more quickly. The Worker Productivity Model calculates the benefit to your workforce by computing the total amount of time you will save versus other technologies.
This model assumes that if your employees spend less time doing analysis, they can either have bandwidth to do more analysis, or can do other tasks that add value to your business.
When to use the Worker Productivity Model
-
You don’t have a specific analytics project in mind, but are distributing analysis capabilities to all of your knowledge workers.
-
You are attempting to calculate the value of building a data-driven culture.
-
You want to quantify the ROI of Communities of Practice or Centers of Excellence around data.
Metrics to define when calculating Worker Productivity
Creation Differential: The difference in effort to create analytical output in different platforms relative to the current approach.
Consumption Differential: The difference in end-user experience to get information from different platforms relative to the current approach.
Value Factor: Average expectation of the value added by a knowledge worker in your organization. This optional approach provides a shorthand way to reflect an effectiveness component into the Efficiency Model.
Example (The intent of this model is to maximize value; therefore, higher numbers are better)
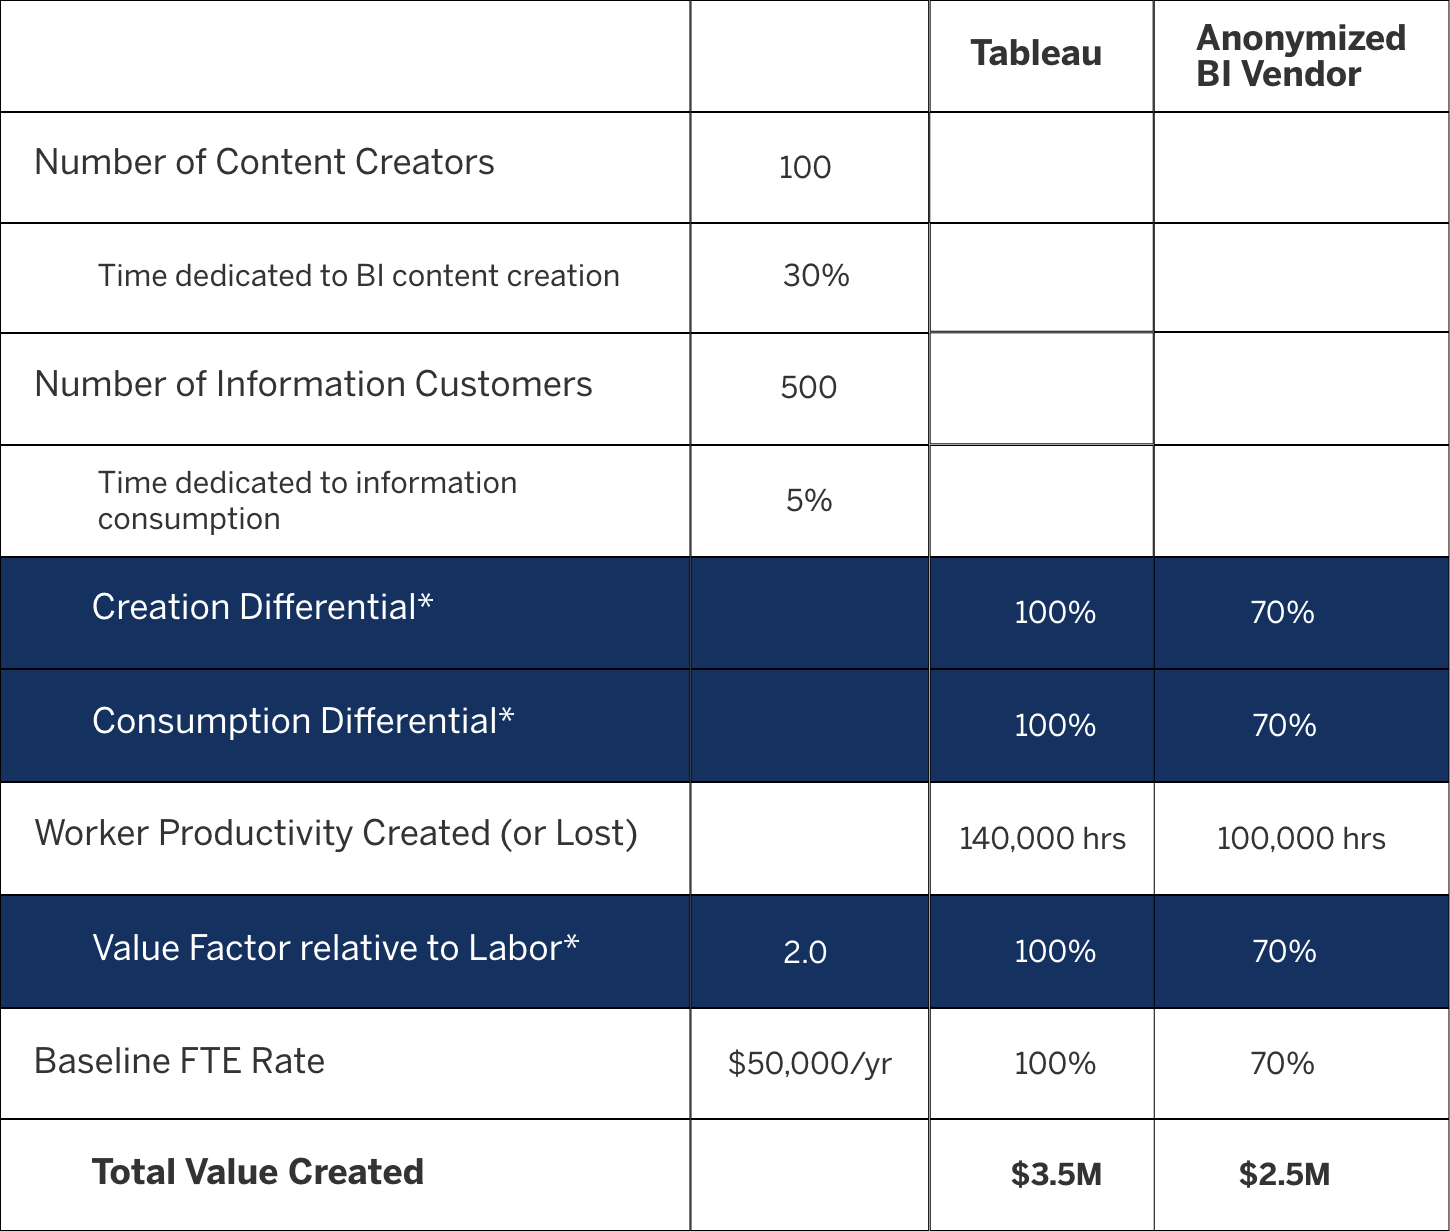
*These are the three inputs / levers that will affect the results from this model. Consider the true users of your BI system (rather than having IT buyers perform the entire evaluation). Including those who will perform these tasks will give you a sense of the associated costs and how each action will scale in addition to resulting in more precise estimates.
03: The Expected Impact Model
Quantify the value gained from improved decision-making with a more informed workforce.
The Expected Impact Model asks, “If a worker is X% more likely to make a good decision with this technology, what is the value of that?” This model is the hardest to quantify because it requires aligning the technology you are evaluating to real business outcomes. However, it is the truest to real-life. It can also show increased creation and consumption of business intelligence not reflected in the previous sections. The efficiency of freed labor can be applied to generating additional and impactful business insights through analytics.
When to use the Expected Impact Model
-
You have certain decisions that you want to improve among your workforce.
-
You are creating analytics for a specific set of users or problem area.
-
You want scalable, repeatable and reusable analytics that add value over and over.
Calculating Expected Impact
Scenario: The business benefit recognized by becoming more informed is defined by the outcomes you are trying to achieve. This includes an estimated value of a good outcome.
Scope of Decision: What decisions influence your defined outcomes? Lines of business understand which decisions impact the outcomes they are trying to achieve.
Improvement: How much will access to data help knowledge workers make better decisions, and how do you compare the extent to which different technologies will impact decision-making? This value can be quantified in an improvement rate that shows how much more value improved decisions will add to your scenario.
Example
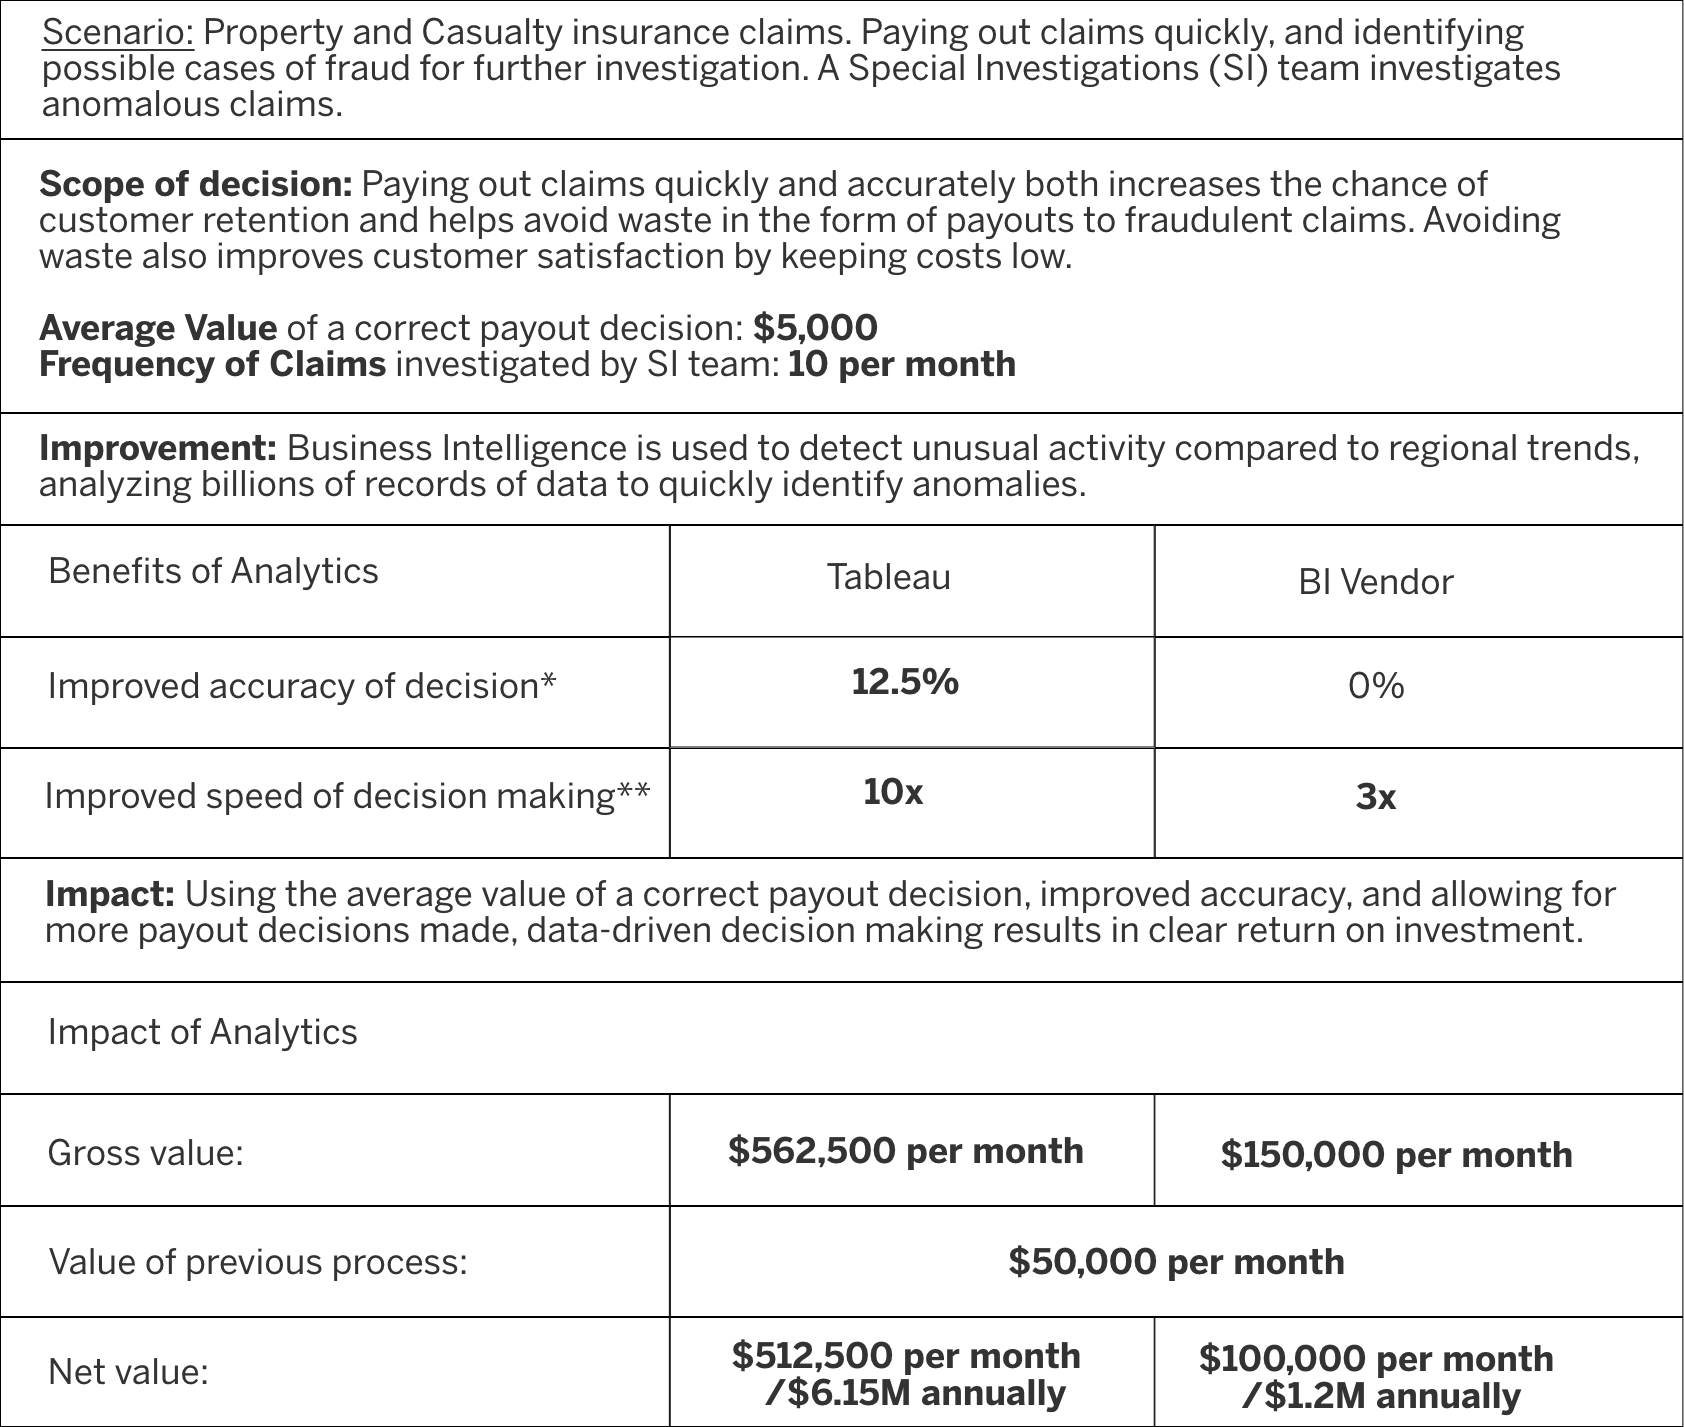
*Can’t see all data points in a single view with BI Vendor, so no improved accuracy.
**BI Dashboards improved decision-making speed, but not as much as visual analytics process.


