Meet Tableau 10.3
Tableau 10.3 helps you analyze data from more sources with a slew of connectors and smart data prep capabilities. Connect to your AWS S3 data with the new Amazon Athena connector, and turn data stored in PDF tables into measures and dimensions with our new PDF connector. Plus, finding the right data for your analysis just got easier with table and join recommendations powered by machine learning.
We’ve also developed features that help you stay on top of your changing business, wherever you are. Data-driven alerts keep your finger on the pulse of your analytics, and web authoring improvements, like editing stories directly in the browser and continuous axis drill up, keep everyone asking and answering questions of their data.
Let’s take a look at some of the features we are most excited about.
Data-driven alerts for Tableau Server
Stay on top of your business with data-driven alerts for Tableau Server. Just choose a threshold to receive an email alert for yourself or your whole team. These notifications help you keep an eye on benchmarks. Select a numeric axis, hit Alert, and you’re ready to go. Try it for tracking sales goals, engagement rates, and more.
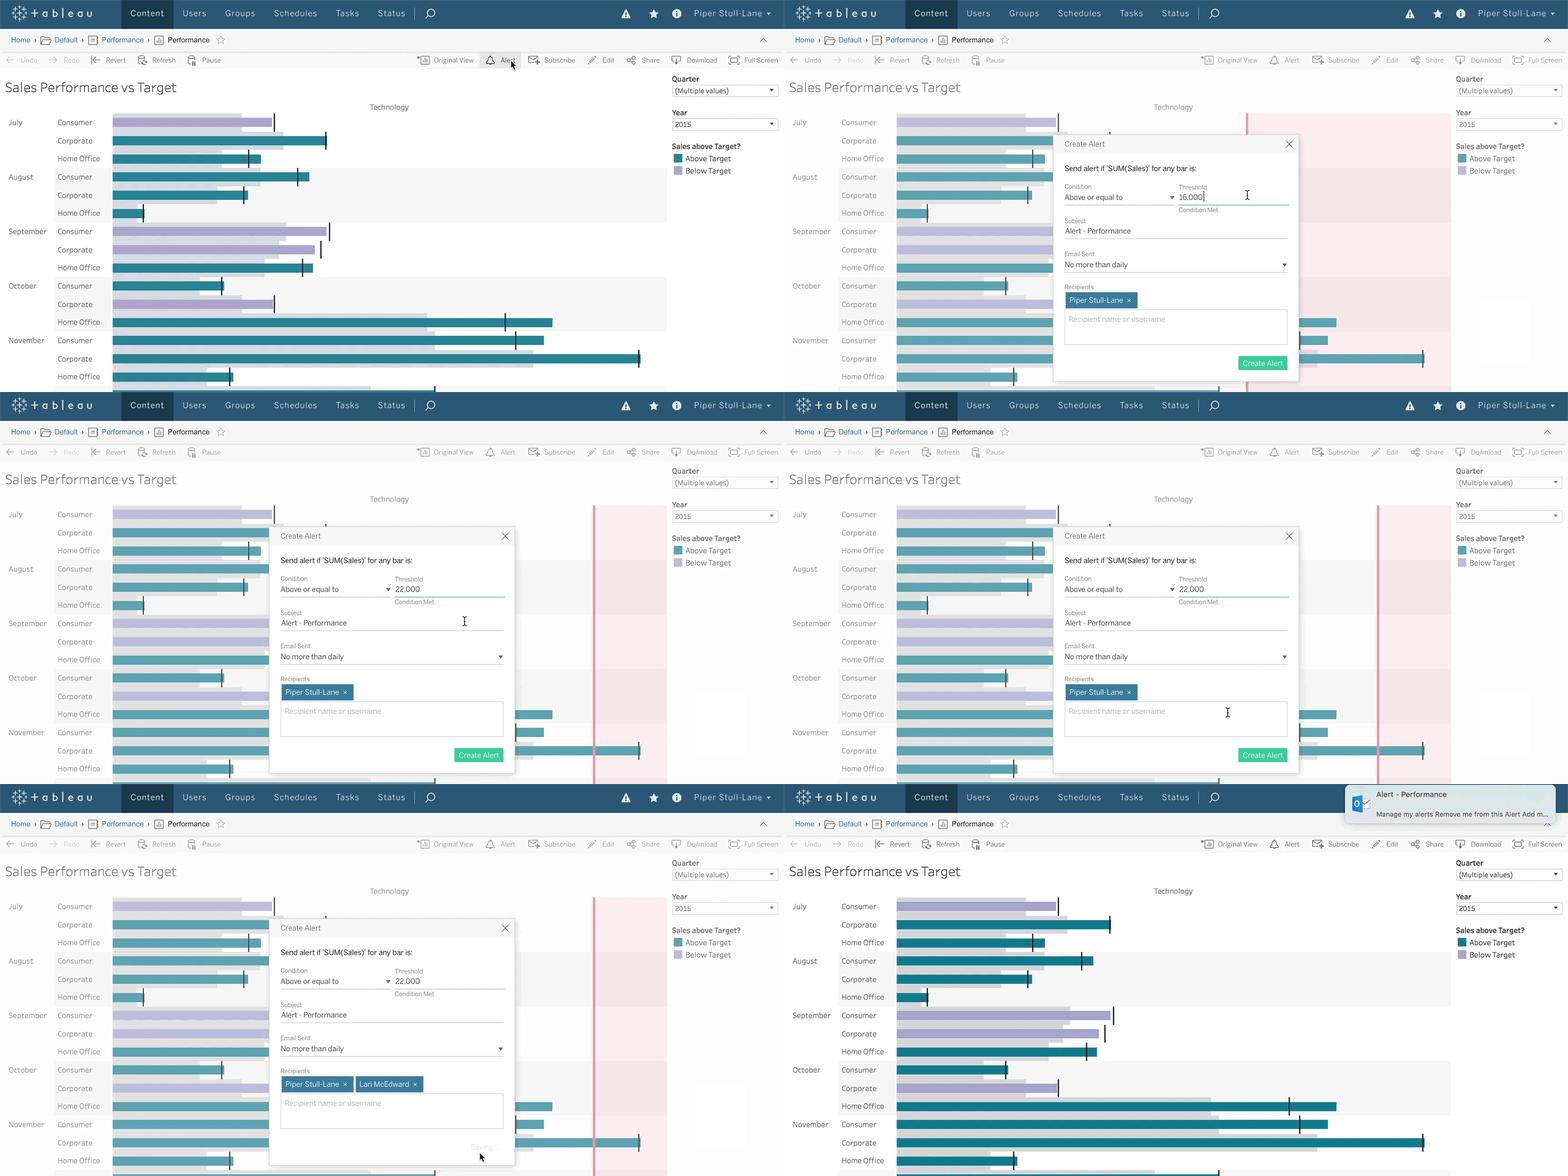
We set a threshold of $22,000 to receive sales alerts from Tableau Server. To learn how to use this feature with your own data, read Data-Driven Alerts in the Online Help.
Connectors for Amazon Athena, PDF, Dropbox, and more
New connectors get you to actionable data faster. Access PDF data directly in Tableau Desktop, and watch your tables automatically become analysis-ready. Plus, try out connectors for Amazon Athena, ServiceNow ITSM, Dropbox, Microsoft OneDrive, and MongoDB BI.
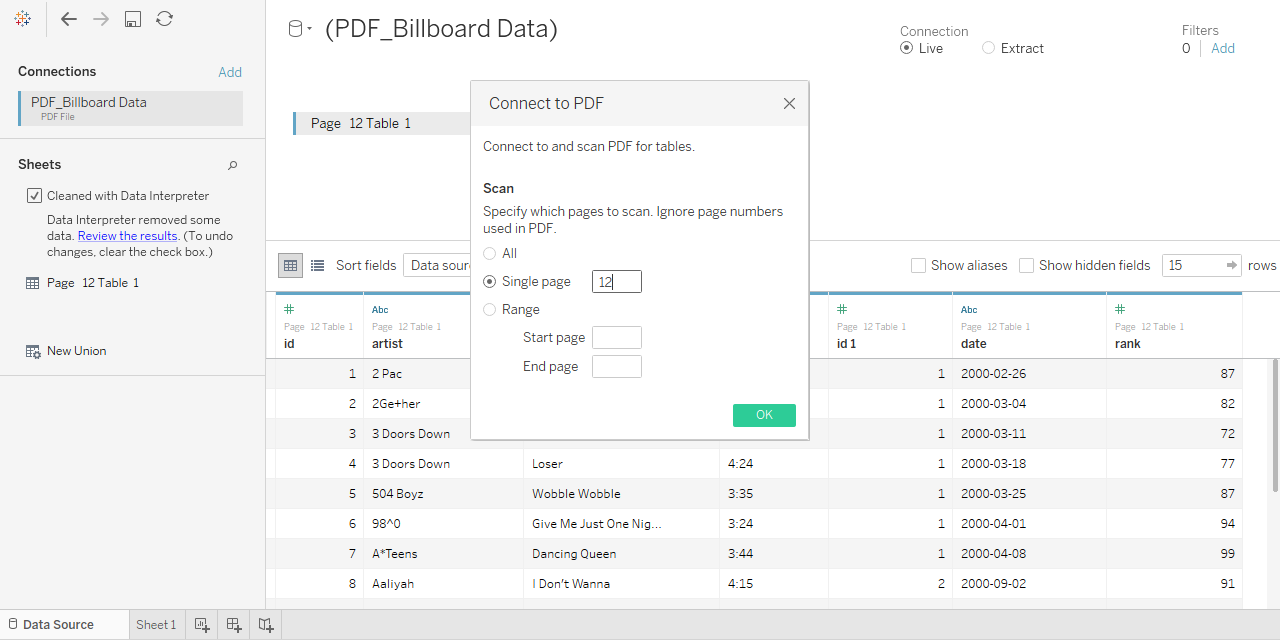
Here, we’re extracting data from page 12 of a PDF. To learn more about this connector, read PDF File in the Online Help.
Data prep recommendations built on machine learning
Imagine leveraging the collective smarts of your entire organization to find the right data set for your analysis. Tableau 10.3 takes advantage of machine learning to recommend relevant tables and joins, based on aggregate data source use across your Tableau deployment. With recommendations, you can be confident you are using the right data to drive your analysis.
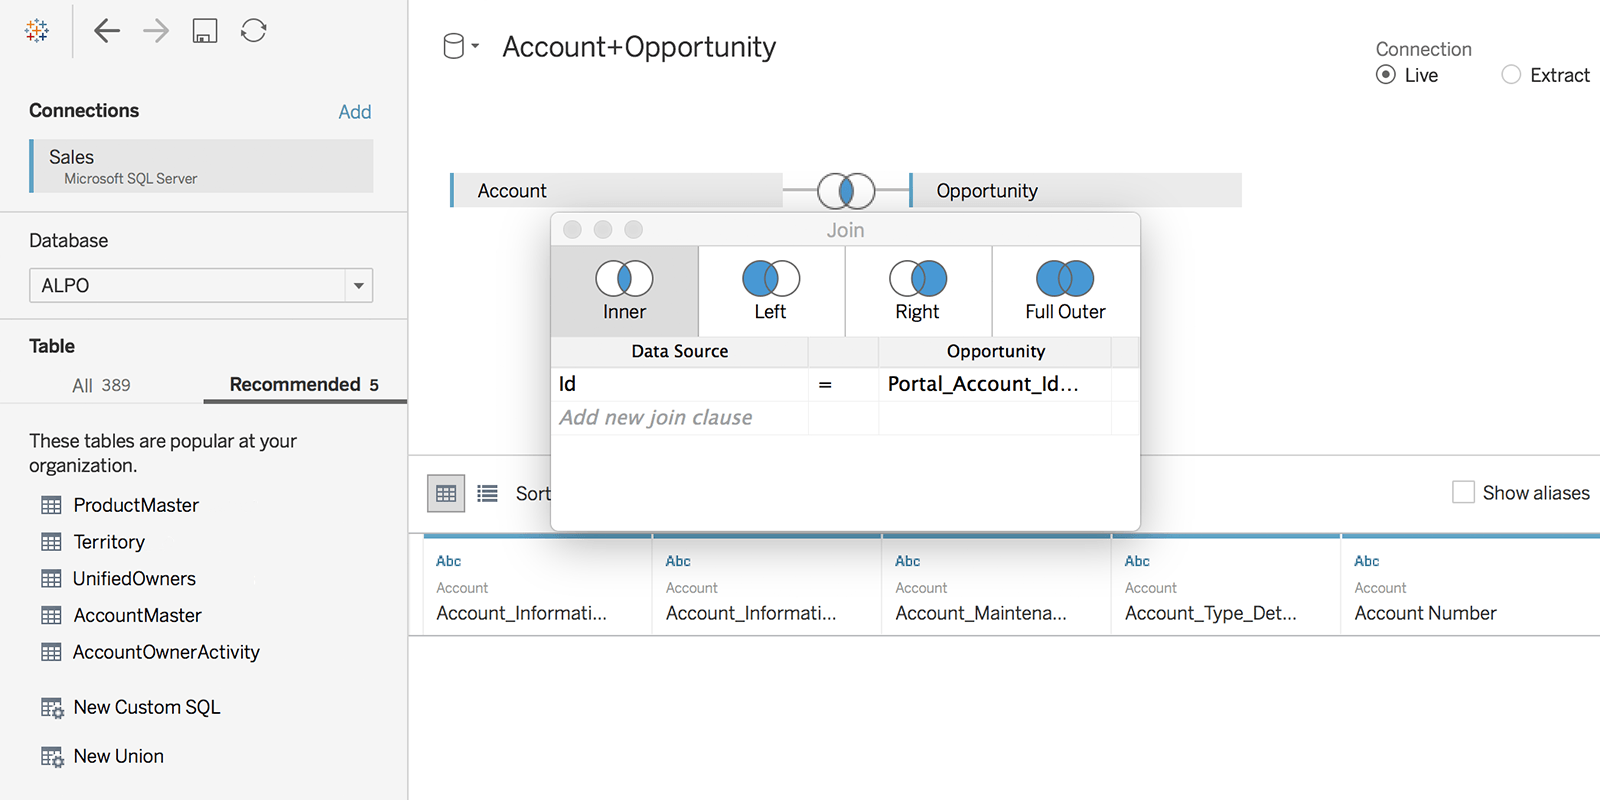
On the Data Source page in Tableau Desktop, discover which tables might assist your analysis—and which fields you’re likely to join. Here, Tableau suggests joining the “Id” and “Hist Datasource Id” fields. To learn more, read Recommended tables and smart joins in the Online Help.
Powerful selection to spot trends
We’ve brought smarter selection to tooltips, so you can discover the stories in your data. Clicking on categories in your tooltips easily identifies associated marks in the view, so you can see how everything is connected.

Selecting “above median” in the tooltip highlights all associated marks in the view. To learn more about this feature, read about Tooltips in the Online Help.
We’ve also added a latest date preset, so you can set filters to display the most up-to-date values automatically, as soon as your workbook opens.
Improved web authoring and API updates
We’re committed to helping you better scale and manage Tableau across your organization. In 10.3, you can create and edit stories online, and control mapping display options. We've also added more number formatting controls, and have brought continuous axis drill up to the browser.
The REST API has also seen improvements across the board, starting with support for tagging data sources and views. Plus, query for a list of all sites you have access to, and discover how easy site-switching was meant to be. On the JavaScript side, we’ve added custom Undo/Redo functionality to our API, so that the power of customization is in your hands.
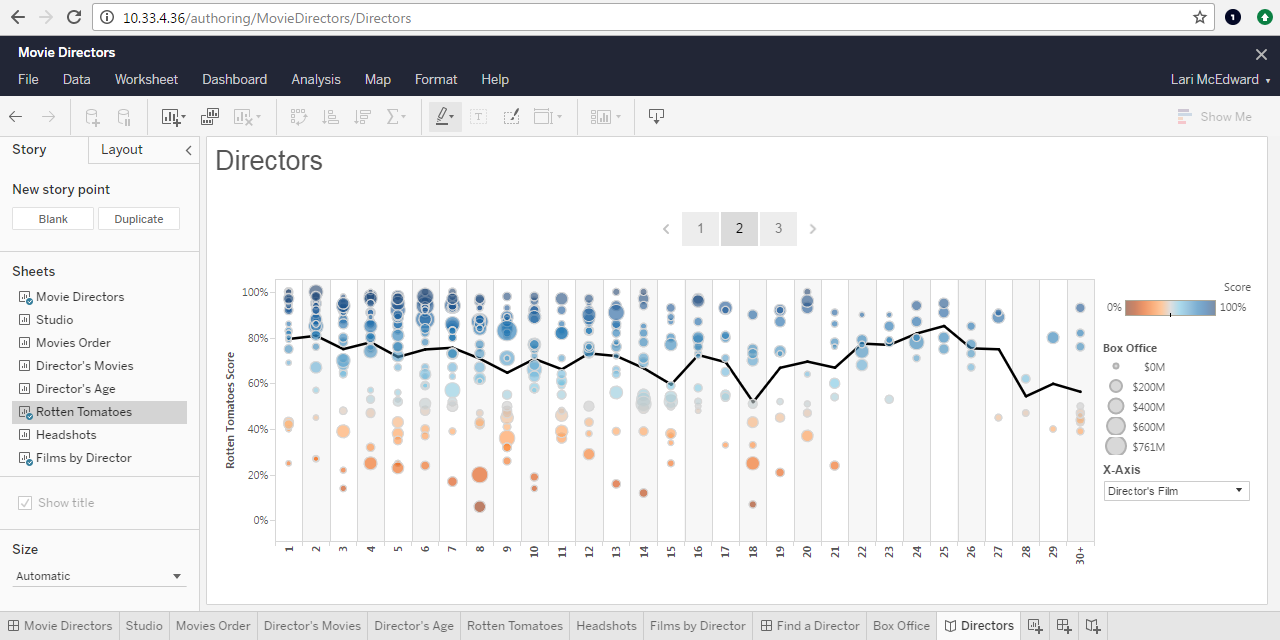
Creating a story in the browser.
You're the best, Tableau Community!
With every release, we include features you’ve been asking for, and 10.3 is no exception. Check out the Ideas Forum in the community to see which ones have been incorporated based on your feedback. And be sure to continue adding ideas to inspire our development team—we couldn’t do it without you!
We’d like to extend a huge thank you to the 16,000 beta testers who tried the Tableau 10.3 beta. Your time and energy has made this release one of our best yet. If you’d like to be involved in future beta programs, sign up today.
Learn more about 10.3
Our dev team dove into some of 10.3’s biggest features:
Verwante verhalen
Subscribe to our blog
Ontvang de nieuwste updates van Tableau in je inbox.


