The Do's and Don'ts of Dashboards

You've got data and you've got insights — now you're ready to share your findings with the world

You’re ready to create a dashboard

Download this free ebook

You’ve got data and you’ve got insights—now you’re ready to share your findings with the world. You’re ready to create a dashboard.

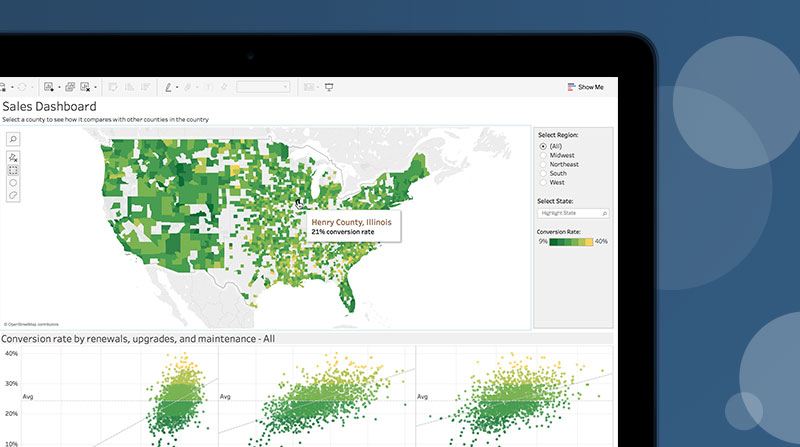
A dashboard is your go-to tool for communicating insights about a particular set of data. But, to build a great dashboard—a truly informative and actionable dashboard—it takes more than just putting all of your “aha moments” onto a canvas. There are planning and design elements that must be deliberately accounted for in order to give a dashboard the most bang for your buck.

Read more to learn where to start, what to include, and what to avoid.

Get the whitepaper

Het dashboard van Tableau is voor hen de tool bij uitstek geworden om te monitoren hoe goed ze dat project en het initiatief voor het opschonen van data aan het uitvoeren zijn. Daarnaast is het ook een tool om in de toekomst te monitoren hoe ze het doen vanuit het oogpunt van datakwaliteit. Op dat gebied dus eigenlijk essentieel.

Additional Resources

Getting Started with Dashboards and Stories in Tableau

Get to know the basic concepts about Tableau’s dashboards and stories in this free training video. You’ll build skills for creating better layouts, using device designer effectively, implementing interactive actions, and shaping story points.

10 Best Practices for Building Effective Dashboards

A well-designed dashboard is a launch point for your analytics. Armed with the same powerful collection of information, your business makes faster decisions based on a single source of truth.

Over Tableau

Tableau helpt mensen data om te zetten in praktische inzichten. Verken de data aan de hand van onbeperkte visuele analyses. Bouw dashboards en voer ad-hocanalyses uit met enkele muisklikken. Deel je werk met iedereen en zet iets neer binnen je bedrijf. Van internationale ondernemingen en beginnende start-ups tot het MKB: overal wordt Tableau gebruikt om data te kunnen zien en begrijpen.


Uitgelicht in

Fortune
Fast Company
Wallstreet Journal
Wired

Bijna klaar!

Het invullen duurt slechts 15 seconden. Als je al geregistreerd bent, kun je je nu aanmelden .
Adres