Using Tableau Prep’s new Python integration to predict Titanic survivors

In a recent release of Tableau Prep Builder (2019.3), you can now run R and Python scripts from within data prep flows. This article will show how to use this capability to solve a classic machine learning problem.
Kaggle.com, a site focused on data science competitions and practical problem solving, provides a tutorial based on Titanic passenger survival analysis:
The sinking of the RMS Titanic is one of the most infamous shipwrecks in history. On April 15, 1912, during her maiden voyage, the Titanic sank after colliding with an iceberg, killing 1502 out of 2224 passengers and crew. This sensational tragedy shocked the international community and led to better safety regulations for ships.
One of the reasons that the shipwreck led to such loss of life was that there were not enough lifeboats for the passengers and crew. Although there was some element of luck involved in surviving the sinking, some groups of people were more likely to survive than others, such as women, children, and the upper-class.
In this challenge, we ask you to complete the analysis of what sorts of people were likely to survive. In particular, we ask you to apply the tools of machine learning to predict which passengers survived the tragedy.
I decided to accomplish “data grooming” steps for this workflow in the Preppiest (rather than the most Pythonic) way, wherever possible. The steps followed in this article closely mirror those in the Kaggle Titanic tutorial. This article will focus on Prep and Python, not on data science / machine learning / Python best practices.
The most famous Titanic passengers, Kate and Leo, don’t seem to be on the passenger list. Still, we can use this exercise to figure out if the movie’s end was statistically predictable. We know a few things about them. She’s rich, and a first class passenger, he’s poor and a third class passenger. She’s female, he’s male. They’re both relatively young, but not children. In data science these are called features and part of the process is figuring out which features have the most influence on the outcome.
You can find the finished prep flow file, along with the python files, on github here. Assuming you already have Tableau Prep >= 2019.3.1 installed, follow the instructions on the TabPy github site to set up TabPy.
How does Prep work with Python?
The author of a Tableau Prep flow adds a script step, then configures the settings of that step to point to the TabPy server, open the appropriate .py file, and call the appropriate function within that file.
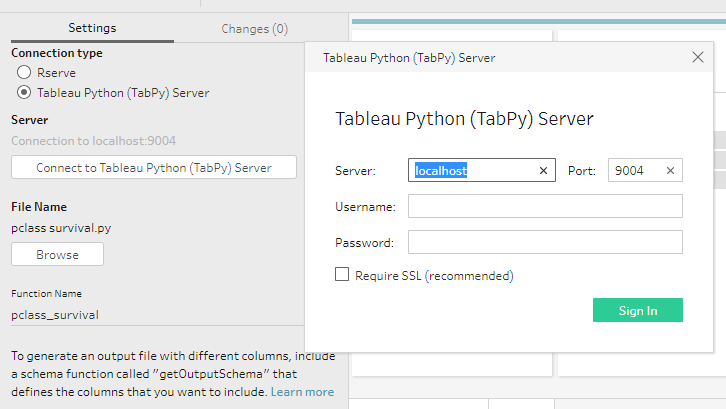
Configuration of a Python script step.
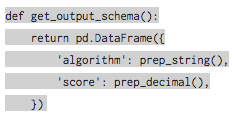
The Python code within that file defines the called function, which receives a pandas dataframe from Tableau Prep (think of it as a simple spreadsheet in your computer’s memory), does something with it, and returns a dataframe. If the returned dataframe is different from the received dataframe, the author must write a second function called get_output_schema. This tells Tableau Prep what column names and datatypes to expect. The available datatypes are:
- prep_string()
- prep_int()
- prep_decimal()
- prep_bool()
- prep_date()
- prep_datetime()
For example, the Python file below receives a dataframe from Tableau Prep and uses the pandas groupby function to show the mean survived score by passenger class. As you can see by the get_output_schema function, this Python file only returns two columns to Prep, an int called Pclass and a decimal called “Survived.” It appears that the classes are reversed, as the richest passengers, the people with the highest survival chances, are in Pclass 3.
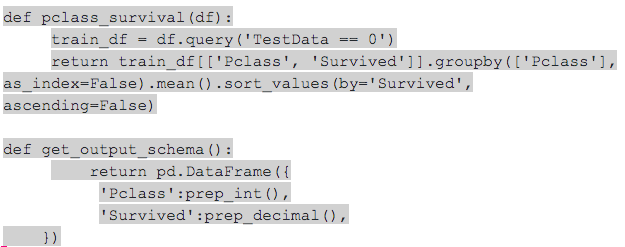
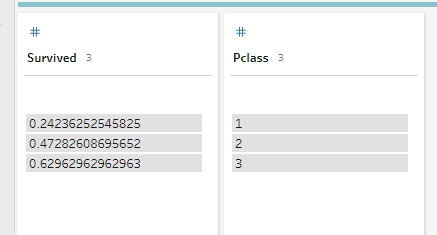
The output of pclass_survival as seen in Tableau Prep Builder
Yeah, that trailing comma in get_output_schema bothers me too. It doesn’t seem to matter.
An essential step to debugging code is being able to print the value of a variable. We can do this here using the console we used to start TabPy. I’ll insert a print statement into the pclass_survival function above, then observe the output in the TabPy console.


Output of a Python print statement in the console
If you have the console visible while you are working on your Prep flow, you may be alarmed to see Prep calling your Python scripts repeatedly. What Prep is actually doing here is calling the get_output_schema function in your Python scripts to find out if anything has changed. Unless you make a change to your .py file, the Tableau Prep flow won’t repeatedly run your main function.
Building the Titanic analysis Prep flow
Kaggle breaks the Titanic passenger list into test-and-train comma separated values (csv) files. The training file includes a populated “Survived” column, whereas the testing file does not. Because Python scripts called by Prep can only consume and return a single dataframe, and we’ll need access to both datasets in our final prediction Python script, we will need to union the test-and-train data as our first step in Prep. To enable Python to tell the difference, we’ll add a “test” flag column.
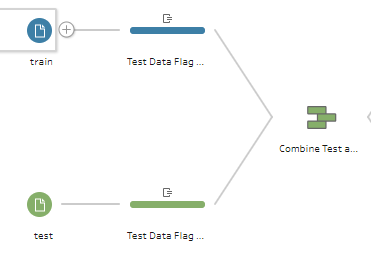
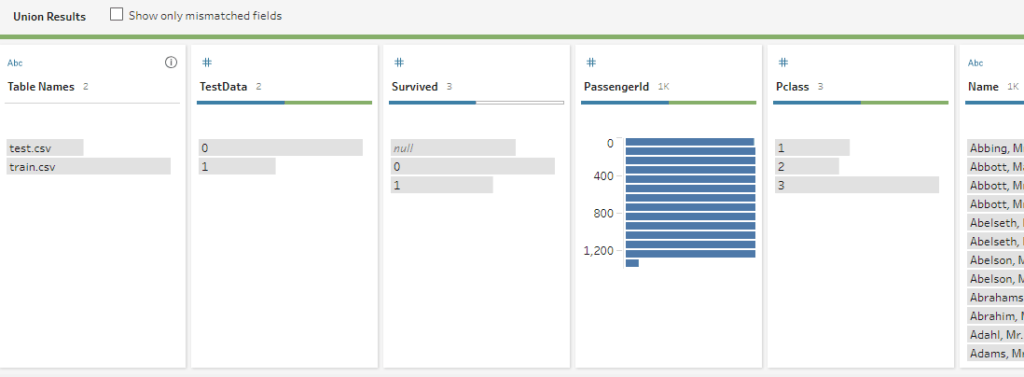
To separate the datasets within each of our Python scripts, we use the pandas “query” function to derive a training pandas dataframe, like this:

We will be using a few machine learning algorithms imported from the https://scikit-learn.org/stable/ library. These algorithms don’t accept continuous values or strings, so we have some work to do to transform this data set.
Age may be an important factor in predicting survival, but we have a problem. There are 86 rows in the training data with no age data. Let’s complete that data by filling those nulls with the average age for passengers, sex, and passenger class. We can do that with a Python script, but we can also do it in two steps with Prep. They’re labeled “average age by sex and pclass” and “clean age” in the finished Prep flow.
We also need to transform several continuous columns into “buckets” or “bins.” I found this to be inconvenient in Python because the binning function used in the tutorial manually takes the bin threshold values and creates bins. This isn’t viable for any sort of long-term automated and maintainable solution.
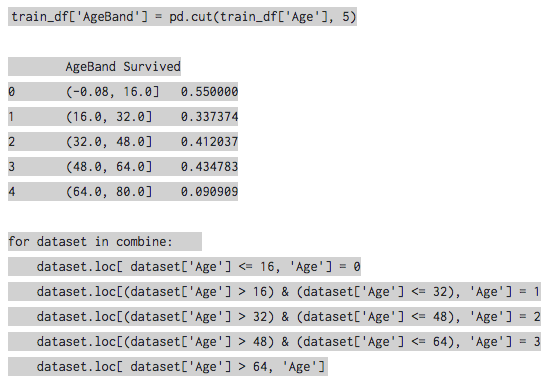
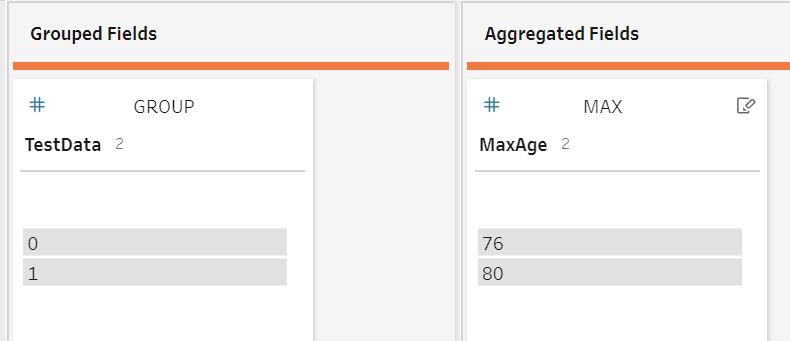
The Tableau Prep way to do this uses two steps. First, an aggregate step adds a max_age column to the flow.
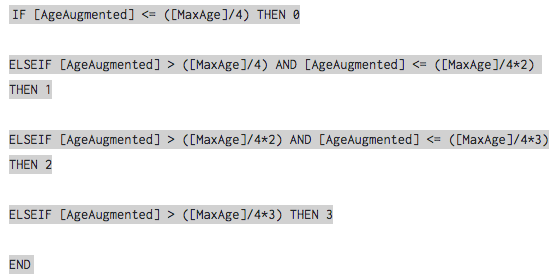
Then, a cleaning step adds the below “AgeBands” calculated field. The “/4”, “/4*2”, “/4*3” operations serve to divide the data into quartiles:

On the chance that the passengers title is statistically significant, we need to group the various titles into five. In Python, this step looks like:
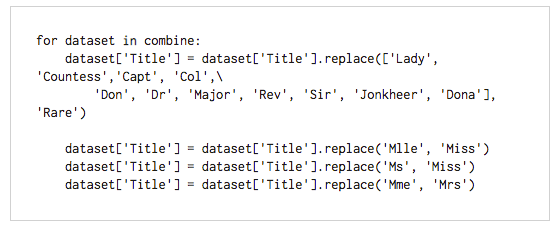
…but in Prep, it’s a simple group and replace within a cleaning step.

The title survival.py script enables analysis of the survival rates by title, again using the Python groupby mean operation.
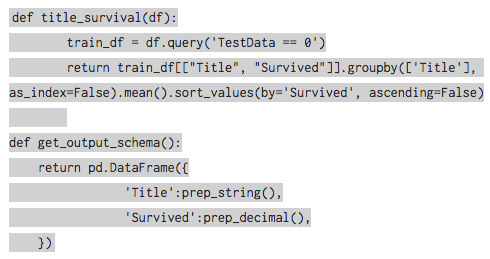
…and the result looks like this in Prep:

Profiling likely survivors
Optimistic news for Kate, but it’s not looking good for Leo. If Captain Smith had married them, both of their chances would have improved.
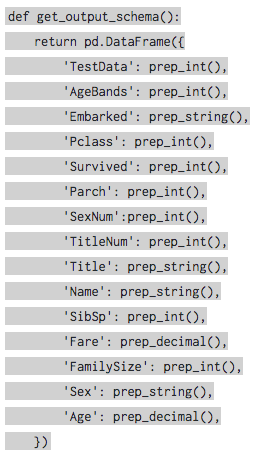
One common step when doing this sort of analysis is “feature engineering”, where you combine aspects of multiple features to improve the accuracy of the prediction. In this case we are going to create a new column called “family size” by combining the “sibling/spouse” (sibsp) and “parent children” (parch) columns. The Python function for this couldn’t be simpler:

This function will add the “FamilySize” column to the dataframe. Since the dataframe we are returning is different, we need to describe the dataframe being returned witha get_output_schema() function. Note the FamilySize column has been added with an int datatype:
Evaluating algorithms
The author of the blog post on which I’m basing this article documents eight different algorithms. We’ll try three here: logistic regression, support vector machines and random forest. In the logistic regression code, we’ll not only run lr, but we’ll output the feature correlation as well:
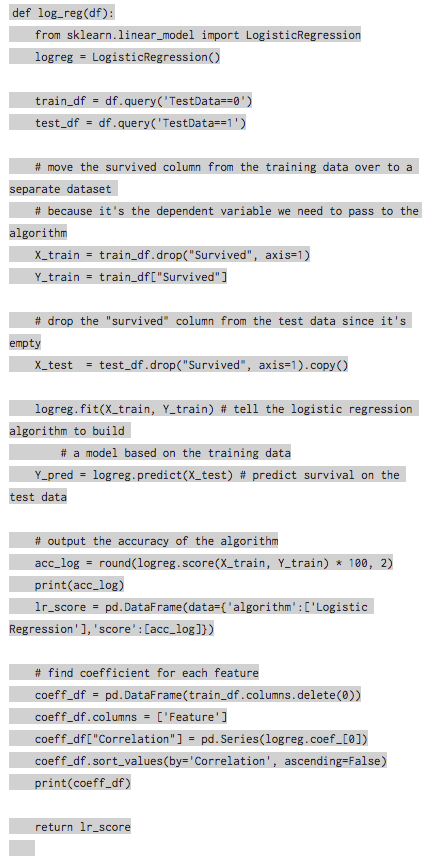
To step through the code above, first we divide the incoming dataframe into test-and-training dataframes, as discussed toward the top of this article. Then we move the dependent variable, “survived,” over to a separate dataframe because that’s what the algorithm needs. We then call the “fit” function, which tells the algorithm to build a prediction model based on the training data. Next, we call the “predict” function, telling the algorithm to predict survival based on the test data.
Acc_log is an accuracy score. We’ll ask for one of those from each of the algorithms.

Accuracy scores for each algorithm
coeff_df is a dataframe we build containing a row for each feature and an estimate of how influential each feature is on the dependent variable— survival. Sex is most important, followed by wealth (fare) and title.

Correlation of features to survival
Predicting Survival
Based on the evaluations of these few algorithms, it makes sense to use random forest. In real life a data scientist might evaluate more algorithms and combinations of algorithms to find the most accurate prediction.
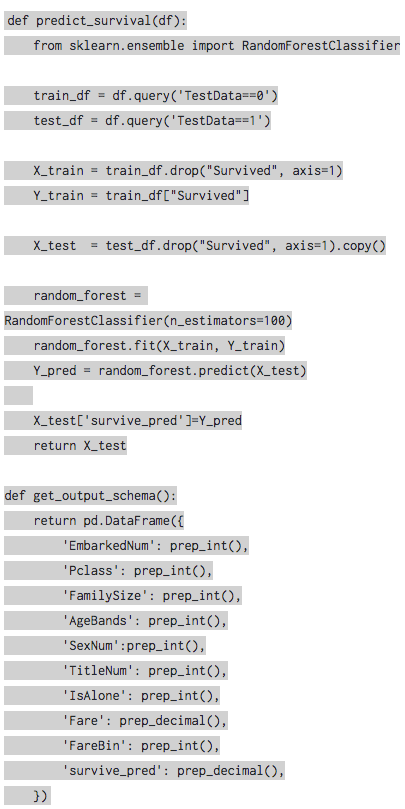
This code is exactly the same as the linear regression code we used in the example above. Rather than calling the LR library, this code calls the random forest classifier. It calls the fit function, then the predict function, saving the result to a new column on the test dataframe. That test dataframe is then returned and we can output it as the result of our flow:

Summary of learnings
Tableau Prep can now make use of Python scripts. Getting it to work is pretty straight-forward, with a few technical details that we have covered in this article.
Feedback on this article is encouraged and always welcome. Thanks for reading, and for using Tableau! The shoulders on which I stand in writing this article include Joshua Milligan, bashii-Iwahashi Tomohiro (thank you Google/Chrome for translating), and Tom.
Try it out for yourself! Download the latest version of Tableau Prep today.


