Starter Kit II – Revenue Cycle Management Dashboard
Almost one year ago, I was lucky enough to be offered an exciting opportunity to join Tableau’s healthcare team after spending much of my professional career working for a leading healthcare revenue cycle management (RCM) company. It was there I experienced, first-hand, how important it is for healthcare providers to leverage data and analytics across their entire revenue cycle. As one of the more technical members on the customer success team, I enjoyed partnering with my customers to provide them with reporting and analytics so they could make informed decisions about claims denials, charge capture and coding, payment posting, and appeals and collections (just to name a few areas). I quickly witnessed how dependent the RCM teams were on us, as a vendor, to provide high-quality reporting and analytics, so they could gain more insight into how their revenue cycle was performing and identify potential improvement areas.
After building and delivering hundreds of ad hoc solutions for my customers, I found that there are several reasons for this dependency, but many of them can be characterized as 1) lack of internal access to operational, financial, and clinical data that’s been curated to solve “revenue cycle problems” or 2) rigid or complex technology that can be intimidating to Excel users.
Earlier this year I came across a study (based on a survey conducted by Kaufman Hall) that stated 96% of healthcare CFOs believe their organizations need to do more to leverage financial and operational data analytics to optimize their care delivery model—from both financial and clinical standpoints. Given what I described above, I was shocked that almost 100% of these executives agree data analytics in RCM is important—yet they remain heavily dependent on outside vendors.

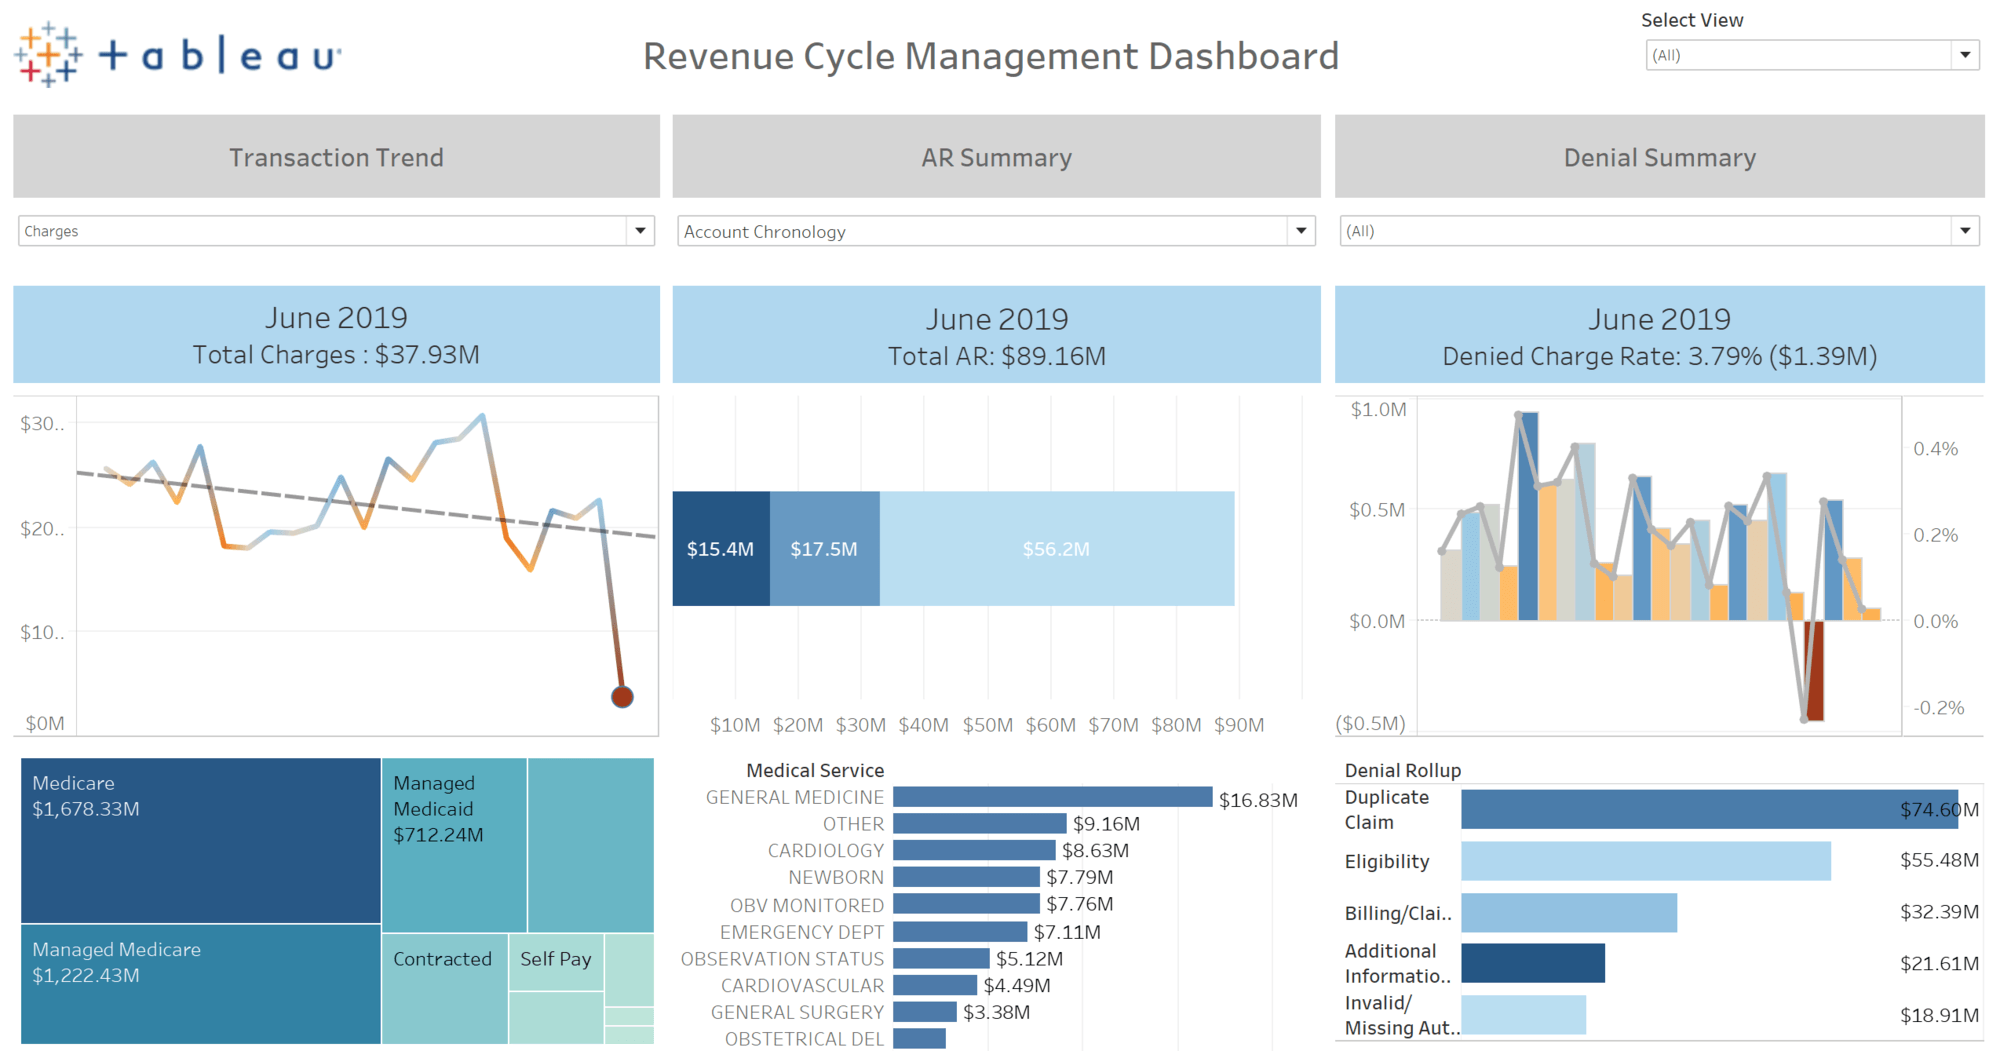
For this reason, I decided to build the Healthcare Provider Revenue Cycle Management Starter Kit. I think the Kit offers providers an entry point to take back control of the reporting and analytics that impact their own organization’s revenue cycle. The Healthcare Provider RCM Dashboard is designed to provide healthcare providers of all types and sizes with increased visibility and insight into three key areas of their revenue cycle: 1) transactional trending, 2) accounts receivables, and 3) denials management.
As part of the Starter Kit, you will find:
- The Tableau workbook, built to increase visibility and insight into three key areas of the revenue cycle: 1) transaction trending; 2) accounts receivables; 3) denials management
- The Starter Guide to help you deploy the workbook
- Three Excel-based data sources to enable the robust features of the workbook
- A sample Tableau Prep Flow to tie the data together
My hope is that with this Starter Dashboard you can you ask and answer questions from your revenue cycle data in an easy, valuable, and secure manner.
Interested in learning about additional starter kits? Check out our Healthcare Executive KPI Dashboard Starter Kit.
관련 스토리
Subscribe to our blog
받은 편지함에서 최신 Tableau 업데이트를 받으십시오.


