DataFam Roundup: May 23 - 27, 2022


Welcome! Dig into this week's DataFam Roundup—a weekly blog that brings together community content all in one post. As always, we invite you to send us your content—and the DataFam content from your peers that have inspired you! Find the content submission form here.
DataFam content

Shazeera Ahmad Zawawi: The Chronicles of a Data Rookie: A visual recap of my presentation at TC2022!
Dive into content created by the Tableau Community:
- Kevin Flerlage, The Flerlage Twins: 5 Things You Can Do in Web Edit, But NOT Tableau Desktop
- CJ Mayes: Violin Over Time
- The Tableau Wannabe Podcast:
- Sarah Bartlett, Sarah Loves Data: Tableau Conference Highlights 2022 #data22
- Adam Mico: #Data22– My 7ish Tableau Conference Hot Takes + Bonus Tips
- Shazeera Ahmad Zawawi: The Chronicles of a Data Rookie: A visual recap of my presentation at TC2022!
- Jared Flores: What the Viz: Curvy Bump Chart & Slope Chart - Tableau Prep Template
- Brian Moore, Do Mo(o)re with Data: Totally Useless Charts & How to Build Them – Lotus Flowers
- Ethan Lang and Maggy Muellner: Measures and Dimensions in Tableau
- Annabelle Rincon, Rativiz: Tips & Tricks for beginners
- Agata Mężyńska: Heat Map – what exactly is it?
Team Tableau

Iron Viz 2022 Championship finalists demonstrate best-in-class mastery of data skills
- Iron Viz 2022 Championship finalists demonstrate best-in-class mastery of data skills
- The Vizzies celebrate the DataFam at TC22
Upcoming events and community participation
- Tableau DataFest 2022: It’s time to sharpen your Tableau skills, propel your career forward, and have some fun at a Tableau DataFest in a city near you. Drawing together key sessions from Tableau Conference ‘22 in Vegas with new bespoke demos and deep dives from local customers and partners, Tableau DataFest is your destination for data.
- Stay up to date with the latest and greatest from the Tableau Community. We'll help you along in your Tableau journey, bring your data skills to the next level, and nurture powerful connections.
- Sign up to be a panelist for the 3charts@3 Live: A Mystery Chart Show featuring topics like personal finance, energy, healthcare and more!
- Watch on-demand: May the 4th Be With You
- Data Book Club, Spring 2022 Selection: Upstream: The Quest to Solve Problems Before They Happen by Dan Heath
Vizzes
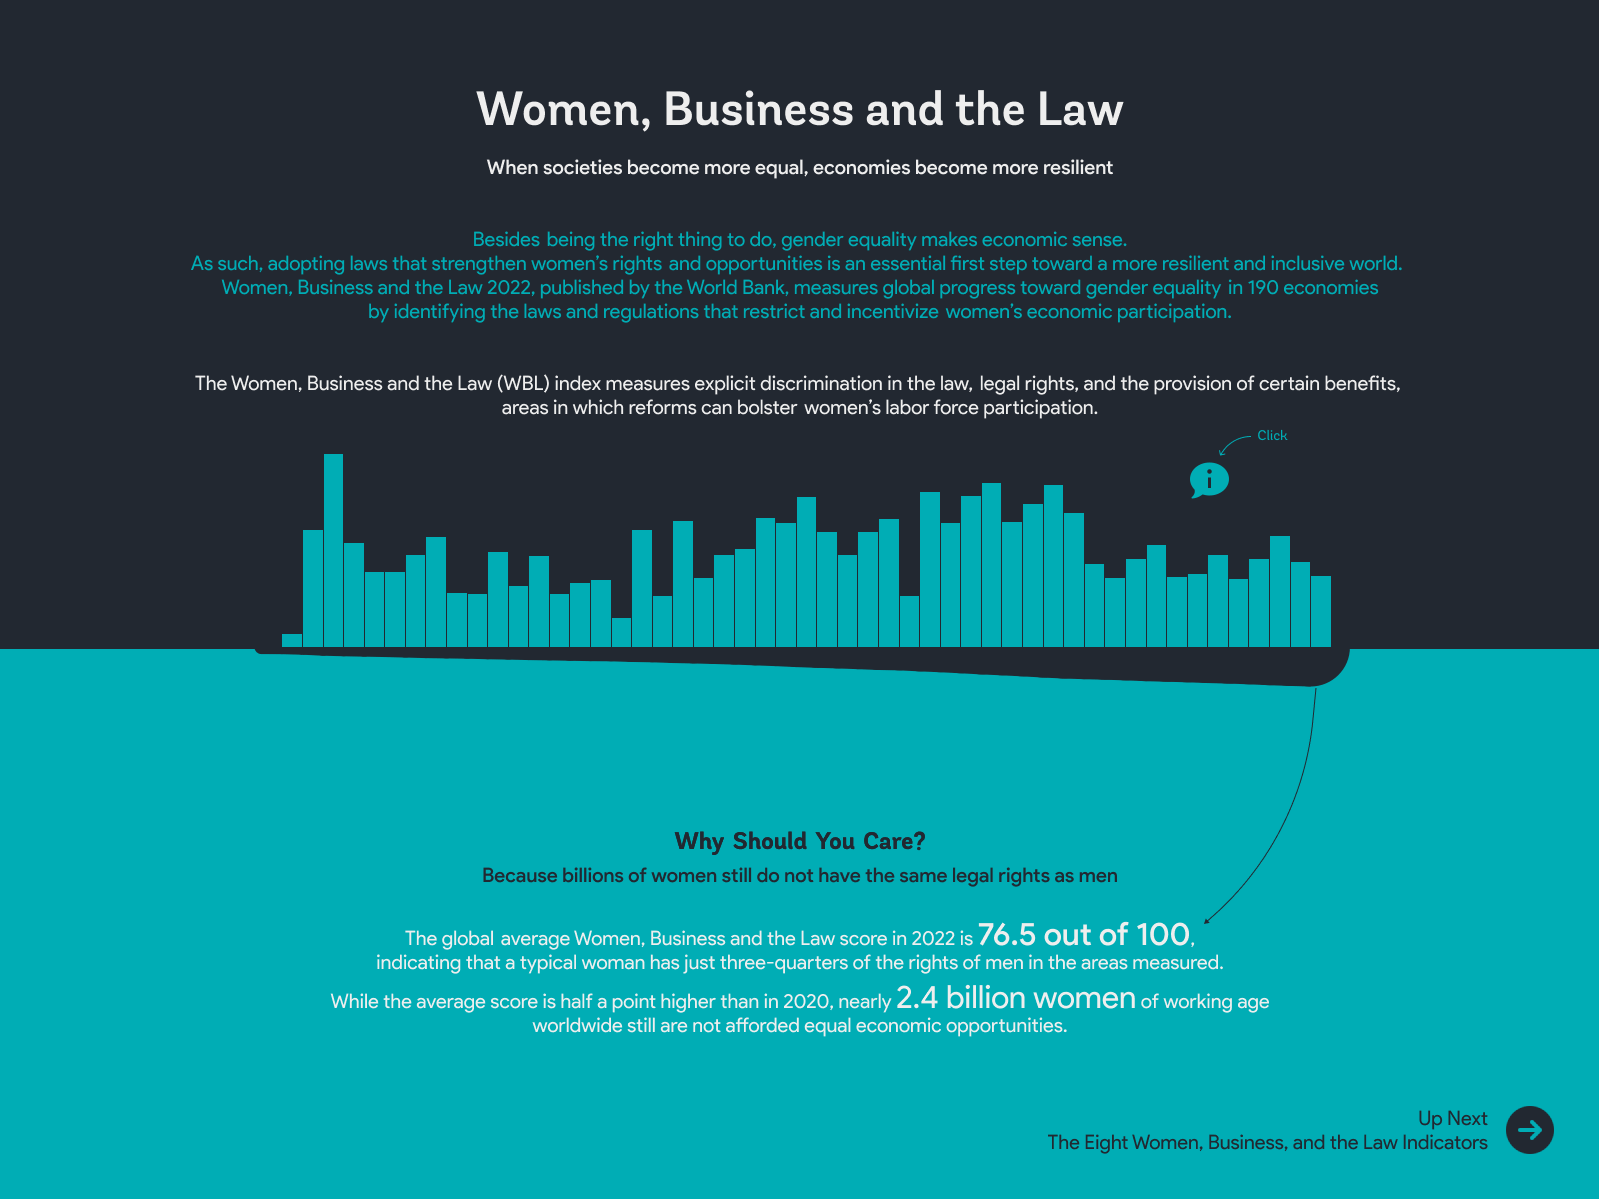
Varun Jain: Women, Business and the Law | #DiversityInData
See the latest Viz of the Day, trending vizzes, featured authors, and more on Tableau Public.
Check out some inspirational vizzes created by the community:
- Ghafar Shah: Tinder App Review | Google Play Store
- Sam Epley: #B2VB 2022 Week 11: Which States Produce the Most Wine?
- Adedamola (Damola) Ladipo: The FIFA Men's World Cup Expansion
- Varun Jain: Women, Business and the Law | #DiversityInData
Community Projects
Back 2 Viz Basics
A bi-weekly project helping those who are newer in the community and just starting out with Tableau. Not limited just to newbies!
Web: Back 2 Viz Basics
Twitter: #B2VB
Week 11: Using Sets for Top N
Workout Wednesday
Build your skills with a weekly challenge to re-create an interactive data visualization.
Web: Workout Wednesday
Twitter: #WOW2022
Week 20: Monthly Sales vs Target
Preppin' Data
A weekly challenge to help you learn to prepare data and use Tableau Prep.
Web: Preppin’ Data
Twitter: #PreppinData
Week 21: Multi-sheets of Madness
DataFam Con
A monthly challenge covering pop culture and fandoms.
Web: DataFam Con
Twitter: #DataFamCon
May 2022: May the 4th be With You DataFam
EduVizzers
A monthly project connecting real education data with real people.
Web: Eduvizzers
May 2022: Top University Social Media Rankings – 2021
Data Plus Music
A monthly project visualizeing the data behind the music we love!
Web: Data Plus Music
Twitter: #DataPlusMusic
February 2022: MIDI Music Analysis
Games Night Viz
A monthly project focusing on using data from your favorite games.
Web: Games Nights Viz
Twitter: #GamesNightViz
May 2022: Level 4: The Need for Speed
Iron Quest
Practice data sourcing, preparation, and visualization skills in a themed monthly challenge.
Web: Iron Quest
Twitter: #IronQuest
March 2022: Music Firsts
Storytelling with Data
Practice data visualization and storytelling skills by participating in monthly challenges and exercises.
Web: Storytelling with Data
Twitter: #SWDChallenge
May 2022: embracing constraints
Project Health Viz
Uncover new stories by visualizing healthcare data sets provided each month.
Web: Project Health Viz
Twitter: #ProjectHealthViz
January 2022: One Year of Sleep
Diversity in Data
An initiative centered around diversity, equity & awareness by visualizing provided datasets each month.
Web: Diversity in Data
Twitter: #DiversityinData
May and June 2022: Diversity in Art
Sports Viz Sunday
Create and share data visualizations using rich, sports-themed data sets in a monthly challenge.
Web: Sports Viz Sunday
Twitter: #SportsVizSunday
May 2022: Indy 500
Viz for Social Good
Volunteer to design data visualizations that help nonprofits harness the power of data for social change.
Web: Viz for Social Good
Twitter: #VizforSocialGood
Real World Fake Data
Create business dashboards using provided data sets for various industries and departments.
Web: Real World Fake Data
Twitter: #RWFD
Session 4: Project Management Office (PMO)
Viz 2 Educate
Each month, create vizzes on global education syllabus topics as resources for teachers worldwide.
Web: Viz 2 Educate
Twitter: #Viz2educate
February 2022: Food & Nutrition
Makeover Monday
Join the community every Monday to work with a given data set and create better, more effective visualizations.
Web: Makeover Monday
Twitter: #MakeoverMonday
SDG Viz Project
Visualize data about Sustainable Development Goals provided by the World Health Organization. Web: SDG Viz ProjectTwitter: #TheSDGVizProject
관련 스토리

DataFam Roundup: January 6-10, 2025

DataFam Roundup December 23, 2024 - January 3, 2025

DataFam Roundup December 16-20, 2024
Subscribe to our blog
받은 편지함에서 최신 Tableau 업데이트를 받으십시오.