DataFam Roundup: July 18-22, 2022
Welcome! Dig into this week's DataFam Roundup—a weekly blog that brings together community content all in one post. As always, we invite you to send us your content—and the DataFam content from your peers that have inspired you! Find the content submission form here.
DataFam content
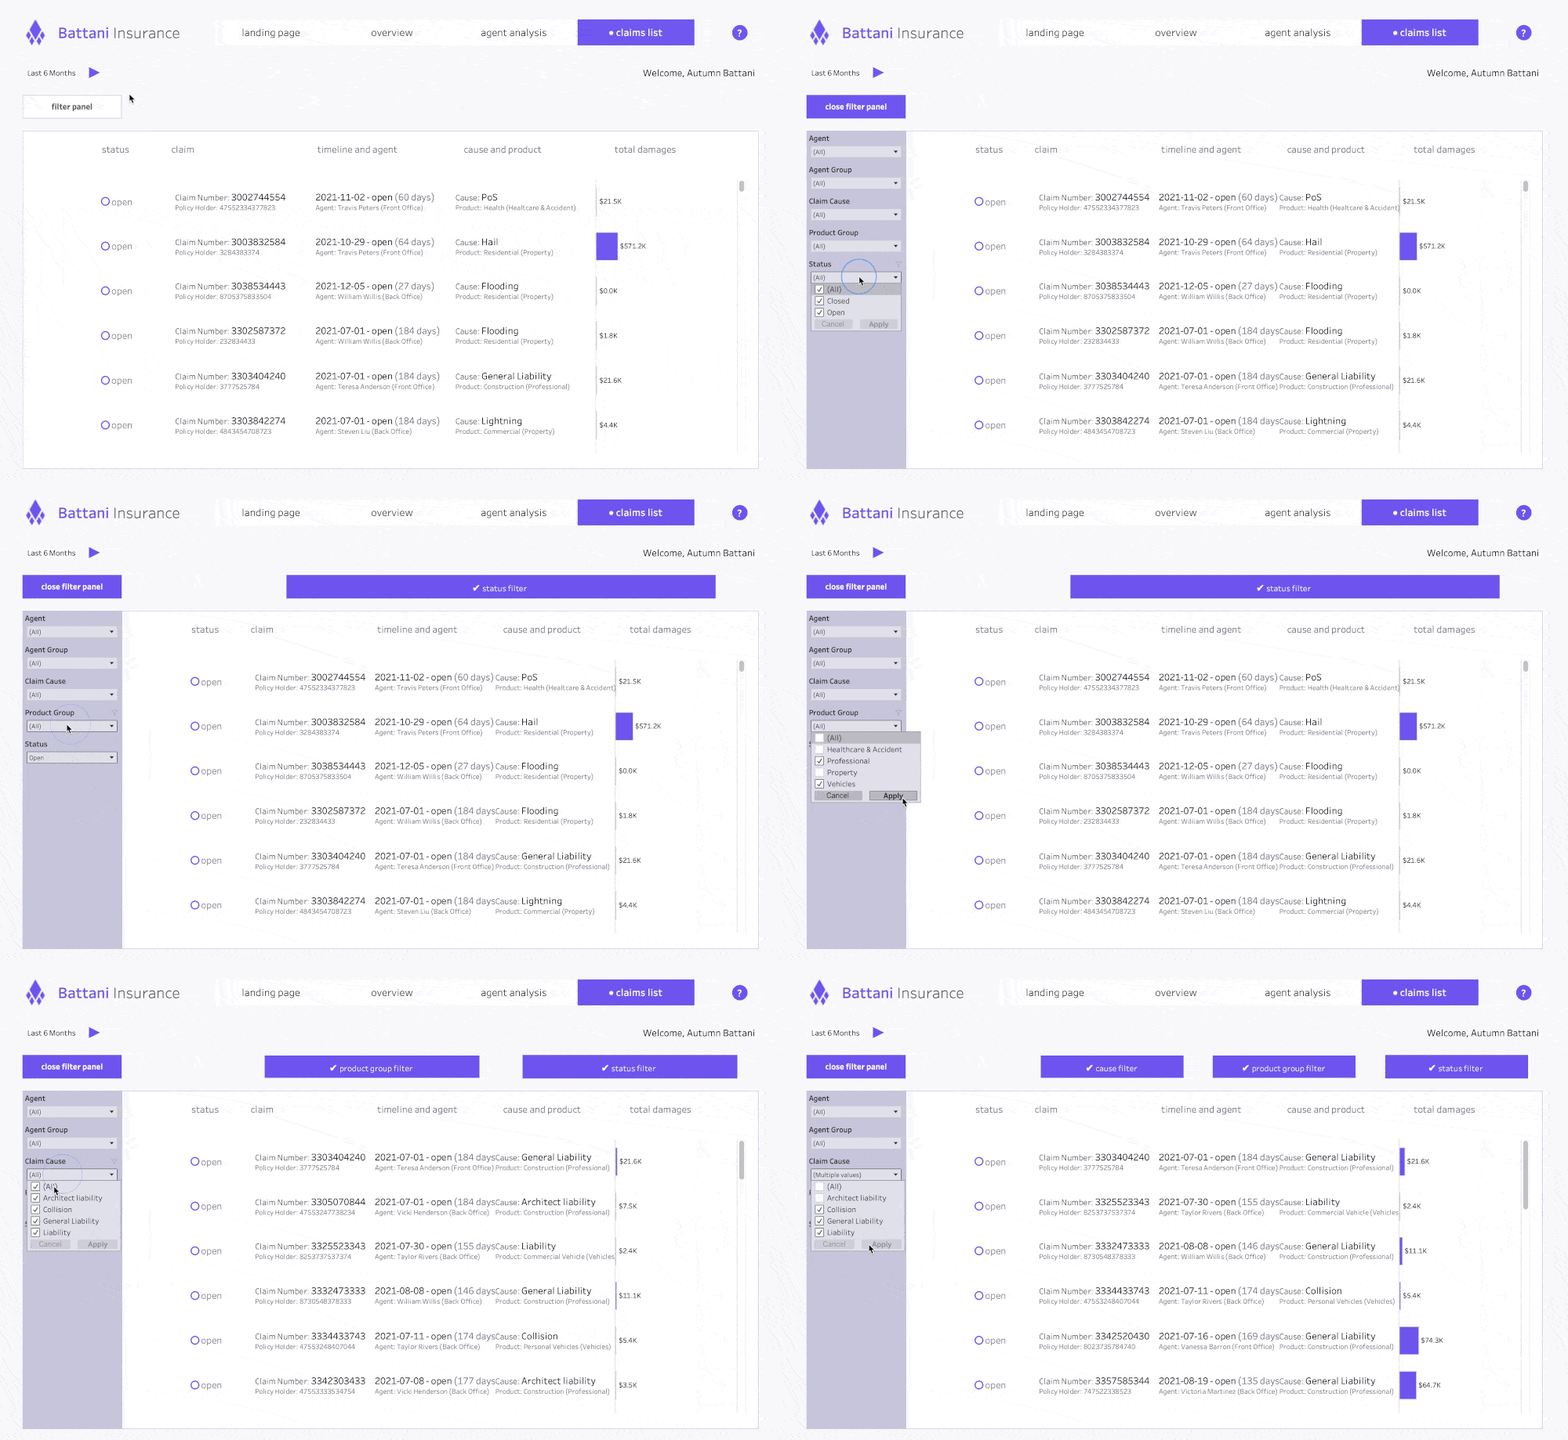
Autumn Battani, Make it Make Sense: Kicking It Up A Notch
Dive into content created by the Tableau Community:
-
Alexander Mou, VizDiff: Calculating YoY of Quarterly and Yearly Sums in Tableau
-
Elliott Stam, Towards Data Science: Query Tableau workbook permissions for all groups and users
-
Frederic Fery, Data Visual.blog: Drive time analysis using Tableau and Mapbox Isochrone API
-
Anna Foard, The Stats Ninja: Tableau Reference Lines: When Averages Mean Something You Don’t
-
Zishen Li: Tableau practice tips
-
Autumn Battani, Make it Make Sense: Kicking It Up A Notch
-
Zach Bowders, Data + Love: Dr Kevin Wee
-
Darragh Murray: How to build and interpret an index chart using Tableau
-
Nir Smilga: Part to a whole- Suggested Alternatives
Team Tableau
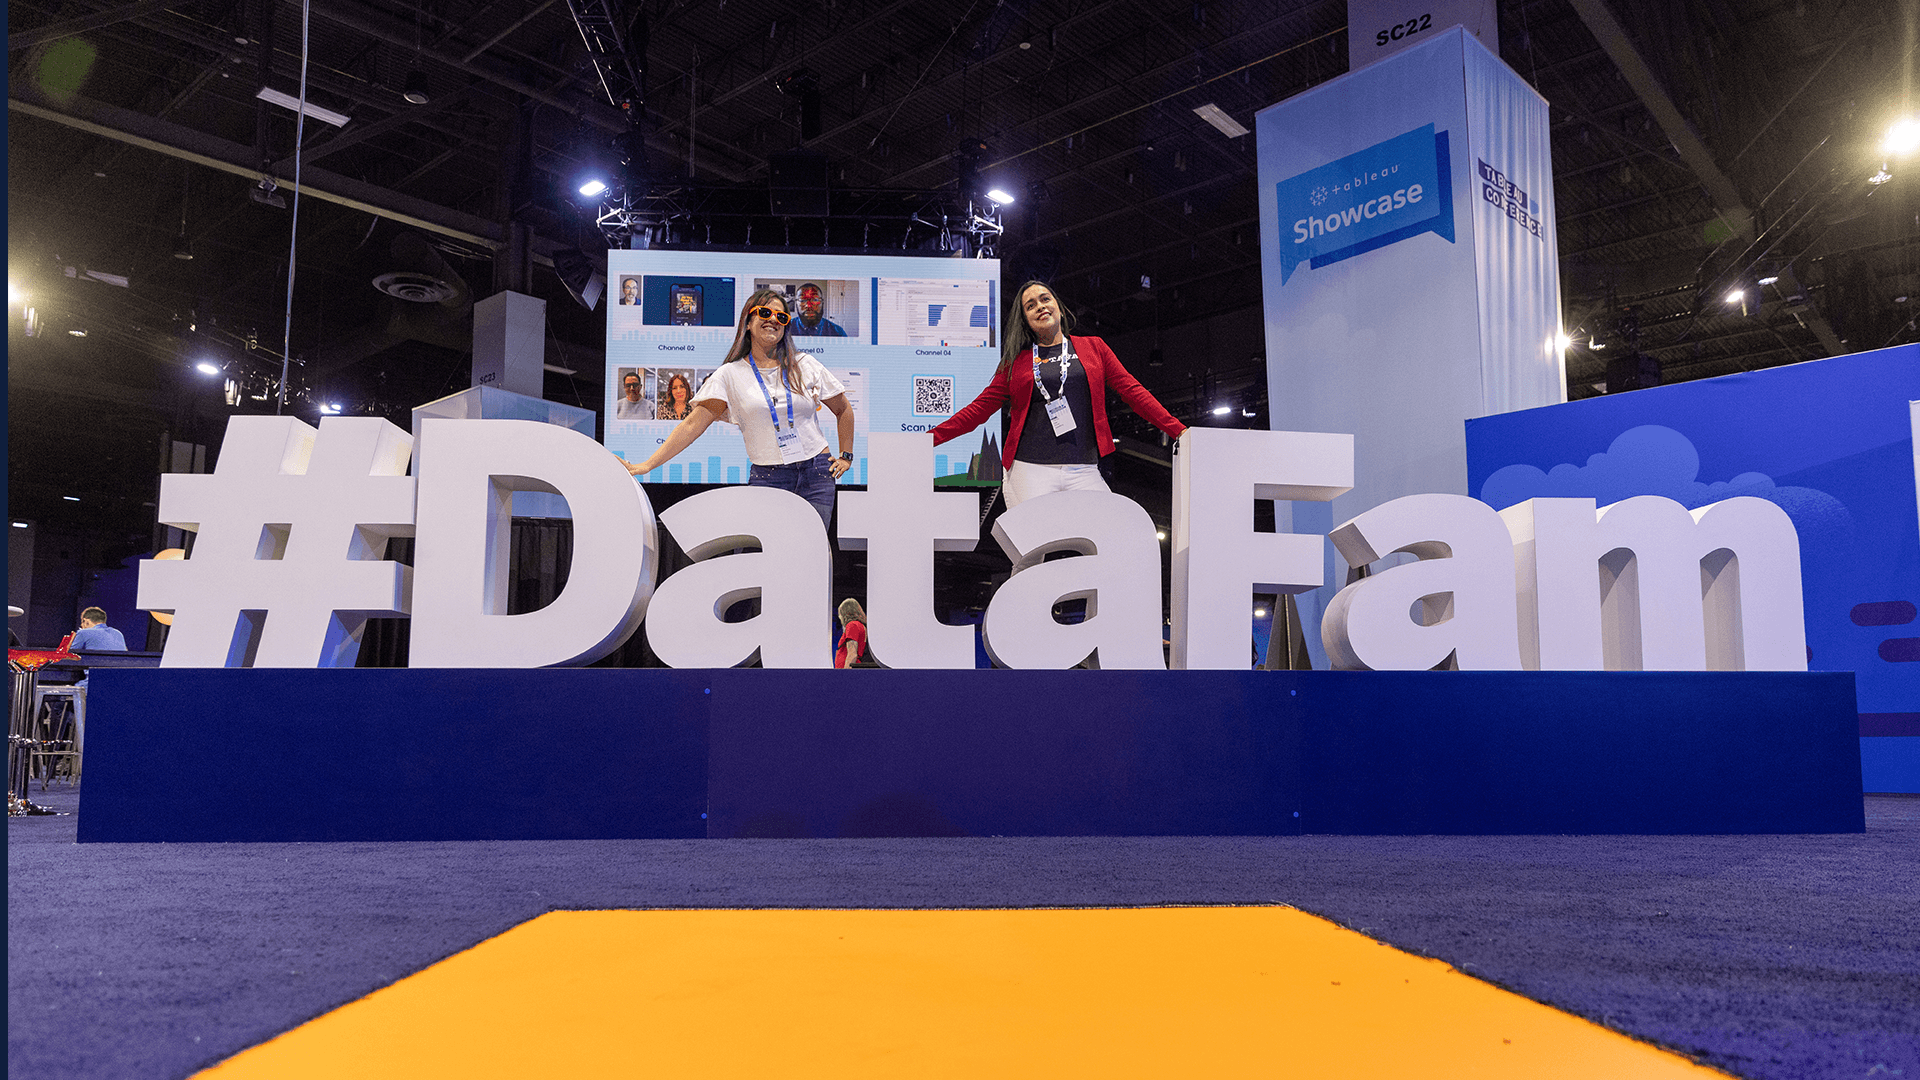
DataFam signage photo at Tableau Conference 2022
- 2022 Tableau Ambassador nominations and applications now open—deadline extended July 28, 2022, at 5:00 p.m. PDT.
- How I Became a Data Leader with the Help of Tableau and the Community featuring Social Ambassador Will Perkins
Upcoming events and community participation
-
Interested in exploring mental wellbeing through the lens of data? Join our upcoming Data + Diversity virtual event on July 28.
-
What is the #PublicPolicyViz Project? The #PublicPolicyViz project is a Tableau Community Project dedicated to bridging the gap between analytics professionals and policy practitioners. We seek to facilitate collaboration between the two groups through engaging projects. Launching August 2022.
-
VizConnect Tableau Prep Academy: 4 weeks structured program to help you understand foundational knowledge of Tableau prep, Data structure , Data Densification, best practices and Tips & tricks.
- Tableau DataFest 2022: It’s time to sharpen your Tableau skills, propel your career forward, and have some fun at a Tableau DataFest in a city near you. Drawing together key sessions from Tableau Conference ‘22 in Vegas with new bespoke demos and deep dives from local customers and partners, Tableau DataFest is your destination for data.
- Stay up to date with the latest and greatest from the Tableau Community. We'll help you along in your Tableau journey, bring your data skills to the next level, and nurture powerful connections.
- Sign up to be a panelist for the 3charts@3 Live: A Mystery Chart Show featuring topics like personal finance, energy, healthcare and more!
- Data Book Club, Summer 2022 Selection: Invisible Women: Data Bias in a World Designed for Men
Vizzes
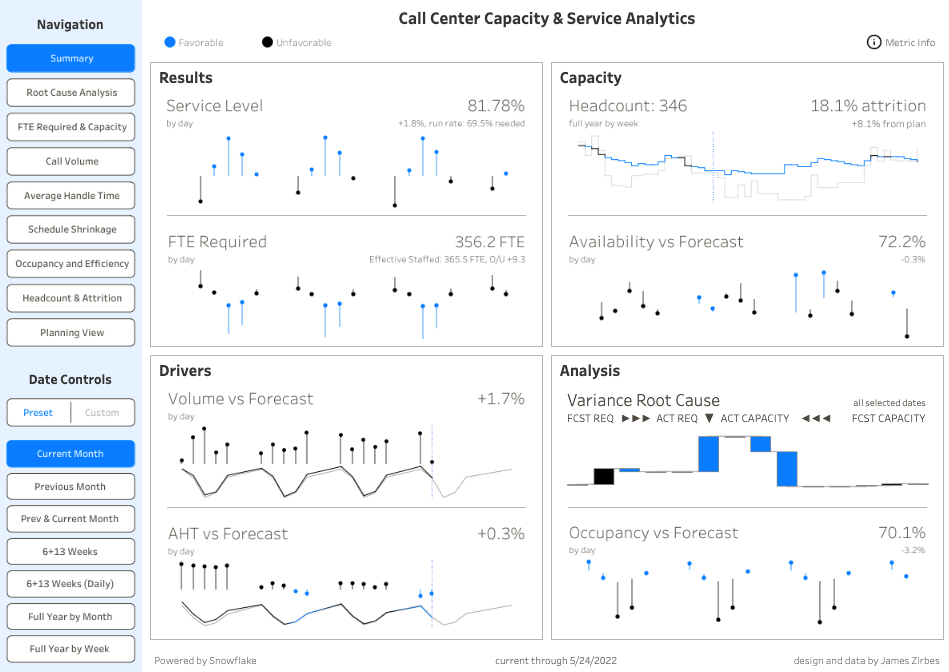
James Zirbes: Call Center Capacity and Service Analytics
See the latest Viz of the Day, trending vizzes, featured authors, and more on Tableau Public.
Check out some inspirational vizzes created by the community:
- Kevin Flerlage: Seinfeld Recurring Characters
- Mohit Kumar: Snakes and Ladders
- James Zirbes: Call Center Capacity and Service Analytics
- Luke Abraham: Netflix - Finding Yourself | #B2VB Histograms
- Jyoti Lunaych: Everest Financials Dashboard #RWFD
- Rotaru Sergiu: Cost of Living in Europe - #RomanianDATATribe July 2022
Community Projects
Back 2 Viz Basics
A bi-weekly project helping those who are newer in the community and just starting out with Tableau. Not limited just to newbies!
Web: Back 2 Viz Basics
Twitter: #B2VB
Week 15: Build a Histogram
Workout Wednesday
Build your skills with a weekly challenge to re-create an interactive data visualization.
Web: Workout Wednesday
Twitter: #WOW2022
Week 29: What is the Time-Weighted Return?
Preppin' Data
A weekly challenge to help you learn to prepare data and use Tableau Prep.
Web: Preppin’ Data
Twitter: #PreppinData
Week 29: C&BSco Meeting Targets?
DataFam Con
A monthly challenge covering pop culture and fandoms.
Web: DataFam Con
Twitter: #DataFamCon
July 2022: Hugo and Nebula Awards!
EduVizzers
A monthly project connecting real education data with real people.
Web: Eduvizzers
July 2022: Global School-Age Digital Connectivity
Games Night Viz
A monthly project focusing on using data from your favorite games.Web: Games Nights Viz
Twitter: #GamesNightViz
July 2022: Nostalgic Games
Iron Quest
Practice data sourcing, preparation, and visualization skills in a themed monthly challenge.
Web: Iron Quest
Twitter: #IronQuest
July 2022: Nostalgic Games
Data Plus Music
A monthly project visualizing the data behind the music we love!
Web: Data Plus Music
Twitter: #DataPlusMusic
July 2022: The Intro
Storytelling with Data
Practice data visualization and storytelling skills by participating in monthly challenges and exercises.
Web: Storytelling with Data
Twitter: #SWDChallenge
July 2022: think globally
Project Health Viz
Uncover new stories by visualizing healthcare data sets provided each month.
Web: Project Health Viz
Twitter: #ProjectHealthViz
July 2022: Rural Hospital Closures (updated data)
Diversity in Data
An initiative centered around diversity, equity & awareness by visualizing provided datasets each month.
Web: Diversity in Data
Twitter: #DiversityinData
June and July 2022: Movie casting
Sports Viz Sunday
Create and share data visualizations using rich, sports-themed data sets in a monthly challenge.
Web: Sports Viz Sunday
Twitter: #SportsVizSunday
July 2022: 150th Open Championship
Viz for Social Good
Volunteer to design data visualizations that help nonprofits harness the power of data for social change.
Web: Viz for Social Good
Twitter: #VizforSocialGood
Real World Fake Data
Create business dashboards using provided data sets for various industries and departments.
Web: Real World Fake Data
Twitter: #RWFD
Session 2: Financial Overview
Viz 2 Educate
Each month, create vizzes on global education syllabus topics as resources for teachers worldwide.
Web: Viz 2 Educate
Twitter: #Viz2educate
Makeover Monday
Join the community every Monday to work with a given data set and create better, more effective visualizations.
Web: Makeover Monday
Twitter: #MakeoverMonday
SDG Viz Project
Visualize data about Sustainable Development Goals provided by the World Health Organization.
Web: SDG Viz Project
Twitter: #TheSDGVizProject
관련 스토리
Subscribe to our blog
받은 편지함에서 최신 Tableau 업데이트를 받으십시오.


