Subject Area: Architecture
Level of complexity: Beginner
Approximate Time to complete: 30 minutes
Companion Workbook (twbx): DimensionsAndMeasures.twbx
Additional Resources on the web:
- http://onlinehelp.tableau.com/current/pro/online/en-us/help.htm#datafields_typesandroles_datatypes.html
- http://drawingwithnumbers.artisart.org/wiki/tableau/dimensions-and-measures/
A quick intro to what is a dimension versus a measure; continuous versus discrete, and aggregate versus non-aggregate.
Using measurements as our primary example: In Tableau there are four possible modes when dealing with your measurement fields which result in a different layout or result. They are a) continuous aggregate measure, b) discrete aggregate measure, c) continuous disaggregate measure, d) discrete disaggregate measure. B and D are considered dimensions by Tableau. Let's look at specific examples:
A) A continuous aggregate measure is a great way to summarize your information. Tableau will automatically create the appropriate axis range for your measurement, and will query your data source using an optimized aggregate SQL query:

B) If we change "continuous" to "discrete" for our SUM(Sales) measurement:
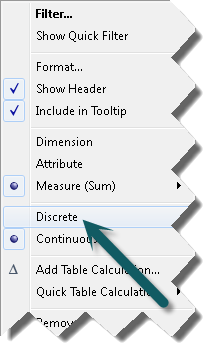
We will now get a different type of view in Tableau:
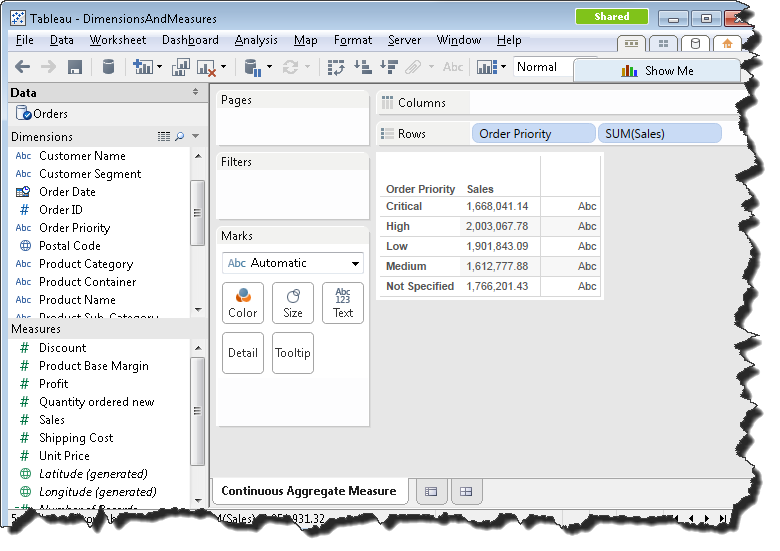
Best Practice in Tableau is to use the continuous, visual choice and not the discrete choice, as the human eye can read the visual option much easier. This is counter-intuitive for people who are used to operational reports, and not used to visual analytics.
C) Continuous dis-aggregate measure. In this mode, we select "dimension" for our SUM(Sales) measure, and now Tableau will dis-aggregate it.
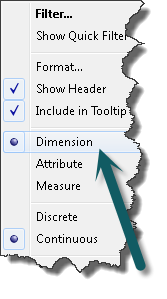
The visual result will look like this:
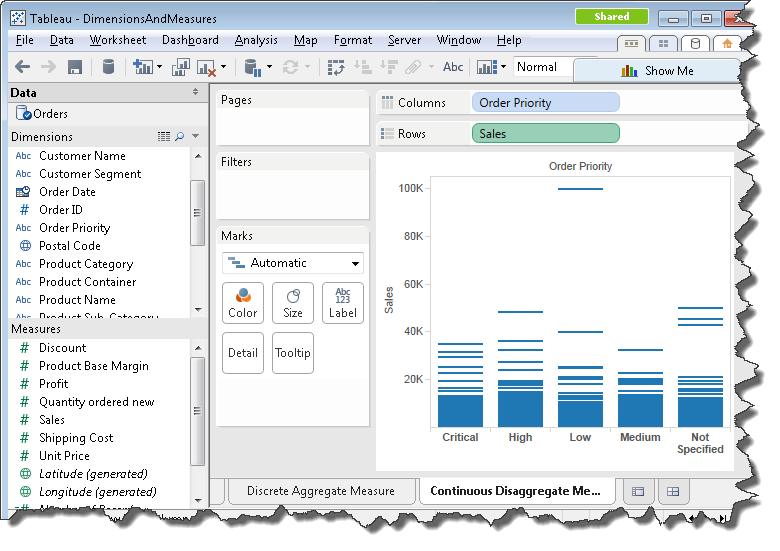
This type of view – sometimes called density analysis – can be very effective for reviewing large amounts of data visually.
D) Finally, we can still mark our dis-aggregate measure as "Discrete" which will give us this view:
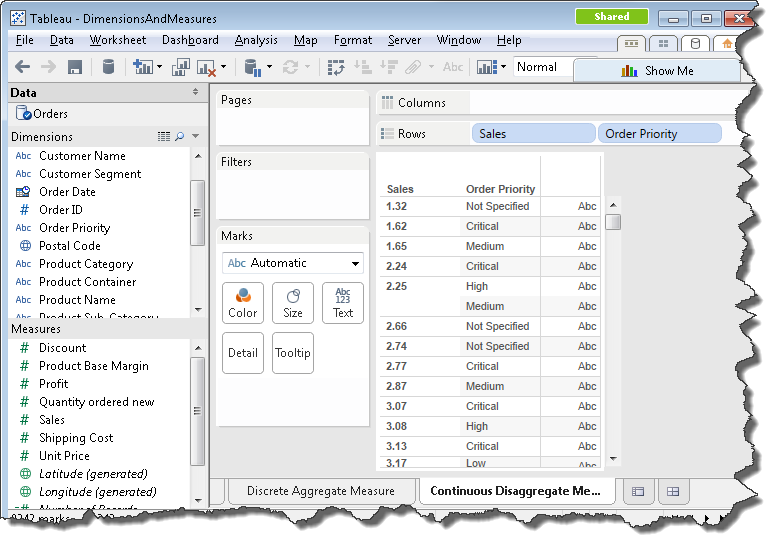
Now we have listed each discrete sales amount from the database in a non-aggregate manner. Tableau does not recommend this type of view if at all possible. It is not easy to read for the human eye and is not considered a best practice for visual analytics. There are a few edge cases where this last option is desirable, but you should try to avoid this view whenever possible.