

Explore data about the sports you know and love
Celebrate winning insights from the Tableau Community
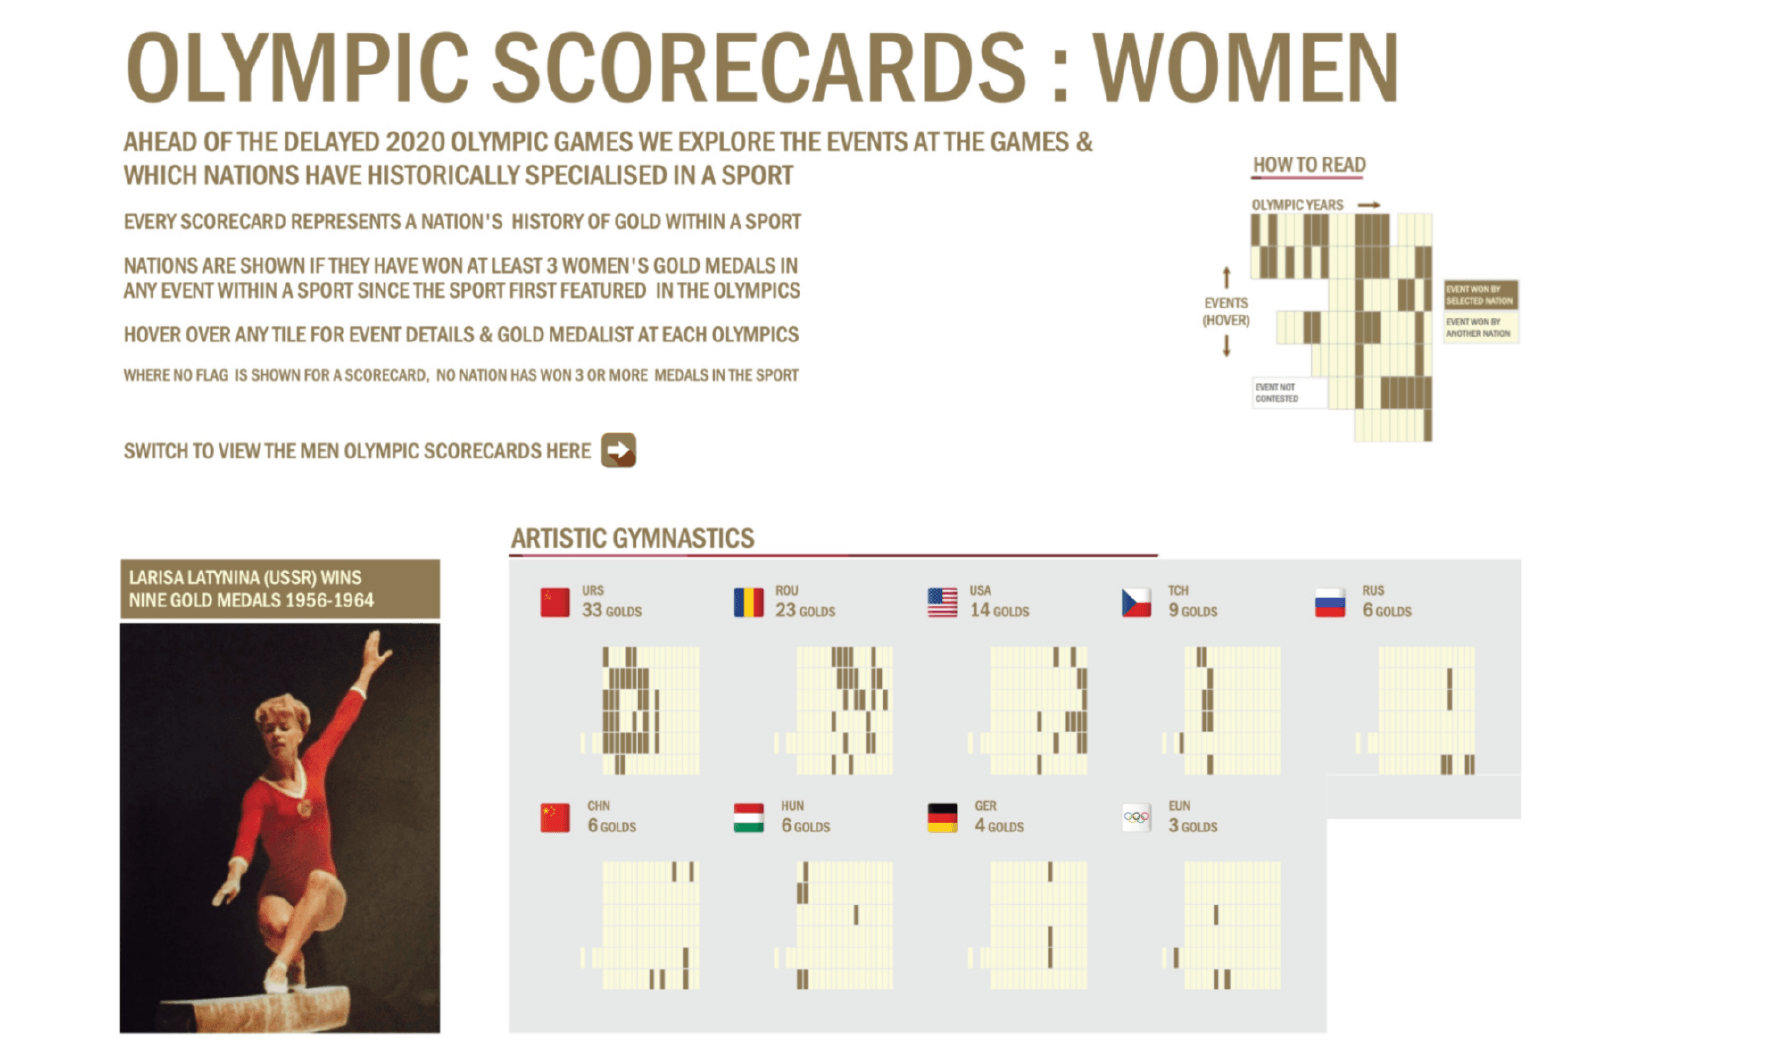
#SportsVizSunday Scorecards
Explore which countries win big at the Games. Leaders of #SportsVizSunday, Neil Richards and Simon Beaumont, collaborate on this visualization that covers events from artistic gymnastics to wrestling.

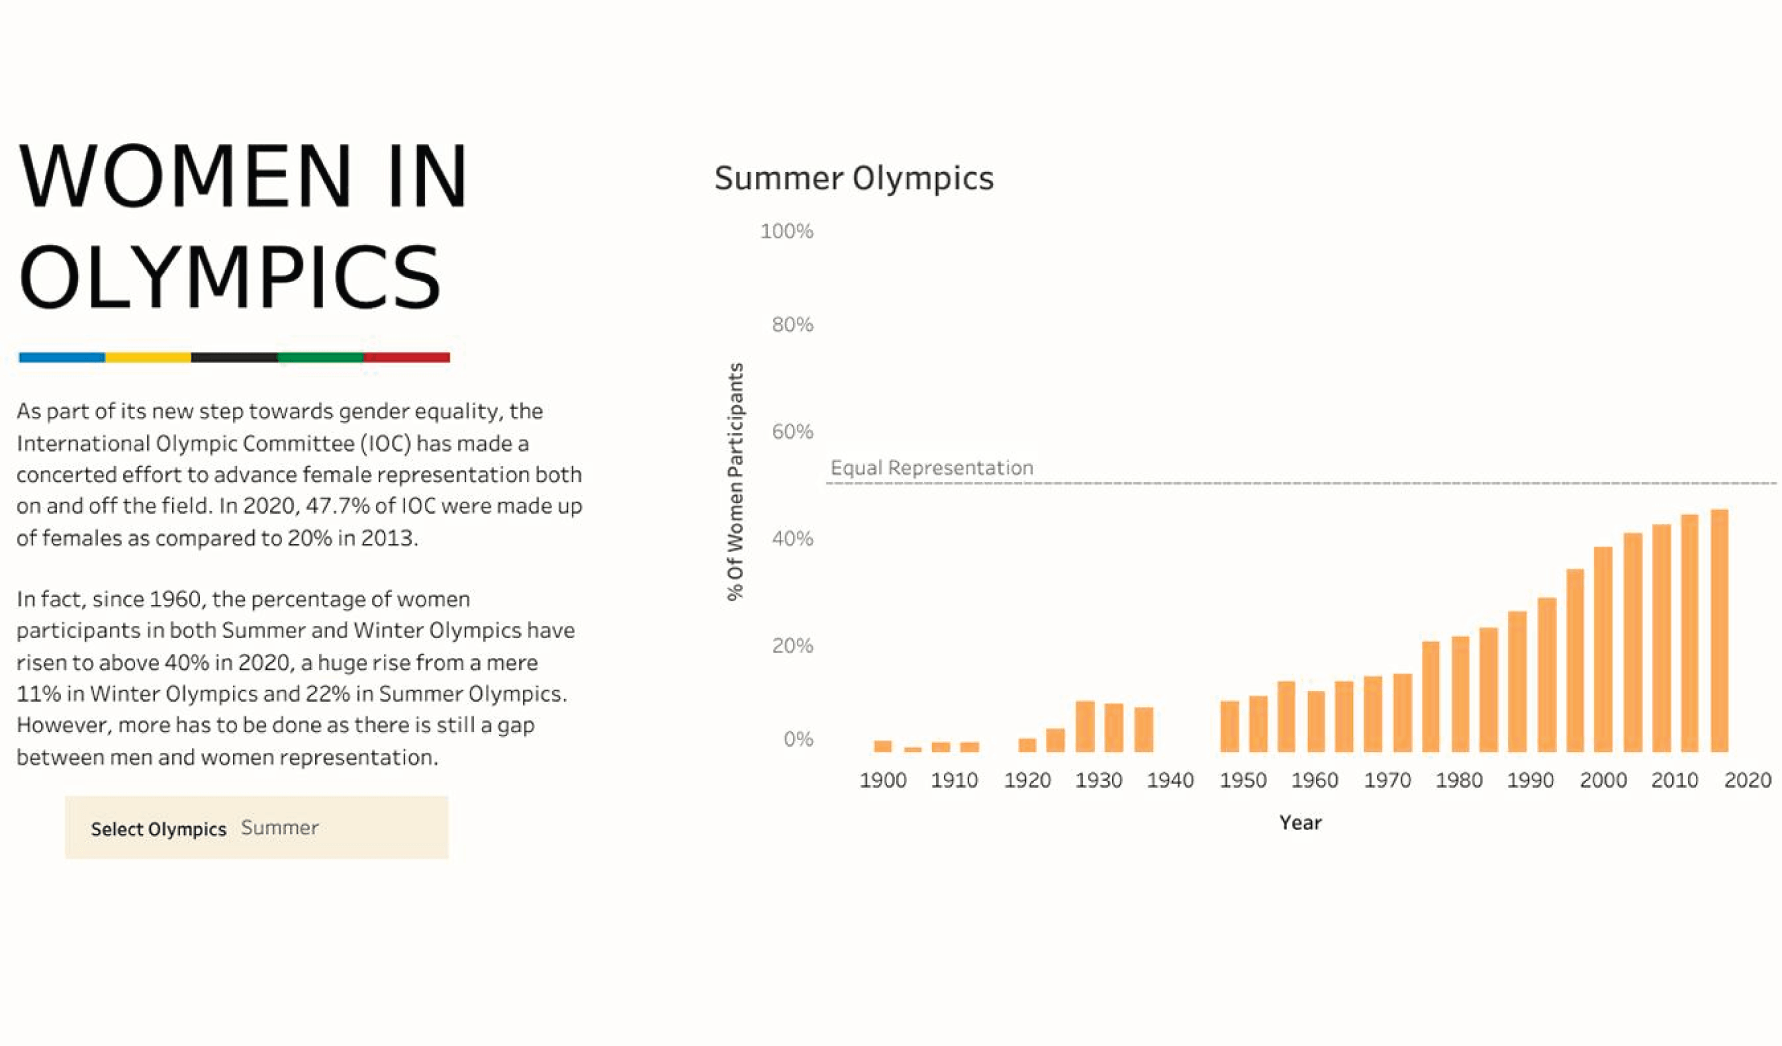
Women of the Olympic Games
The percentage of women participants in the Olympics Games has risen about 40% since 1960. Check out this visualization by Kelly Tan to see how the International Olympic Committee's commitment toward equal representation has advanced female representation over the years.

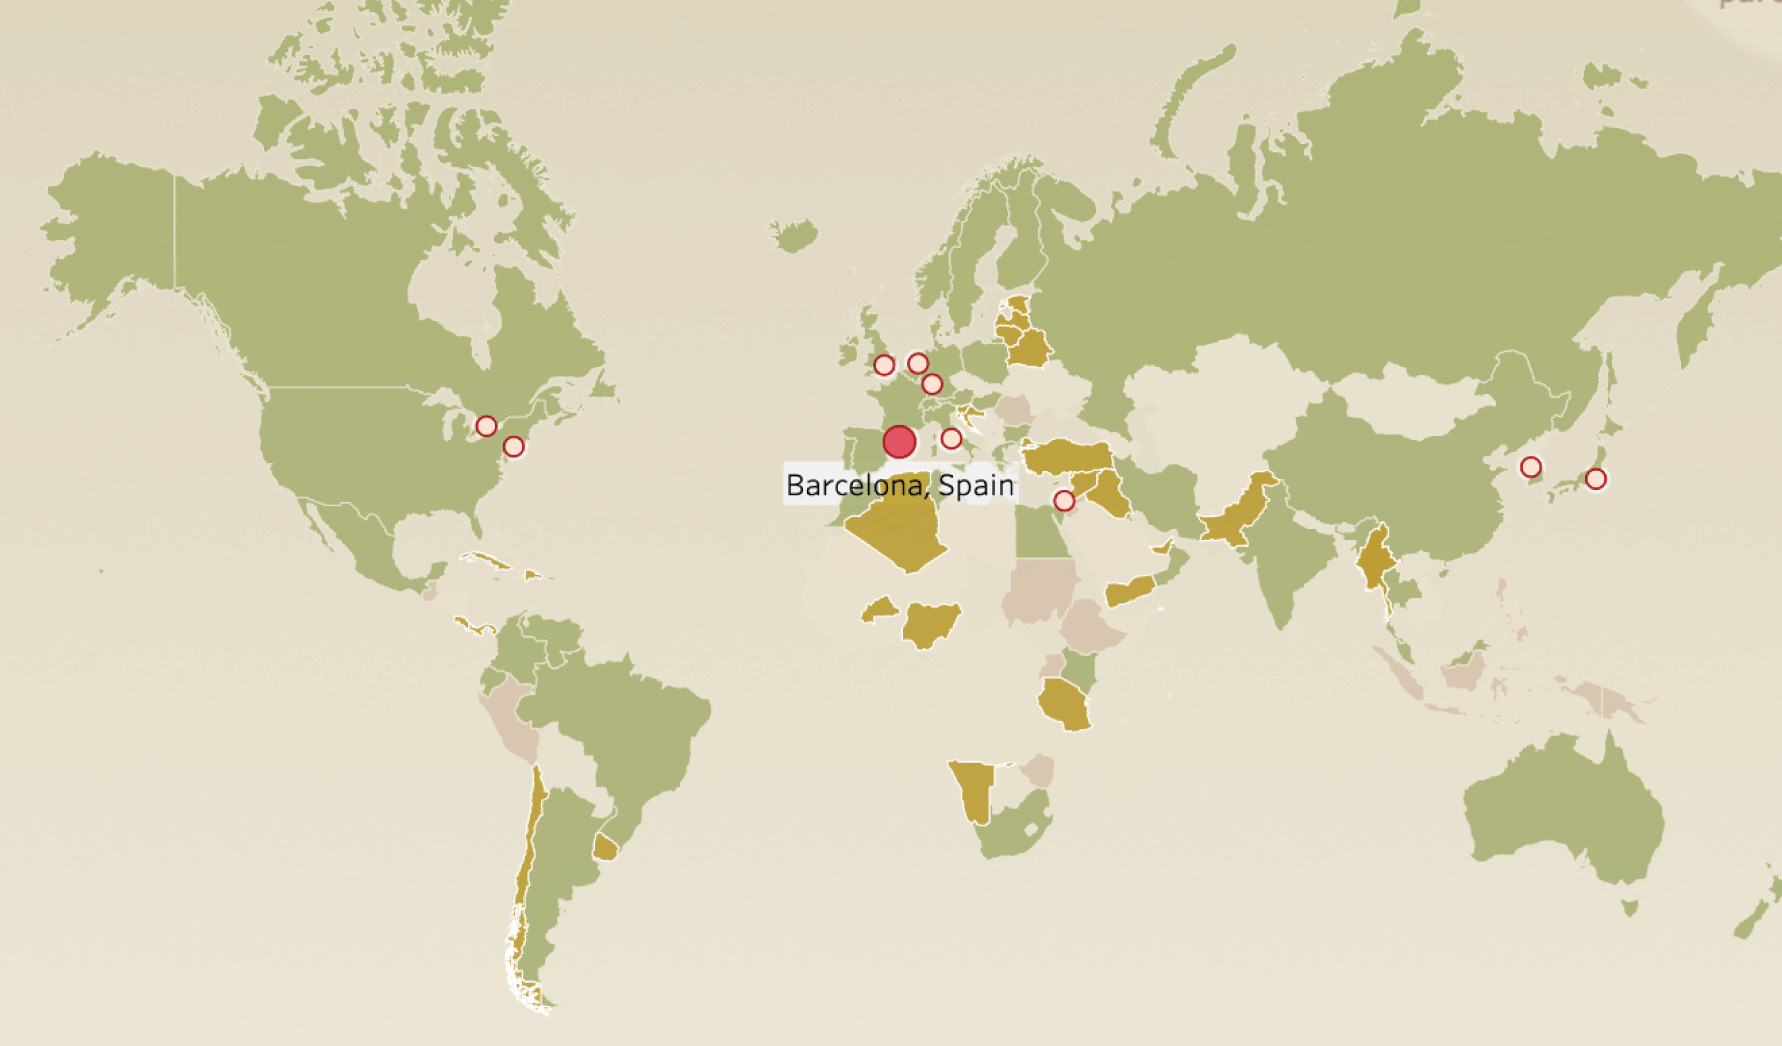
Adaptive Sports Spans the Globe
Adaptive sports, or parasports, include modifications that allow athletes with disabilities to compete. Mo Wootten explores participation by country, and the rate of growth.

Mo Wootten

The Game of Golf
It's not how you start, it's how you finish. Matt Eads explores an analysis of why he loves golf, most of the time.

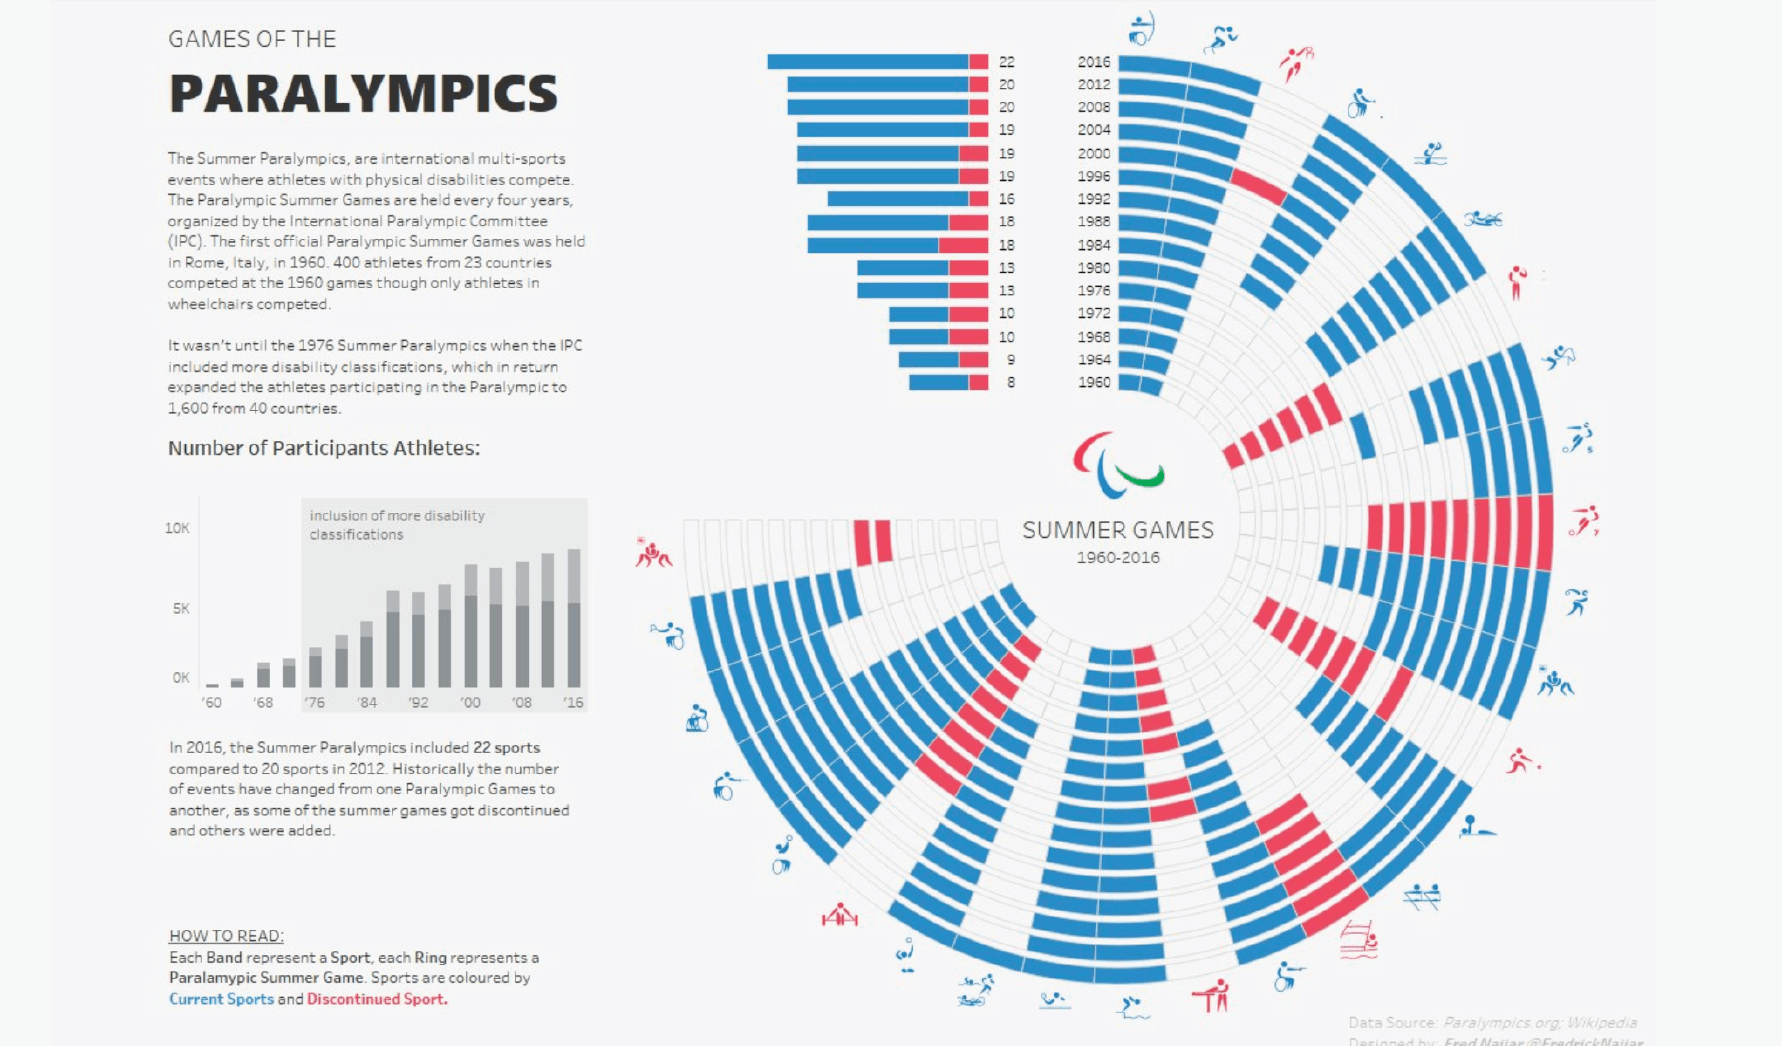
History of the Paralympics Games
The Paralympics are international, multi-sports events where athletes with physical disabilities compete. Fred Najjar's visualization showcases the history of the games dating back to 1960.


