DataFam Roundup: March 31-April 4, 2025


Welcome! Dig into this week's DataFam Roundup—a weekly blog that brings together community content all in one post. As always, we invite you to send us your content—and the DataFam content from your peers that have inspired you! Find the content submission form here.
Community Highlight
To recognize new and consistent Tableau contributors—we’re excited to have a section within the weekly DataFam Roundup called the Tableau Community Highlight. Find out how to get involved.

Tarun Gupta, Founder & CTO at Vivaansh Consulting
Rajasthan, India
Tarun's Tableau journey began while working at a startup, where he focused on marketing, analytics, and product reporting to analyze ROI. His first significant Tableau implementation was creating marketing dashboards that integrated data from both third-party and internal sources, which led him to explore Tableau's potential for data visualization and decision-making. He learned Tableau through online tutorials, blogs, and hands-on practice, by engaging with the Tableau Community, and by attending Tableau User Group sessions. Tarun is now involved in the Tableau Community through Tableau User Group leadership, publishing blogs, and engaging on social media.
Initially, Tarun attended TUG meetings to learn from industry experts and see real-world Tableau use cases. But as he gained more experience, he felt he wanted to share his knowledge with the community. This led him to becoming more actively involved, eventually taking on a leadership role in the Jaipur Tableau User Group; he has now been leading the TUG for two years.
Connect with Tarun on Linkedin, X, Tableau Public, and on his blog.
DataFam Content
Dive into content created by the Tableau Community:
- Caroline Swiger: Save Time with Custom Themes! Guest Blog Post by Caroline Swiger
- Elisa Davis: TC25 Guide for Introverts
- Nisar Ahmed: From Introvert to Tableau Social Ambassador | How Data Viz Changed Everything
- Blake Feiza: Smart Lists in Tableau: Dynamic Parameter Options Based on Filter Selection
- Brittany Rosenau: Reflections on the #30DayChartChallenge
- Ojoswi Basu: World Tile Map: Why and How
- Li-Lun Tu:《Tableau 進階》網格圖 (Trellis Chart) 手把手教學! | 應用進階表計算 (Table Calculation) 製作客製化圖表 | Ep.41
- Deepak Holla:
- Johan de Groot:
Team Tableau Content
- Download the Tableau Conference 2025 mobile app!
- Don’t forget to pack your headphones and come with a fully charged mobile device. Some Theater and Breakout sessions will require Live Session Audio.
- Sign up to stream the Tableau Conference 2025 - Main Keynote live!
- LinkedIn or Salesforce+ on April 15 at 10 a.m. PT.
- Tableau 2025.1 is now available!
- The Agenda Builder for Tableau Conference #TC25 is live!
- Personalize your conference experience by adding sessions to your schedule. New to TC this year, attendees can reserve seats in session types including breakouts, hands-on trainings, and roundtables.
Visualizations
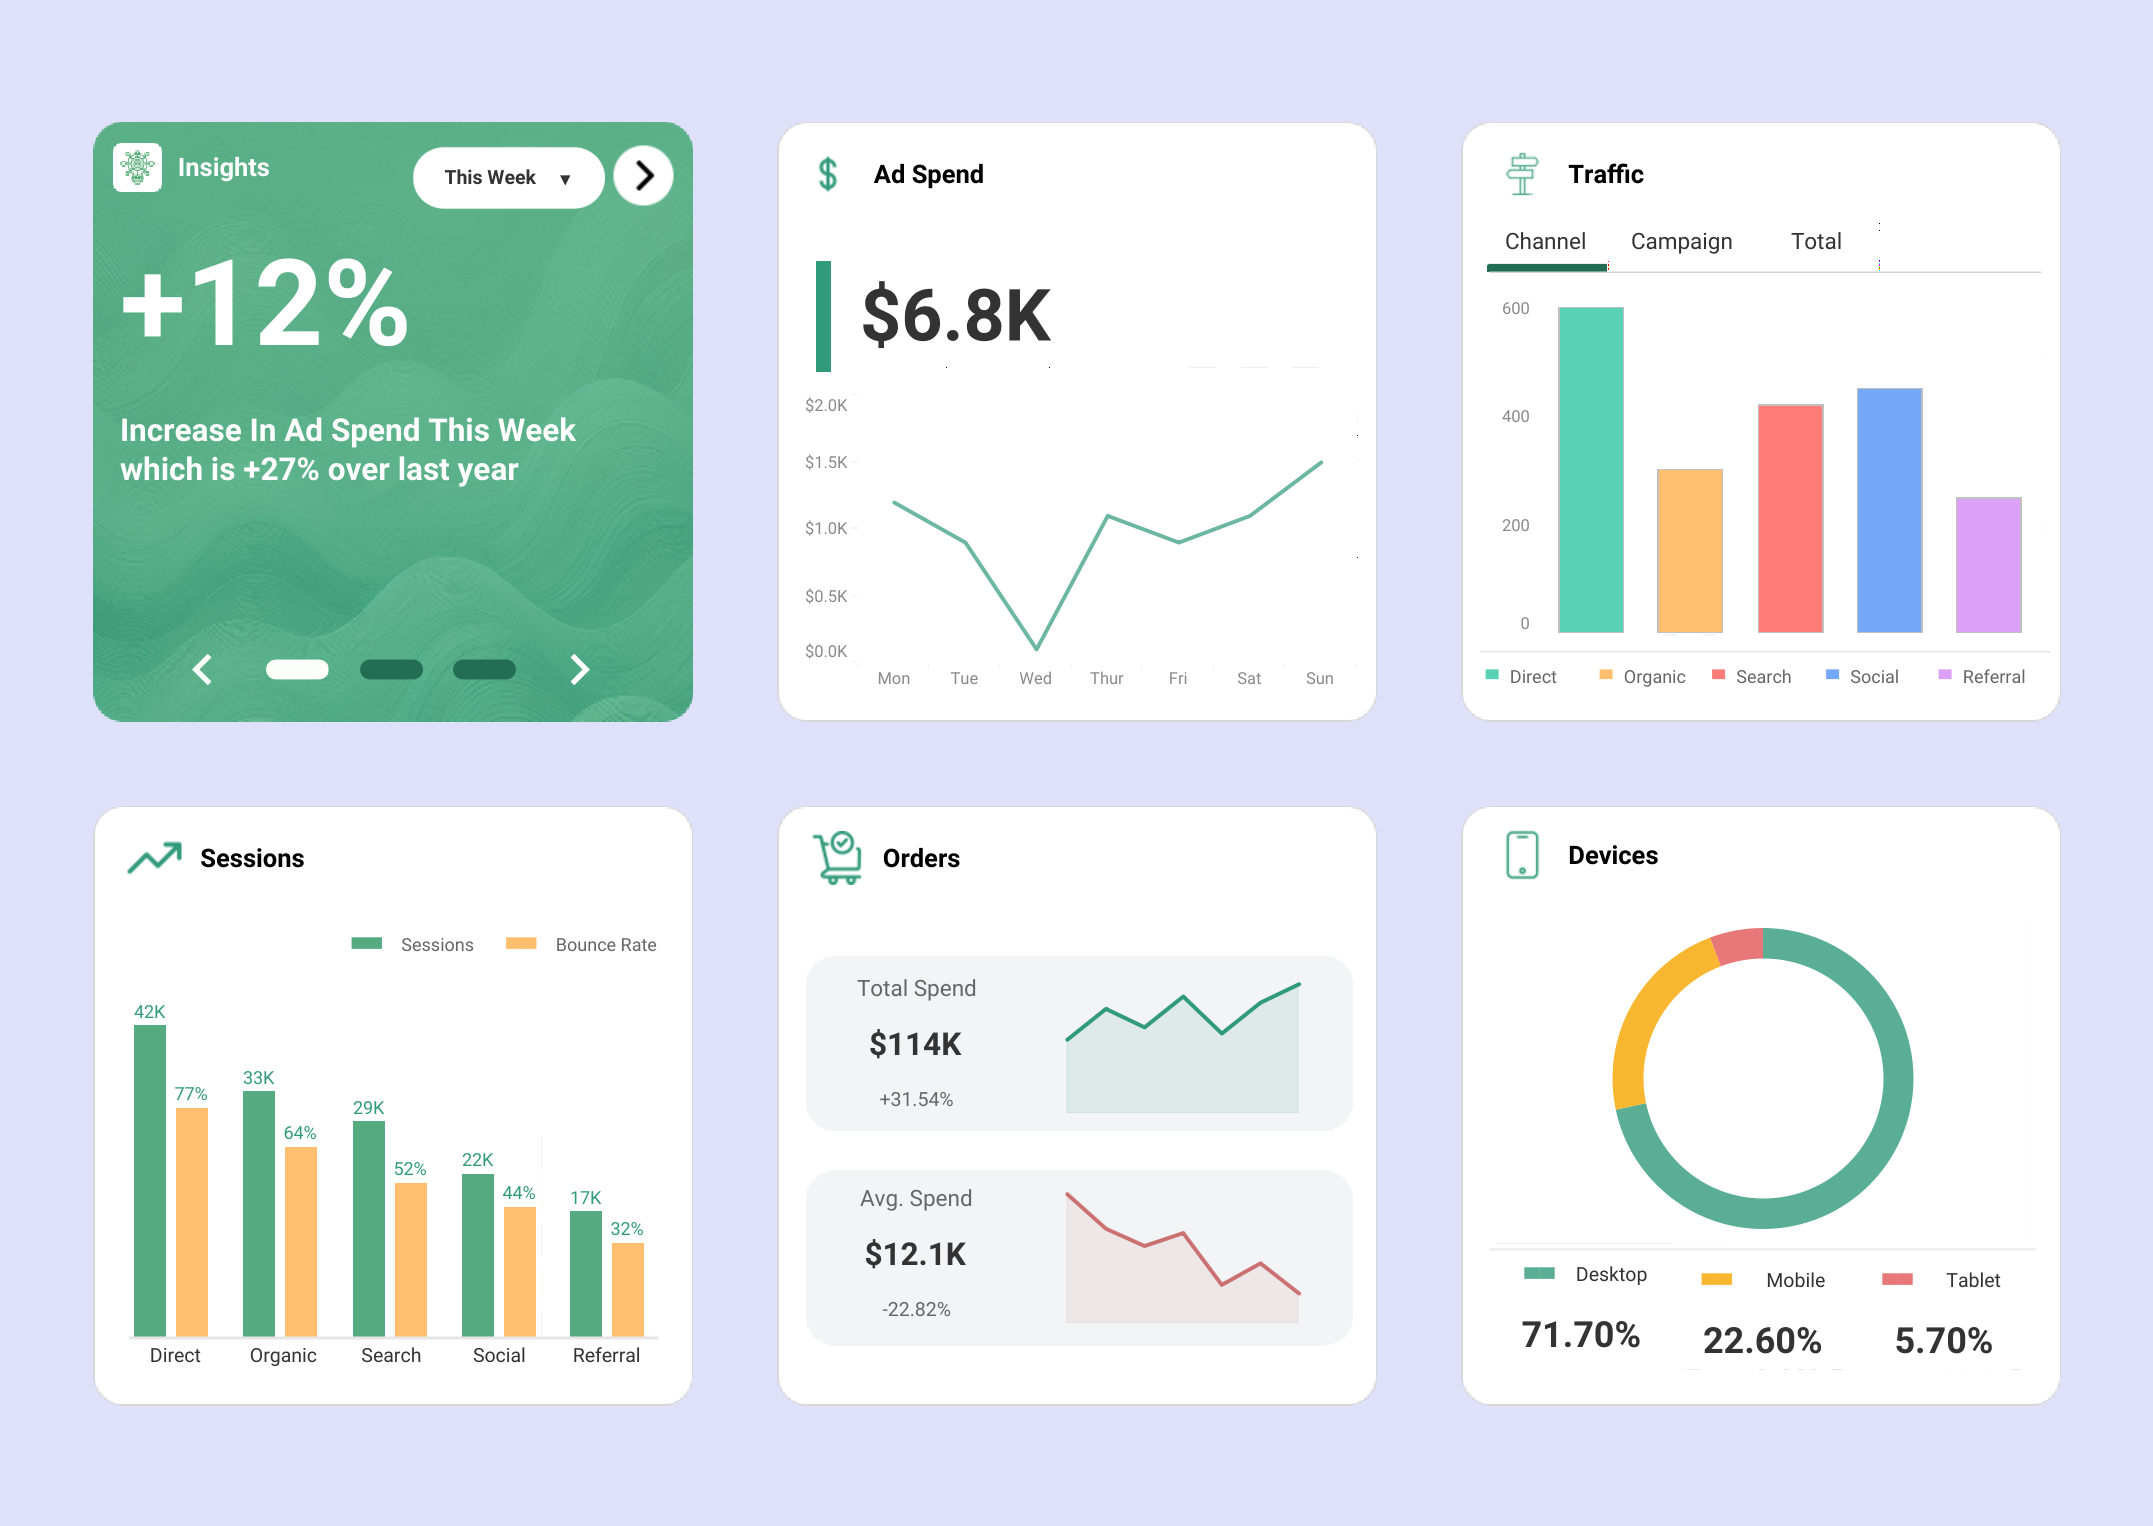
Hazem Elseify: Marketing Campaign Dashboard
See the latest Viz of the Day, trending vizzes, featured authors, and more on Tableau Public.
Check out some inspirational vizzes created by the community:
- Nicole Klassen: Employee Engagement Workbook
- Danny Bradley: Where Your Tax Goes
- Rebecca Passman: Serendipitous Run-ins
- Rob Taylor: Tableau Public Easter Egg Hunt 2025
- Deepak Holla: 8 Possible Ways to Visualize Composition Part-to-Whole in Tableau
- Shangruff Raina: WHICH U.S. STATES TRADE THE MOST WITH MEXICO?
Community Projects
Back 2 Viz Basics
A bi-weekly project helping those who are newer in the community and just starting out with Tableau. Not limited just to newbies!
Web: Back 2 Viz Basics
X: #B2VB
Workout Wednesday
Build your skills with a weekly challenge to re-create an interactive data visualization.
Web: Workout Wednesday
X: #WOW2022
Preppin' Data
A weekly challenge to help you learn to prepare data and use Tableau Prep.
Web: Preppin’ Data
X: #PreppinData
Makeover Monday
Create business dashboards using provided data sets for various industries and departments.
Web: Makeover Monday
X: #MakeoverMonday
Visual Climate
Collaborate and share climate data.
Web: Visual Climate
X: #VisualClimate
DataFam Con
A monthly challenge covering pop culture and fandoms.
Web: DataFam Con
X: #DataFamCon
EduVizzers
A monthly project connecting real education data with real people.
Web: Eduvizzers
Viz for Social Good
Volunteer to design data visualizations that help nonprofits harness the power of data for social change.
Web: Viz for Social Good
X: #VizforSocialGood
Games Night Viz
A monthly project focusing on using data from your favorite games.
Web: Games Nights Viz
X: #GamesNightViz
Iron Quest
Practice data sourcing, preparation, and visualization skills in a themed monthly challenge.
Web: Iron Quest
X: #IronQuest
Storytelling with Data
Practice data visualization and storytelling skills by participating in monthly challenges and exercises.
Web: Storytelling with Data
X: #SWDChallenge
Project Health Viz
Uncover new stories by visualizing healthcare data sets provided each month.
Web: Project Health Viz
X: #ProjectHealthViz
Diversity in Data
An initiative centered around diversity, equity & awareness by visualizing provided datasets each month.
Web: Diversity in Data
X: #DiversityinData
Sports Viz Sunday
Create and share data visualizations using rich, sports-themed data sets in a monthly challenge.
Web: Sports Viz Sunday
X: #SportsVizSunday
Real World Fake Data
Create business dashboards using provided data sets for various industries and departments.
Web: Real World Fake Data
X: #RWFD
Data Plus Music
A monthly project visualizing the data behind the music we love!
Web: Data Plus Music
X: #DataPlusMusic
関連ストーリー

DataFam Roundup: April 7-11, 2025

Meet 2025 Iron Viz Finalist Bo McCready
 2025/04/08

Meet 2025 Iron Viz Finalist Kathryn McCrindle
2025/04/06
Subscribe to our blog
Tableau の最新情報をメールでお知らせします