DataFam Roundup: October 14-18, 2024


Welcome! Dig into this week's DataFam Roundup—a weekly blog that brings together community content all in one post. As always, we invite you to send us your content—and the DataFam content from your peers that have inspired you! Find the content submission form here.
Community Highlight
To recognize new and consistent Tableau contributors—we’re excited to have a section within the weekly DataFam Roundup called the Tableau Community Highlight. Find out how to get involved.
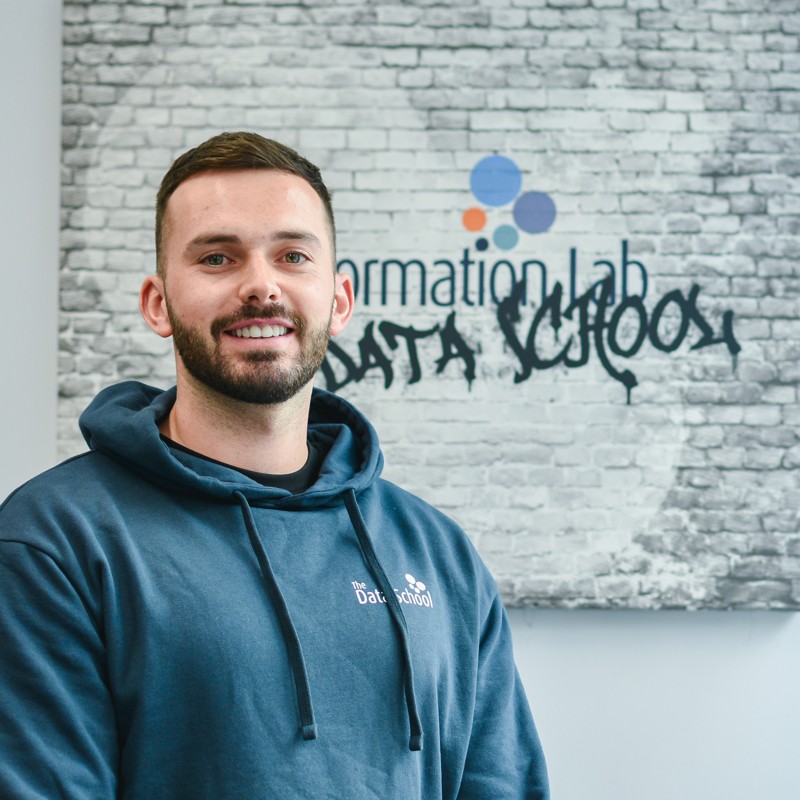
Dan Wade, Data Analytics Consultant
United Kingdom
Dan Wade is a Data Analytics Consultant and uses Tableau outside of work to create sports visualizations. After graduating with his master’s degree, Dan joined a genomics research institute where he was introduced to Tableau. He was fascinated by the ease of use and signed up for a Tableau training course, which happened to be led by a Tableau Visionary. After that course, Dan found himself hooked and spent the next part of his career trying to find ways to introduce Tableau to all of the teams at his company and practice his data skills. Dan is now involved with the Tableau community through Tableau User Groups, publishing vizzes on Tableau Public, being involved with community projects, and sharing his knowledge on social media.
On Tableau Public, Dan focuses his visualizations on topics in sports. His current goal is to publish 24 visualizations in line with each of the 24 Formula 1 races on the calendar in 2024, he has published 18 so far. The emphasis on sports related vizzes has also been a way for Dan to get involved in the SportsVizSunday community and opened up opportunities for him to write guest blogs and speak to others interested in sports vizzes.
Connect with Dan on Linkedin, X, and Tableau Public.
DataFam content
Annabelle Rincon: Map Layers : bis repetita placent
Dive into content created by the Tableau Community:
- Kyle Massey: Avoiding Burnout: Don't Do What I Did!
- Jim Dehner: Shared Dimension Inventory Analysis
- Jennifer Dawes: Tableau Tiny Tip Tuesday - Effective Font Formatting
- Alexander Waleczek: Plot Twist: Navigating Change
- Deepak Holla: Connecting to and Preparing Data: Create live connections and extracts
- Adam Mico: Introducing My Upgraded Tableau Virtuoso GPT
- Annabelle Rincon: Map Layers : bis repetita placent
- てっしん (@tesshin_tableau): Tableau2024.3新機能 Viz拡張機能「Tableau Table」を使ってみた
Team Tableau content
- Data Literacy Basics Everyone Should Know
- How To Spot Misleading Charts: Know the Source
- Featured Authors: 2024 Hispanic Heritage Month Edition
- Advocacy Through Human-Centered Data Visualization
Upcoming events and community participation
-
Data Literacy Basics You Can Use Today Virtual Event - Data literacy isn’t just for experts, it’s a skill we all need. With information everywhere, understanding how to use it is key. Join us as we break it down into simple steps you can start using right away.
- #IronViz Feedback Initiative is now live! Supported by 20 #Tableau Community leaders, we're offering Iron Viz feedback via 30-minute calls, as well as written feedback!
- Dreamin' in Data Dreamin’ in Data is the first Salesforce Community Conference purpose-built to help showcase the entire journey of your organization’s data, from Salesforce (your CRM), through integrations with other applications (using MuleSoft), and finally to analysis and determining the story your data is telling (using Tableau) – ultimately to help your organization make smarter decisions faster and stay ahead of your competition.
- Mark your calendars and join the Data Book Club as we explore, Chart Spark by Alli Torban, and the book's key themes and practical applications in our professional and personal lives. We will be meeting virtually starting August 2nd at 11am CT, but we also have a Slack space to discuss the book asynchronously as well as share notes, ideas, and resources!
- CRM Analytics Community Office Hours! Have CRM Analytics questions? Want to know how to work with data? Want to learn something new? Have visualization ideas you want to share or need feedback on? Want to just hang out with a bunch of us? Come join us (virtual)!
- DataFam Birthday Roundup! In the effort of continuing support for one another, we thought it would be fun to gather data on DataFam birthdays! If you're willing, could you let us know which day you celebrate your birthday? Just go ahead and pick the day from this year's calendar, since it's a leap year and all possible days are available to choose from!
- Mentorship Program by the Data Visualization Society
- Women in Dataviz Virtual Coffee Breaks: Held every sixth Thursday morning and every sixth Wednesday afternoon in the EST time zone, Virtual Coffee Breaks are a casual networking event. Feel free to drop in and out as you need toduring the hour, and stay for as little time or as long as you want.
Visualizations
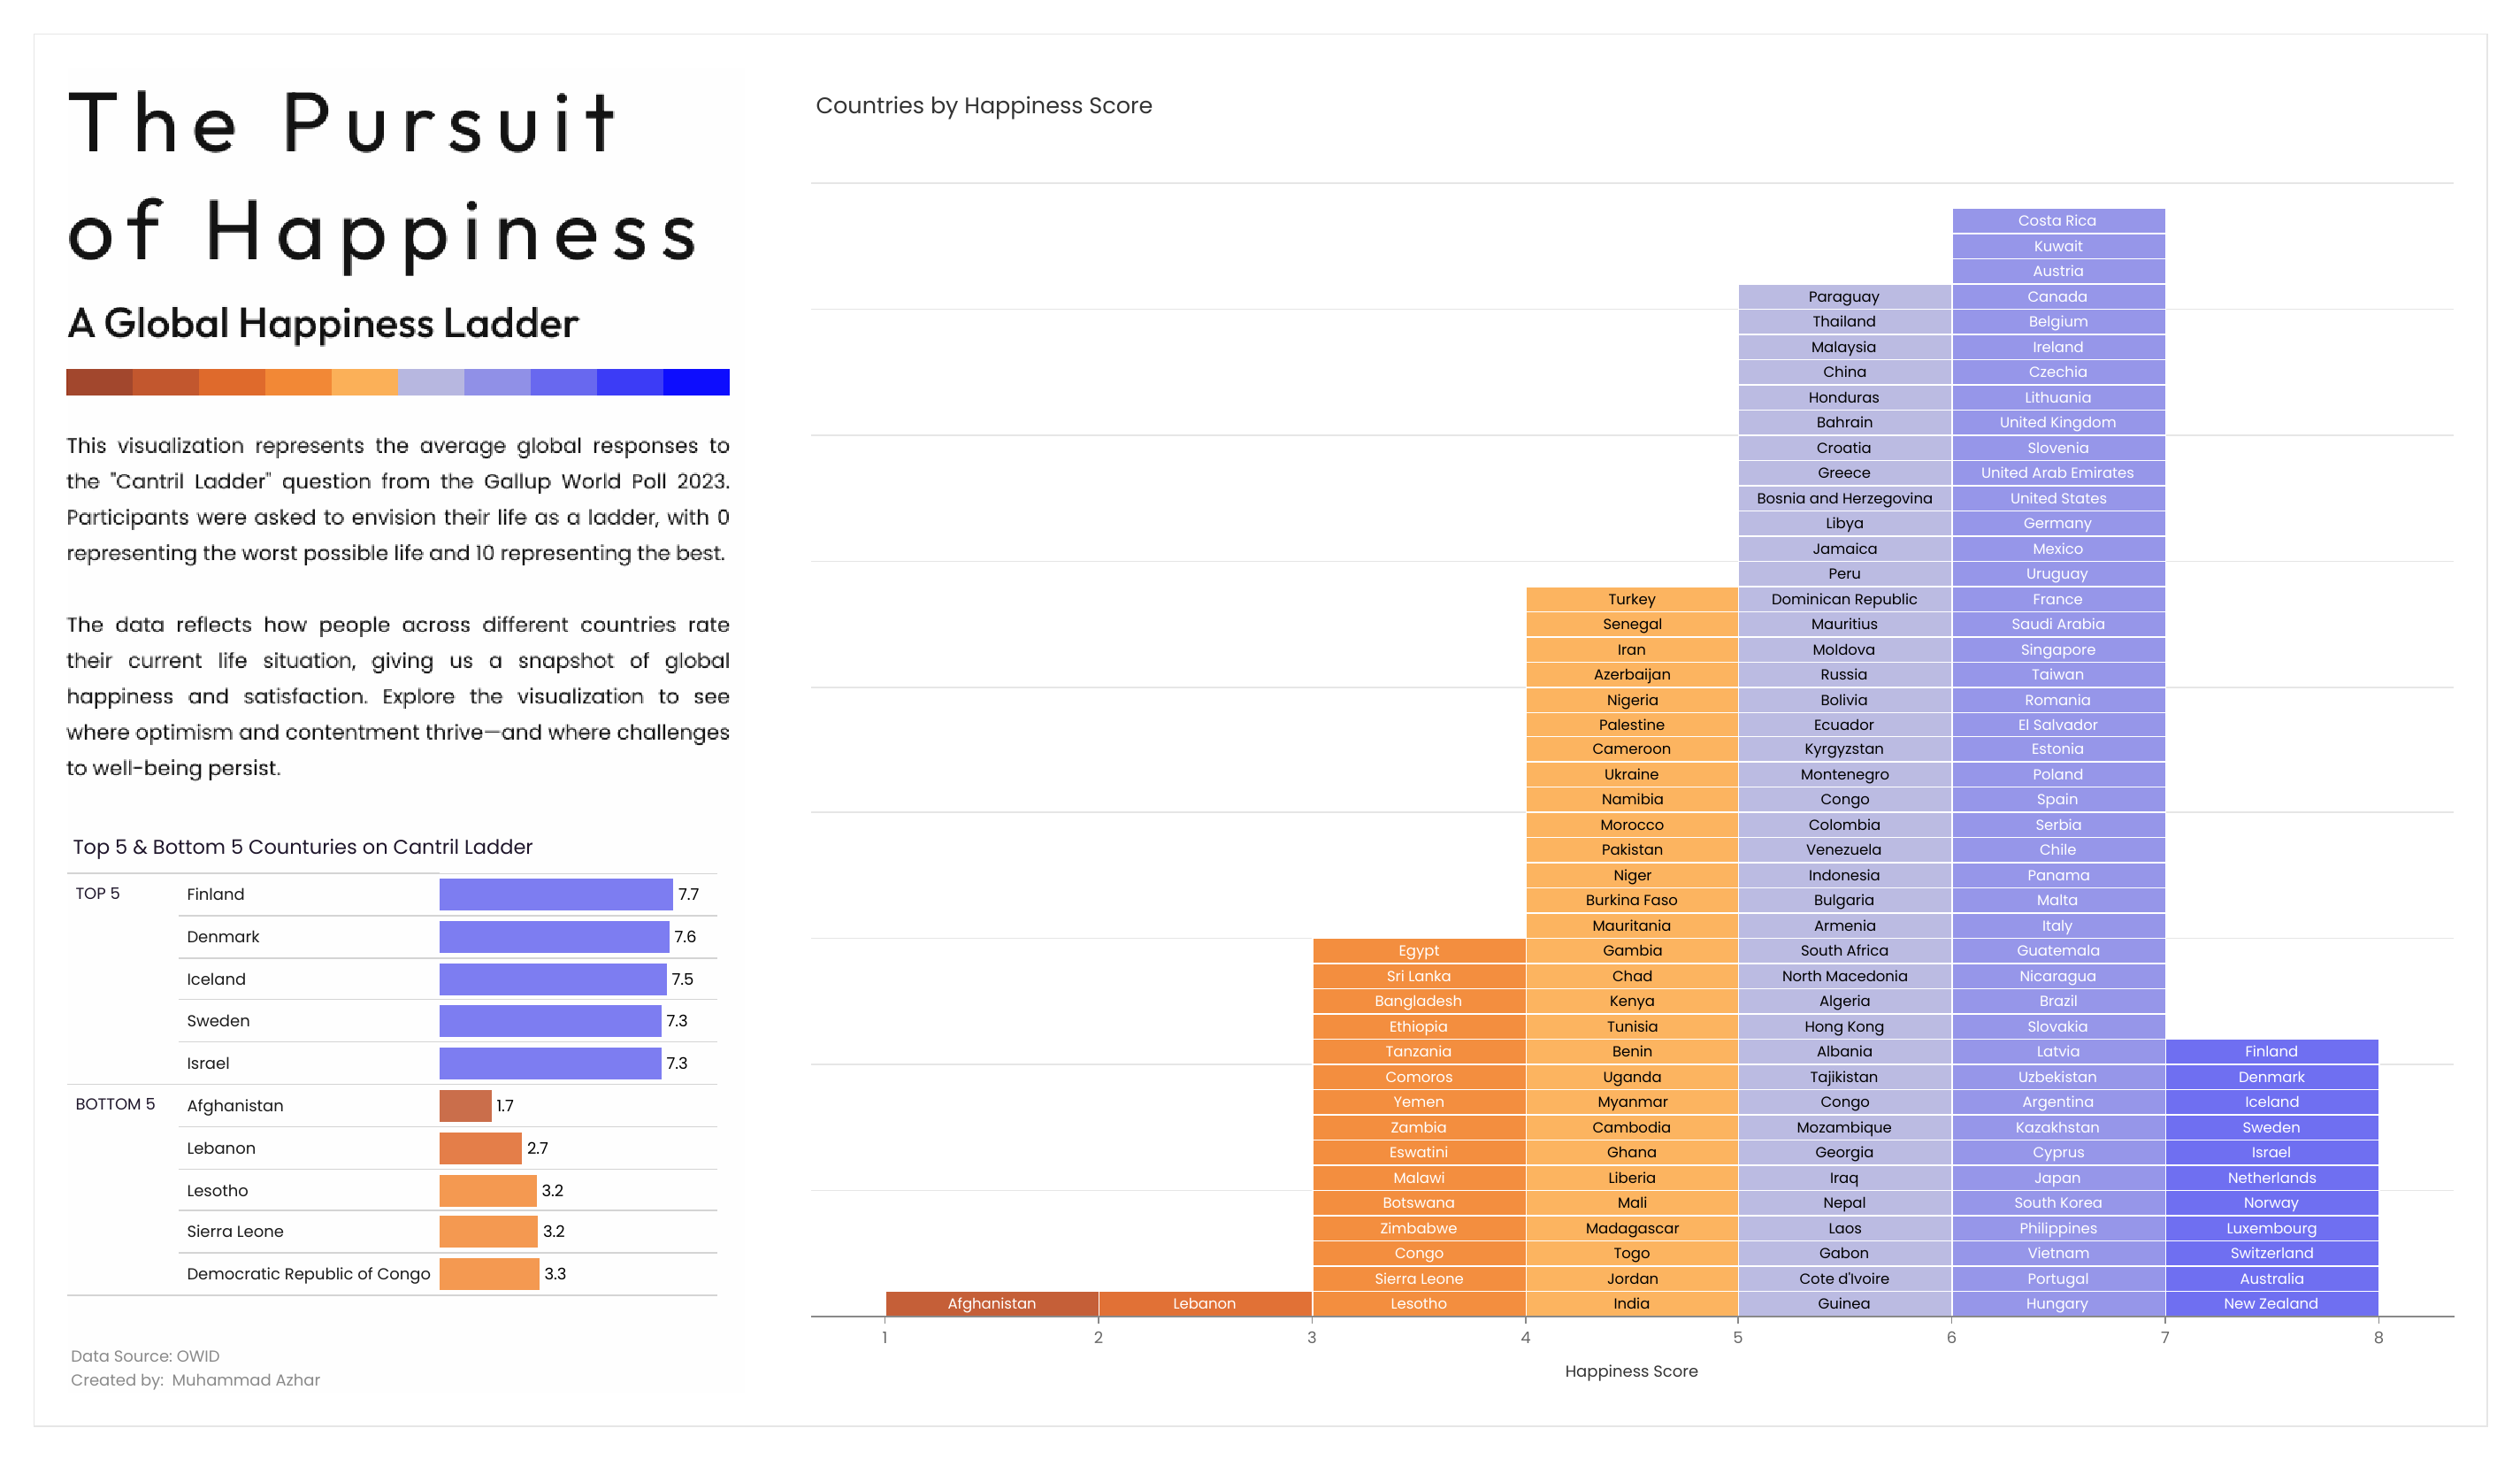
Muhammad Azhar: The Pursuit of Happiness - 2
See the latest Viz of the Day, trending vizzes, featured authors, and more on Tableau Public.
Check out some inspirational vizzes created by the community:
- Prasann Prem: The Shift of Voters in Wisconsin
- のぞぴぴ: B2VB_2024Week16_Drop-off Status by Purchase Count
- Chie Sakaki: My Boarding Record
- Uduak Afang: Heads of State
- Omokehinde Ayodeji: Nigeria's Heads of State
- Akane Okamoto: My Tableau Journey
- Muhammad Azhar: The Pursuit of Happiness - 2
- Tamás Varga: UK Personal Well-being 2017-2023
- Victory Omovrah: Social Media Usage
Community Projects
Back 2 Viz Basics
A bi-weekly project helping those who are newer in the community and just starting out with Tableau. Not limited just to newbies!
Web: Back 2 Viz Basics
X: #B2VB
Week 20: Iron Viz Break
Workout Wednesday
Build your skills with a weekly challenge to re-create an interactive data visualization.
Web: Workout Wednesday
X: #WOW2022
Week 41: People Resource Planning
Preppin' Data
A weekly challenge to help you learn to prepare data and use Tableau Prep.
Web: Preppin’ Data
X: #PreppinData
Week 41: Forbes Highest Paid Athletes
Makeover Monday
Create business dashboards using provided data sets for various industries and departments.
Web: Makeover Monday
X: #MakeoverMonday
Week 41: Personal well-being in the UK
Visual Climate
Collaborate and share climate data.
Web: Visual Climate
X: #VisualClimate
Gender Equality_ Women Entrepreneurship Participation
DataFam Con
A monthly challenge covering pop culture and fandoms.
Web: DataFam Con
X: #DataFamCon
September 2024: Live Long and Prosper with Star Trek
EduVizzers
A monthly project connecting real education data with real people.
Web: Eduvizzers
September 2024: Global Hunger Index (GHI)
Viz for Social Good
Volunteer to design data visualizations that help nonprofits harness the power of data for social change.
Web: Viz for Social Good
X: #VizforSocialGood
Games Night Viz
A monthly project focusing on using data from your favorite games.
Web: Games Nights Viz
X: #GamesNightViz
September 2024: Press Start
Iron Quest
Practice data sourcing, preparation, and visualization skills in a themed monthly challenge.
Web: Iron Quest
X: #IronQuest
Iron Quest – Maps II
Storytelling with Data
Practice data visualization and storytelling skills by participating in monthly challenges and exercises.
Web: Storytelling with Data
X: #SWDChallenge
October 2024: trick (or treat) your tool
Project Health Viz
Uncover new stories by visualizing healthcare data sets provided each month.
Web: Project Health Viz
X: #ProjectHealthViz
Diversity in Data
An initiative centered around diversity, equity & awareness by visualizing provided datasets each month.
Web: Diversity in Data
X: #DiversityinData
Sports Viz Sunday
Create and share data visualizations using rich, sports-themed data sets in a monthly challenge.
Web: Sports Viz Sunday
X: #SportsVizSunday
Real World Fake Data
Create business dashboards using provided data sets for various industries and departments.
Web: Real World Fake Data
X: #RWFD
2024 - Admin Insights
Data Plus Music
A monthly project visualizing the data behind the music we love!
Web: Data Plus Music
X: #DataPlusMusic
Autres sujets pertinents

DataFam Roundup: February 17-21, 2025

DataFam Roundup: February 10-14, 2025

Announcing the 2025 Tableau Visionaries
 13 février, 2025
Abonnez-vous à notre blog
Recevez toute l'actualité de Tableau.