DataFam Roundup: August 5–9, 2024


Welcome! Dig into this week's DataFam Roundup—a weekly blog that brings together community content all in one post. As always, we invite you to send us your content—and the DataFam content from your peers that have inspired you! Find the content submission form here.
Community Highlight
To recognize new and consistent Tableau contributors—we’re excited to have a section within the weekly DataFam Roundup called the Tableau Community Highlight. Find out how to get involved.

Anne-Sophie Pereira, Strategic Insights Analyst at Linkedin
London, United Kingdom
Anne-Sophie is a Strategic Insights Analyst at Linkedin. She uses Tableau professionally to create internal dashboards and analyze raw data and personally, using Tableau Public to craft visual narratives on subjects she is enthusiastic about including music, television series, video games, musical theater, and the Eurovision Song Contest.
On her website, Anne-Sophie writes blog posts to share how she creates her data pieces. Some examples of the blogs published are a walk through of her famous Ted Lasso Pop Culture References viz and how she created her viz on the EuroVision Song Contest. Anne-Sophie also shares her knowledge through speaking engagements, her most recent being a feature of her Ted Lasso viz at a Data+Women event.
Connect with Anne-Sophie on Linkedin, X, Tableau Public, and on her blog.
DataFam content
Dive into content created by the Tableau Community:
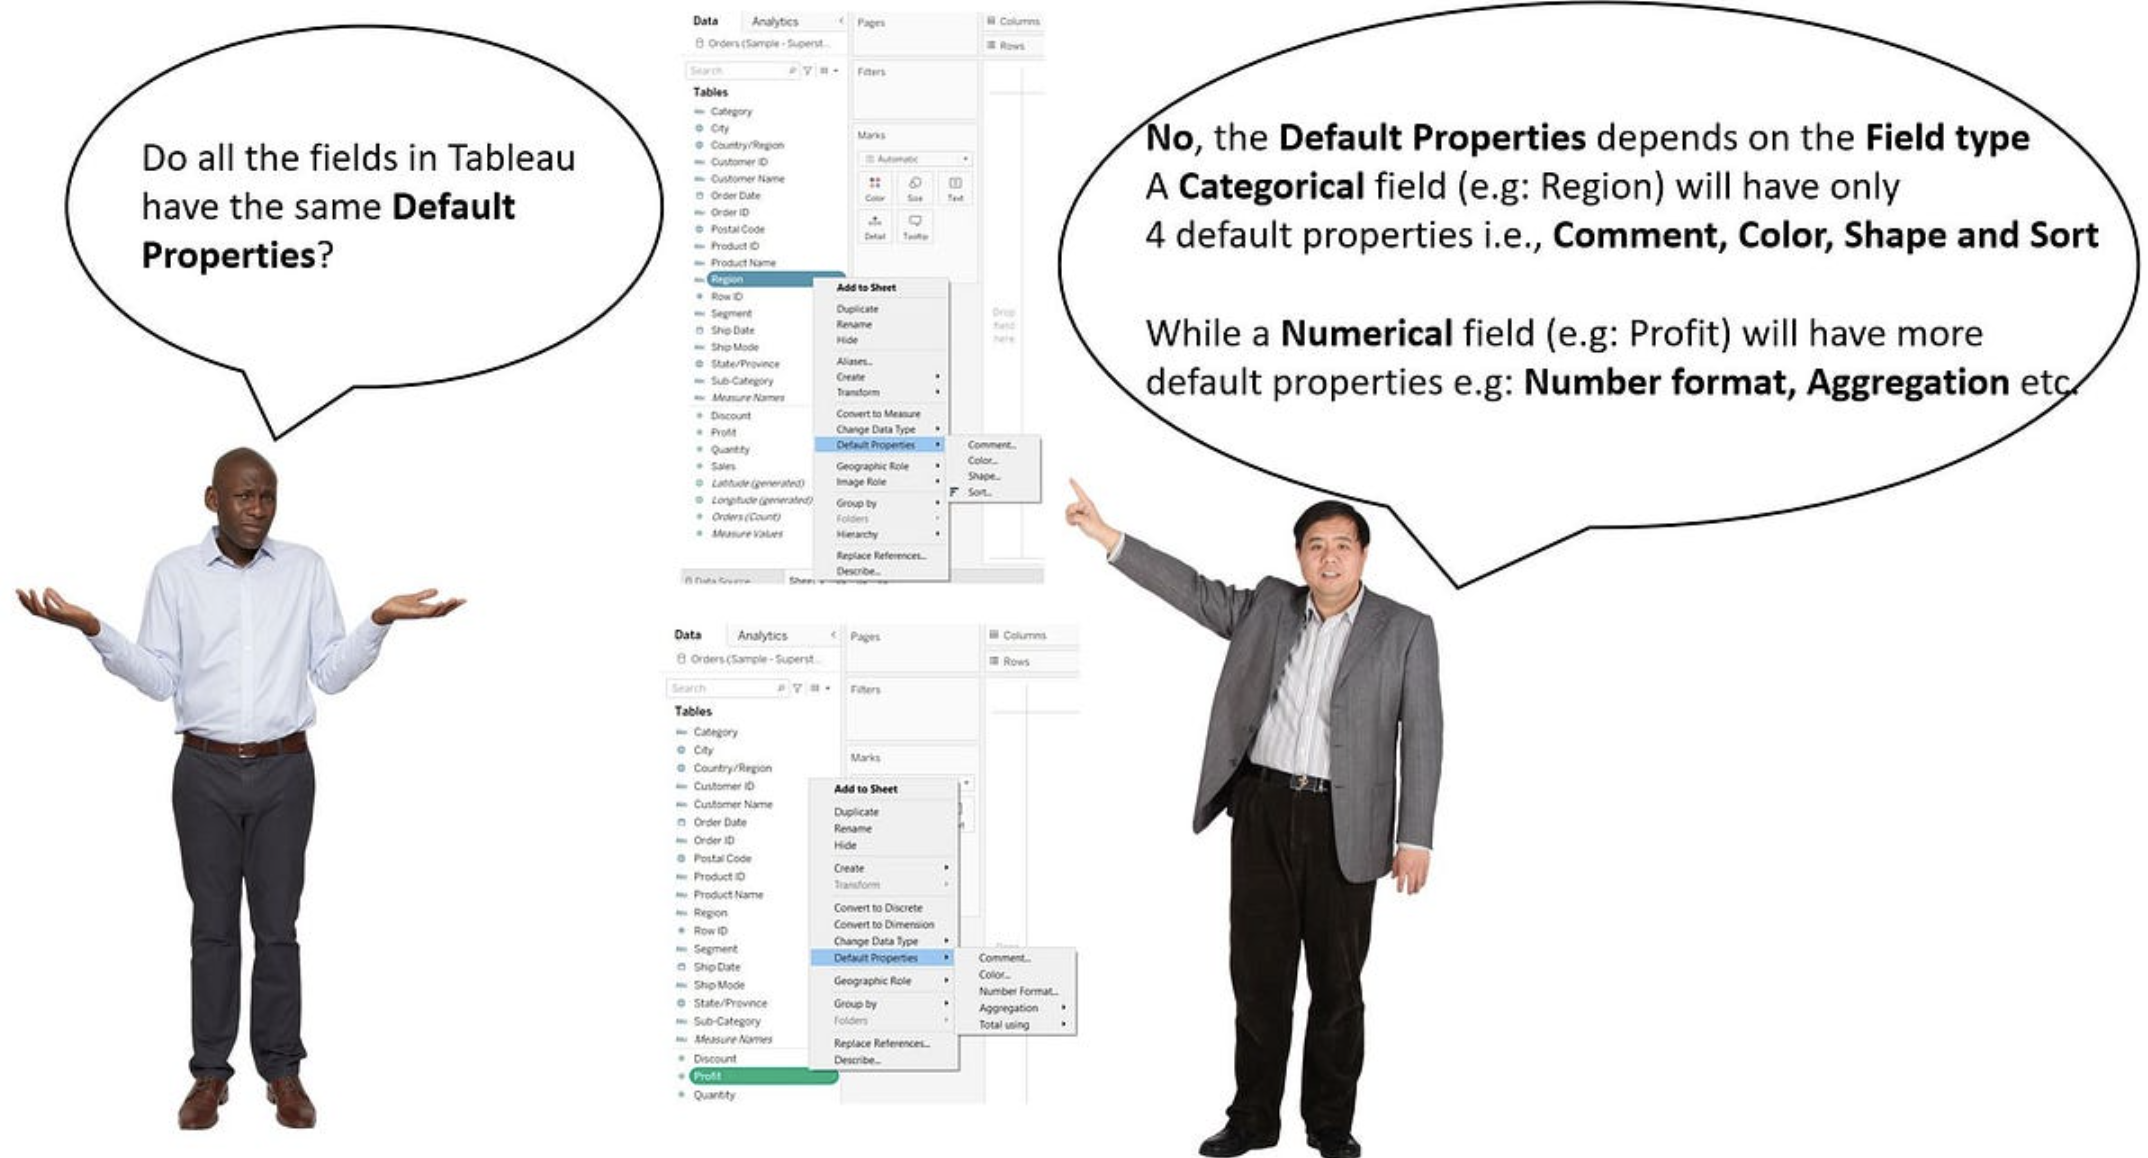
Deepak Holla: Significance of Default Properties and how they vary based on the Field type in Tableau Desktop
- Data Viz Canvas: Tableau
Centralised Row Level Security - Jared Flow: Join me in this series! I will explain step by step what I would do if I was starting from square one and wanted to break into the field of data consulting
- Dawn Harrington: Data Leaders Podcast
- The Flerlage Twins: Detailed vs Summary Tables: Why Not Both?
- Anastasiya Kuznetsova: DataViz 101: Key Principles for Crafting Clear Dashboards
- CJ Mayes: Sports Viz Sunday July 2024
- Sekou Tyler, Ten Minute Tuesday: Kim Tricker Networking
- Eric Balash, Elisa Davis, Shreya Arya: B2VB Tips
- Deepak Holla: Significance of Default Properties and how they vary based on the Field type in Tableau Desktop
- Kyle Massey: VizQL Data Service from Tableau: Use Your Data, Your Way
- 杉山愛: #1日1Tableau よくある質問集|杉山愛
- Zach Bowders: Data + Love = Inspiration, Evolution, and Elevated Thinking with Andy Kirk by Data + Love
- Data Leadership Collaborative: Building Data Culture in Italy – and 5 Best Practices to Build One Anywhere
Team Tableau
- Iron Viz 2024: Behind the Build featuring Chris Westlake
- Iron Viz 2024: Behind the Build featuring Pata Gogová
- Iron Viz 2024: Behind the Build featuring Jessica Moon
- Authors available for hire on Tableau Public
- 5 Tips from a Data Career Mentor
- Winning with Tableau: Paul Ross’s Tips from Beginner to Iron Viz Champion
- Extend Your Visual Analytics with Tableau Viz Extensions
Upcoming events and community participation
- Innovation Preview: The Future of Tableau Join Tableau on August 15 for a must-watch virtual event, and see how Tableau is building the future of data and analytics
- Dreamin' in Data Dreamin’ in Data is the first Salesforce Community Conference purpose-built to help showcase the entire journey of your organization’s data, from Salesforce (your CRM), through integrations with other applications (using MuleSoft), and finally to analysis and determining the story your data is telling (using Tableau) – ultimately to help your organization make smarter decisions faster and stay ahead of your competition.
- Mark your calendars and join the Data Book Club as we explore, Chart Spark by Alli Torban, and the book's key themes and practical applications in our professional and personal lives. We will be meeting virtually starting August 2nd at 11am CT, but we also have a Slack space to discuss the book asynchronously as well as share notes, ideas, and resources!
- Contest Announcement with the AI + Tableau User Group: Create our Logo and Banner with AI! We’re excited to announce a contest for creating a new logo and banner for our community!
- CRM Analytics Community Office Hours! Have CRM Analytics questions? Want to know how to work with data? Want to learn something new? Have visualization ideas you want to share or need feedback on? Want to just hang out with a bunch of us? Come join us (virtual)!
- Lights, Camera, Action: Tableau and IMDb Launch Data Visualization Campaign for Movie Lovers
- DataFam Birthday Roundup! In the effort of continuing support for one another, we thought it would be fun to gather data on DataFam birthdays! If you're willing, could you let us know which day you celebrate your birthday? Just go ahead and pick the day from this year's calendar, since it's a leap year and all possible days are available to choose from!
- Mentorship Program by the Data Visualization Society
- Women in Dataviz Virtual Coffee Breaks: Held every sixth Thursday morning and every sixth Wednesday afternoon in the EST time zone, Virtual Coffee Breaks are a casual networking event. Feel free to drop in and out as you need toduring the hour, and stay for as little time or as long as you want.
Vizzes
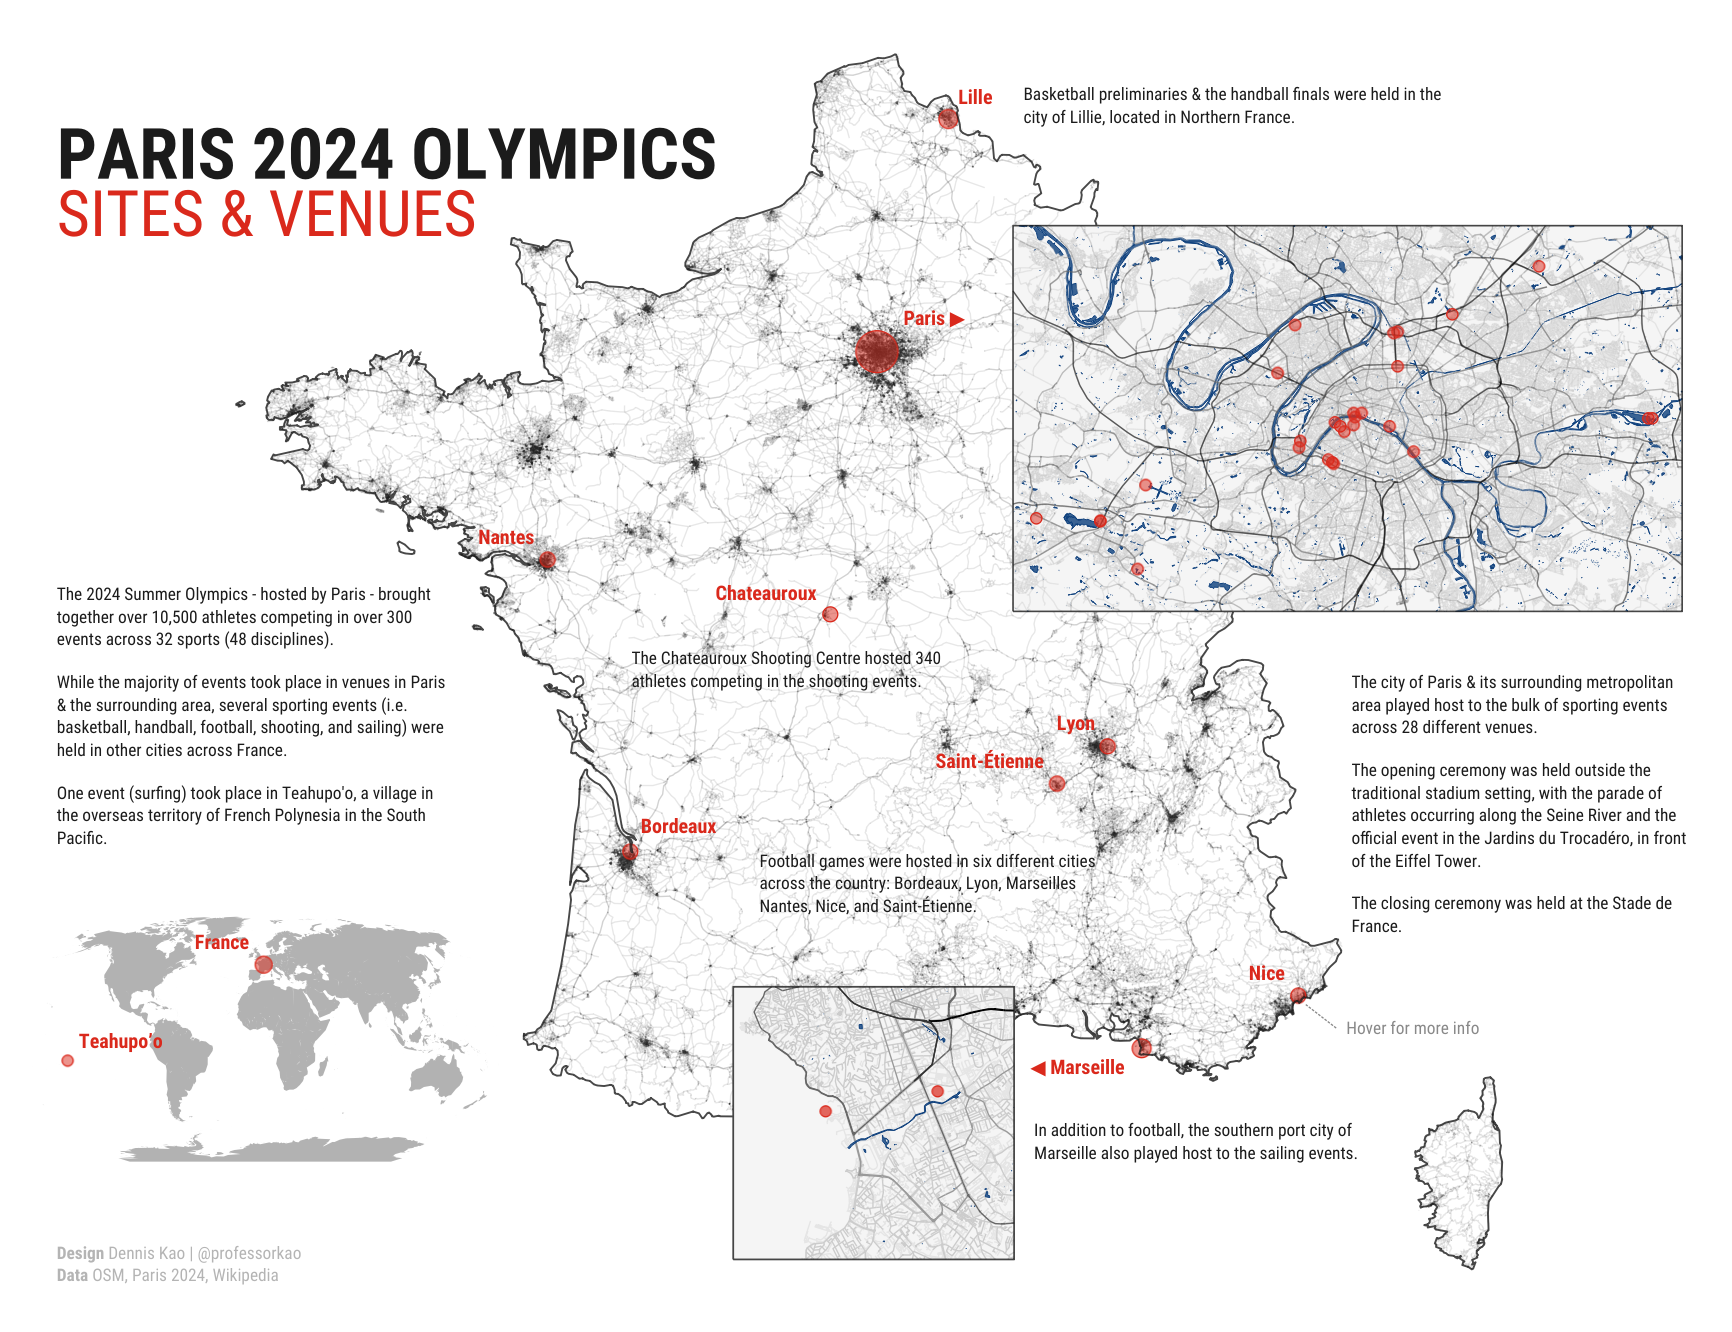
Dennis Kao: Paris 2024 Olympic Sites & Venues
See the latest Viz of the Day, trending vizzes, featured authors, and more on Tableau Public.
Check out some inspirational vizzes created by the community:
- Ray Givler: Collation Variations - When is Tableau Case-Sensitive?
-
Madeeha Amatur: US TV Viewing Trends | MakeoverMonday W30 2024
- Anna Mandoki: Summer Holidays in European Schools
- Faith Rotich: Superstore Profit
Analysis - Dennis Kao: Paris 2024 Olympic Sites & Venues
- Ant Pulley: The Top 100 Hardest Video Game Bosses
-
Brittany Rosenau: Tableau Public Profile Storage Monitor
Community Projects
Back 2 Viz Basics
A bi-weekly project helping those who are newer in the community and just starting out with Tableau. Not limited just to newbies!
Web: Back 2 Viz Basics
X: #B2VB
Week 15:Design a Landing Page
Workout Wednesday
Build your skills with a weekly challenge to re-create an interactive data visualization.
Web: Workout Wednesday
X: #WOW2022
Week 32: CRM Analytics: Dataset Filtering
Preppin' Data
A weekly challenge to help you learn to prepare data and use Tableau Prep.
Web: Preppin’ Data
X: #PreppinData
Week 32: Pokémon Card Organising
Makeover Monday
Create business dashboards using provided data sets for various industries and departments.
Web: Makeover Monday
X: #MakeoverMonday
Week 32: 2024 Paris Olympic Venue Locations
Visual Climate
Collaborate and share climate data.
Web: Visual Climate
X: #VisualClimate
Gender Equality_ Women Entrepreneurship Participation
DataFam Con
A monthly challenge covering pop culture and fandoms.
Web: DataFam Con
X: #DataFamCon
March 2024 Challenge: Sports Movies Edition
EduVizzers
A monthly project connecting real education data with real people.
Web: Eduvizzers
August 2024: Analyze Boston – Department of Innovation and Technology
Viz for Social Good
Volunteer to design data visualizations that help nonprofits harness the power of data for social change.
Web: Viz for Social Good
X: #VizforSocialGood
July 5 - 26: Future Fridays
Games Night Viz
A monthly project focusing on using data from your favorite games.
Web: Games Nights Viz
X: #GamesNightViz
Season 2: Cooking up the Spice of Data
Iron Quest
Practice data sourcing, preparation, and visualization skills in a themed monthly challenge.
Web: Iron Quest
X: #IronQuest
Iron Quest – Maps II
Storytelling with Data
Practice data visualization and storytelling skills by participating in monthly challenges and exercises.
Web: Storytelling with Data
X: #SWDChallenge
July 2024: graphing for—or with—kids
Project Health Viz
Uncover new stories by visualizing healthcare data sets provided each month.
Web: Project Health Viz
X: #ProjectHealthViz
Diversity in Data
An initiative centered around diversity, equity & awareness by visualizing provided datasets each month.
Web: Diversity in Data
X: #DiversityinData
Sports Viz Sunday
Create and share data visualizations using rich, sports-themed data sets in a monthly challenge.
Web: Sports Viz Sunday
X: #SportsVizSunday
Real World Fake Data
Create business dashboards using provided data sets for various industries and departments.
Web: Real World Fake Data
X: #RWFD
2024 - Admin Insights
Data Plus Music
A monthly project visualizing the data behind the music we love!
Web: Data Plus Music
X: #DataPlusMusic
Autres sujets pertinents

DataFam Roundup: February 24-28, 2025

DataFam Roundup: February 17-21, 2025

DataFam Roundup: February 10-14, 2025
Abonnez-vous à notre blog
Recevez toute l'actualité de Tableau.