DataFam Roundup: November 15 - 19, 2021
Dig into the latest DataFam Roundup—a weekly blog that brings together community content all in one post. As always, we invite you to send us your content—and the DataFam content from your peers that have inspired you! Find the content submission form here.
DataFam content
Sarah Bartlett, Sarah Loves Data: Tableau Conference 2021 Recap #data21
Dive into content created by the Tableau Community:
- Kevin Flerlage, The Flerlage Twins: One Calc Basic Beeswarm
- Robert Kosara, eagereyes: The Science of Pie Charts – Why We Don't Read them By Angle
- Adam Mico, Keyrus: 10 Can’t-Miss Episodes from Tableau Conference 2021
- Jason Khu, KhuZ Life: How to organise a Tableau event for University students
- Sarah Bartlett, Sarah Loves Data: Tableau Conference 2021 Recap #data21
- Ruy Aguilar and Pablo Gomez: Tableau, Episodio 1: Bienvenidos a Café con Datos (Welcome to the official launch of a podcast on data, data visualization, careers in data, Tableau and much more. Meet community members, Latinx leaders, their stories, and their learnings.)
- Jesse Mensah: SQL, Python and Tableau For Data Analytics
- Abisola Oni, DataVizAbby: My highlights from Tableau Conference 2021
- Eric Balash: Sunburst Chart Tutorial in Tableau
- Nicole Lillian Mark, SELECT * FROM data;: Recap: The 2021 Vizzies Awards at #Data21
- Jason Penrod, Playfair Data: The Definitive Guide to Buttons in Tableau
- Will Sutton: Introducing #GamesNightViz
- Priyanka Dobhal: Bring Passion into your Visualization
- Steve Wexler, Data Revelations: Decluttering by making the first row different from the other rows
- Yamil Medina, Aaron Simmons with special guests Abe Diaz, Josh Jackson, and Erik K.: 3Charts@3PM: A Mystery Chart Show | Military Episode
- Zach Bowders, Data + Love Podast episodes:
Upcoming User Group events and community participation
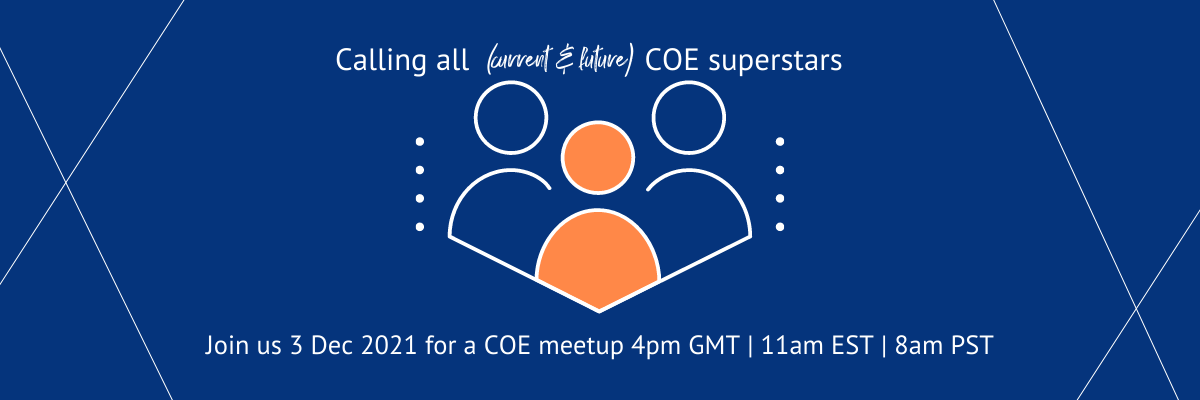
- Calling all (current and future) COE superstars! Join the December 3, 2021 COE Meetup. Register here.
- Participate in a Community End Of Year Card Exchange.
- Stay up to date with the latest and greatest from the Tableau Community. We'll help you along in your Tableau journey, bring your data skills to the next level, and nurture powerful connections.
- Final voting is now open for the 2021 Data Literacy Awards
Upcoming Tableau User Group events:
- Adelaide Tableau User Group - Catch a live build of a recent VOTD from Azad Jivani and learn more using Tableau's APIs to automate common flows.
- Data + Women Netherlands meetup - Join women (and allies) working in data across the Netherlands for a presentation on driving tableau adoption across your organizations to ensure that your data strategy thrives.
- Lithuania Tableau User Group (in-person) - Connect with local Tableau users and hear more about diagonal buffers and taming your dashboard colors. Plus, catch 10 Tableau tips in 10 minutes.
Vizzes
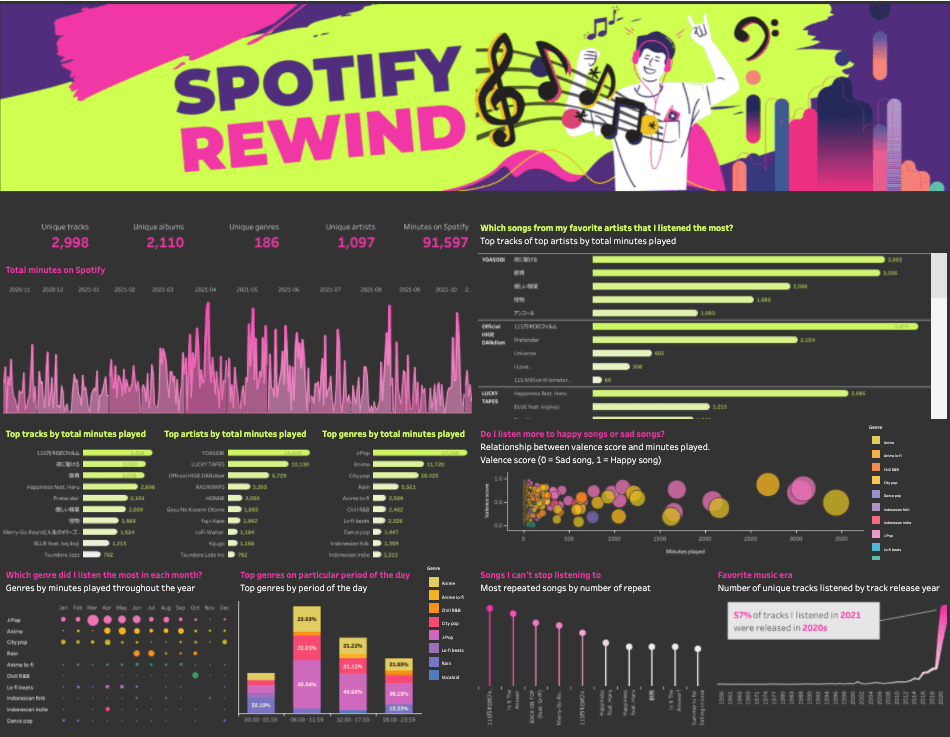
Hutami Nadya: Spotify Rewind 2021
Catch this week’s Viz of the Days here and subscribe to get them emailed directly to your inbox.
Check out some inspirational vizzes created by the community:
-
Simon Evans: A Question of #SportsVizSunday Nov 21 Challenge
-
Hutami Nadya: Spotify Rewind 2021
-
Ant Pulley: Mr. Tickle
-
Tina Covelli: Squid Game - The Results (Spoiler Alert)
-
Luke Abraham: Distribution of Household Wealth in the US | #DiversityinData
Community Projects
Games Night Viz *NEW!
A monthly project focusing on using data from your favorite games.
Web: Games Nights Viz
Twitter: #GamesNightViz
November - December 2021: Level 1: Player Select
Workout Wednesday
Build your skills with a weekly challenge to re-create an interactive data visualization.
Web: Workout Wednesday
Twitter: #WOW2021
Week 44: Can you recreate this difference chart?
Preppin' Data
A weekly challenge to help you learn to prepare data and use Tableau Prep.
Web: Preppin’ Data
Twitter: #PreppinData
Week 41: Southend Stats
Iron Quest
Practice data sourcing, preparation, and visualization skills in a themed monthly challenge.
Web: Iron Quest
Twitter: #IronQuest
October 2021: Viz a Year or Decade
Storytelling with Data
Practice data visualization and storytelling skills by participating in monthly challenges and exercises.
Web: Storytelling with Data
Twitter: #SWDChallenge
November 2021: build a bullet graph
Project Health Viz
Uncover new stories by visualizing healthcare data sets provided each month.
Web: Project Health Viz
Twitter: #ProjectHealthViz
September 2021: Biggest Healthcare Data Breaches
Diversity in Data
An initiative centered around diversity, equity & awareness by visualizing provided datasets each month.
Web: Diversity in Data
Twitter: #DiversityinData
November - December 2021: The countdown to Christmas and New Year!
SDG Viz Project
Visualize data about Sustainable Development Goals provided by the World Health Organization.
Web: SDG Viz Project
Twitter: #TheSDGVizProject
Sports Viz Sunday
Create and share data visualizations using rich, sports-themed data sets in a monthly challenge.
Web: Sports Viz Sunday
Twitter: #SportsVizSunday
November 2021: Tableau Conference
Real World Fake Data
Create business dashboards using provided data sets for various industries and departments.
Web: Real World Fake Data
Twitter: #RWFD
Viz 2 Educate
Each month, create vizzes on global education syllabus topics as resources for teachers worldwide.
Web: Viz 2 Educate
Twitter: #Viz2educate
Viz for Social Good
Volunteer to design data visualizations that help nonprofits harness the power of data for social change.
Web: Viz for Social Good
Twitter: #VizforSocialGood
Makeover Monday
Join the community every Monday to work with a given data set and create better, more effective visualizations.
Web: Makeover Monday
Twitter: #MakeoverMonday
Articles sur des sujets connexes
Abonnez-vous à notre blog
Obtenez les dernières nouvelles de Tableau dans votre boîte de réception.


