DataFam Roundup: July 1–5, 2024


Welcome! Dig into this week's DataFam Roundup—a weekly blog that brings together community content all in one post. As always, we invite you to send us your content—and the DataFam content from your peers that have inspired you! Find the content submission form here.
Community Highlight
To recognize new and consistent Tableau contributors—we’re excited to have a section within the weekly DataFam Roundup called the Tableau Community Highlight. Find out how to get involved.

Kapil Dhiman, Consultant at Deloitte
Haryana, India
Kapil Dhiman is a Consultant at Deloitte. He was first introduced to Tableau by a colleague which sparked an immediate interest in pivoting his career to become a Tableau Developer. Kapil is committed to mastering Tableau's features and techniques, driven by the desire to leverage data effectively and contribute meaningfully in the field of data analytics. Some of the ways he stays active in the Tableau community are by creating videos on his YouTube channel, sharing Tableau content on Linkedin, and publishing vizzes on Tableau Public.
When learning Tableau, Kapil noticed a lack of free crash courses available. This inspired him to start a YouTube channel dedicated to providing comprehensive content on Tableau. Whether it's crash courses, scenario-based problem-solving, or certification series playlists, Kapil’s goal is to offer detailed guidance to anyone starting their Tableau journey. He finds it rewarding to see how his work has made complex data more accessible and actionable for others.
Connect with Kapil on Linkedin, Tableau Public, and on his YouTube channel.
DataFam content
Dive into content created by the Tableau Community:
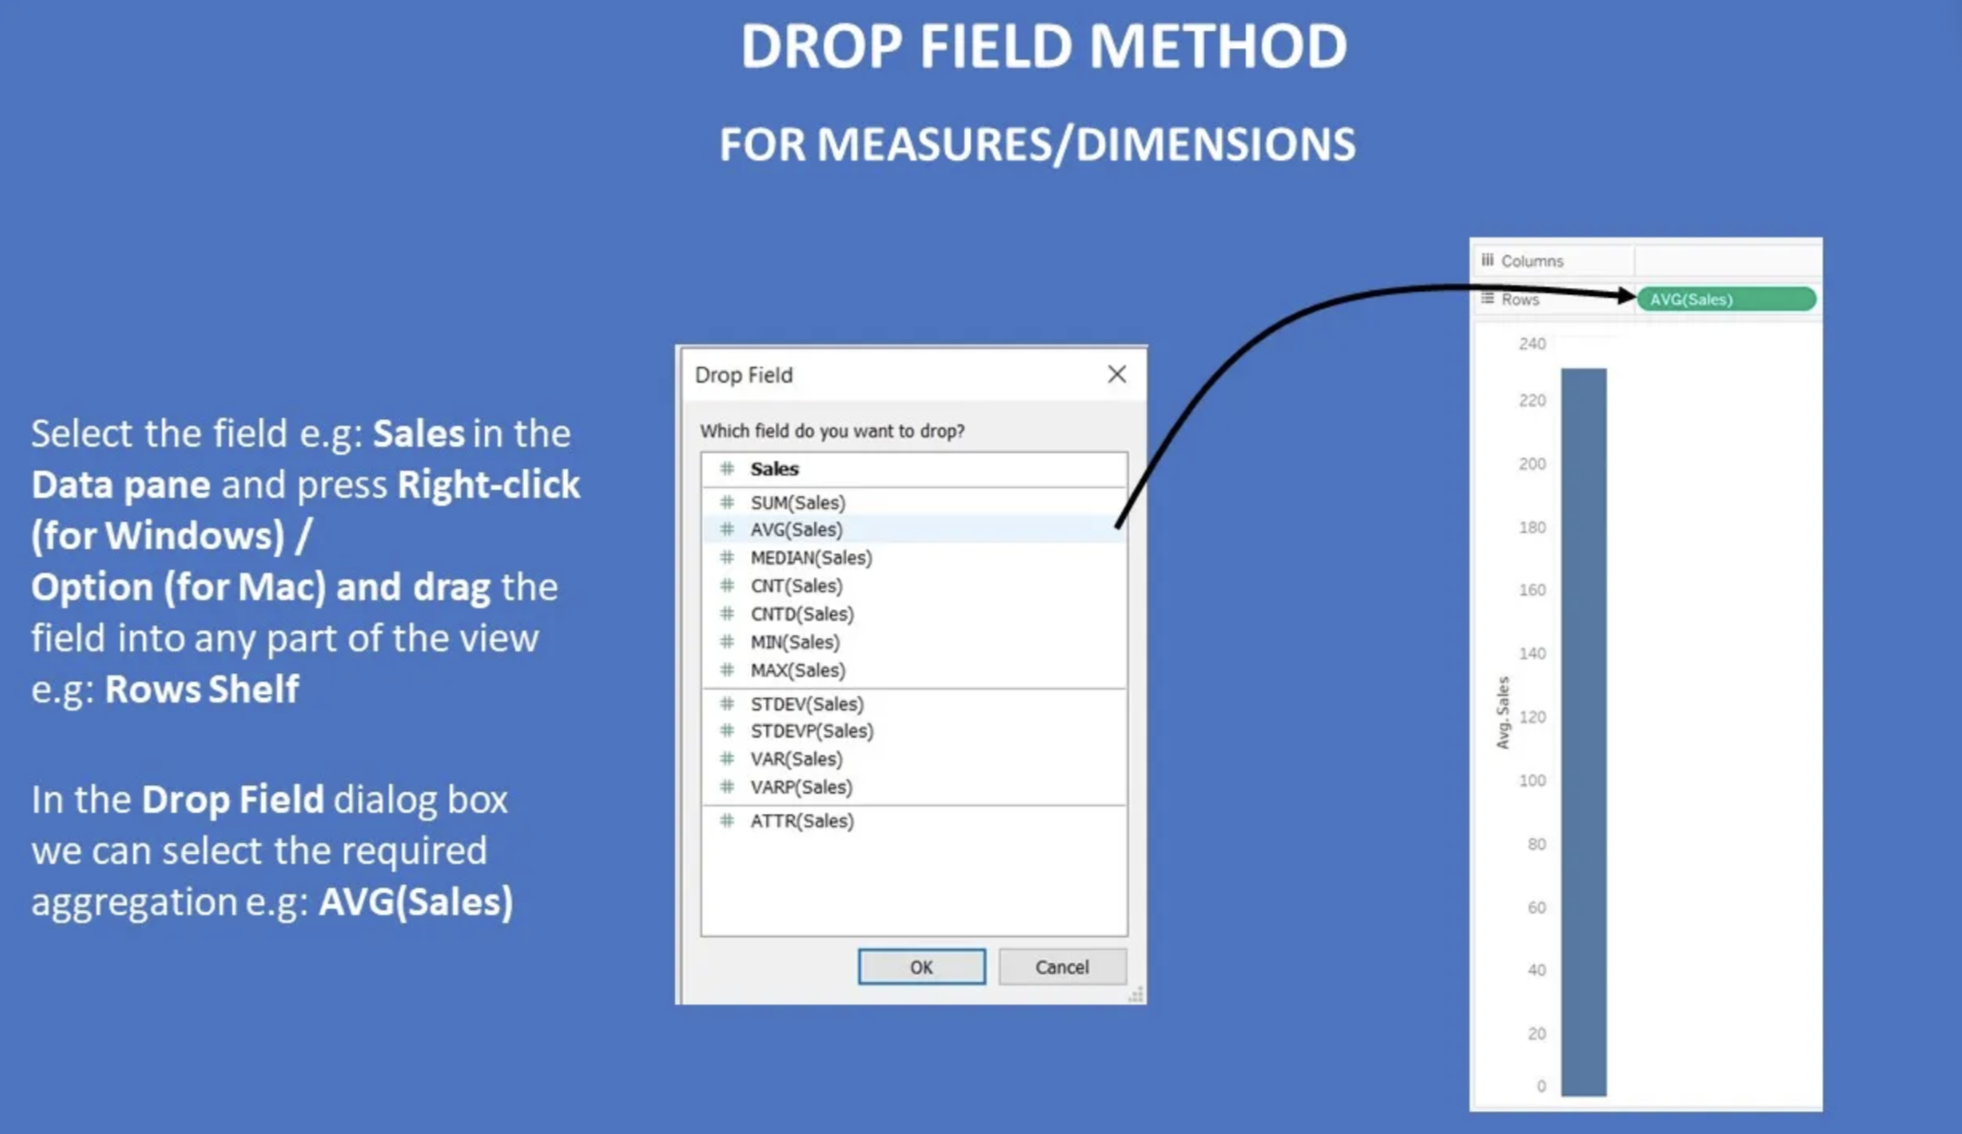
Deepak Holla: The time saving “Drop Field” method when working with Fields/Pills in Tableau Desktop
- Zach Leber: Multifocal Distance Analysis using Spatial Sets
- Joon Kim: Anatomy of a Set Action Driven Drill Down in Tableau – The Deep Dive
- Steffen Volkerding: Mastering Table Calculations - one step at a time
- Dariia Mykhailyshyna - Workshops for Ukraine
- Deepak Holla: The time saving “Drop Field” method when working with Fields/Pills in Tableau Desktop
Team Tableau
- Tableau Ambassador nominations and applications are open
- Tableau Ambassador Spotlight | Chris Monger
- Data, Diversity, and Pride: Honoring the LGBTQ+ Community on Tableau Public
- Tableau+: New Edition with Premium AI, Enterprise Capabilities, and Premier Success
- Your Questions Answered: Highlights from Q&A at Tableau Conference 2024
Upcoming events and community participation
- CRM Analytics Community Office Hours! Have CRM Analytics questions? Want to know how to work with data? Want to learn something new? Have visualization ideas you want to share or need feedback on? Want to just hang out with a bunch of us? Come join us (virtual)!
- Lights, Camera, Action: Tableau and IMDb Launch Data Visualization Campaign for Movie Lovers
- DataFam Birthday Roundup! In the effort of continuing support for one another, we thought it would be fun to gather data on DataFam birthdays! If you're willing, could you let us know which day you celebrate your birthday? Just go ahead and pick the day from this year's calendar, since it's a leap year and all possible days are available to choose from!
- Mentorship Program by the Data Visualization Society
- Women in Dataviz Virtual Coffee Breaks: Held every sixth Thursday morning and every sixth Wednesday afternoon in the EST time zone, Virtual Coffee Breaks are a casual networking event. Feel free to drop in and out as you need toduring the hour, and stay for as little time or as long as you want.
Vizzes
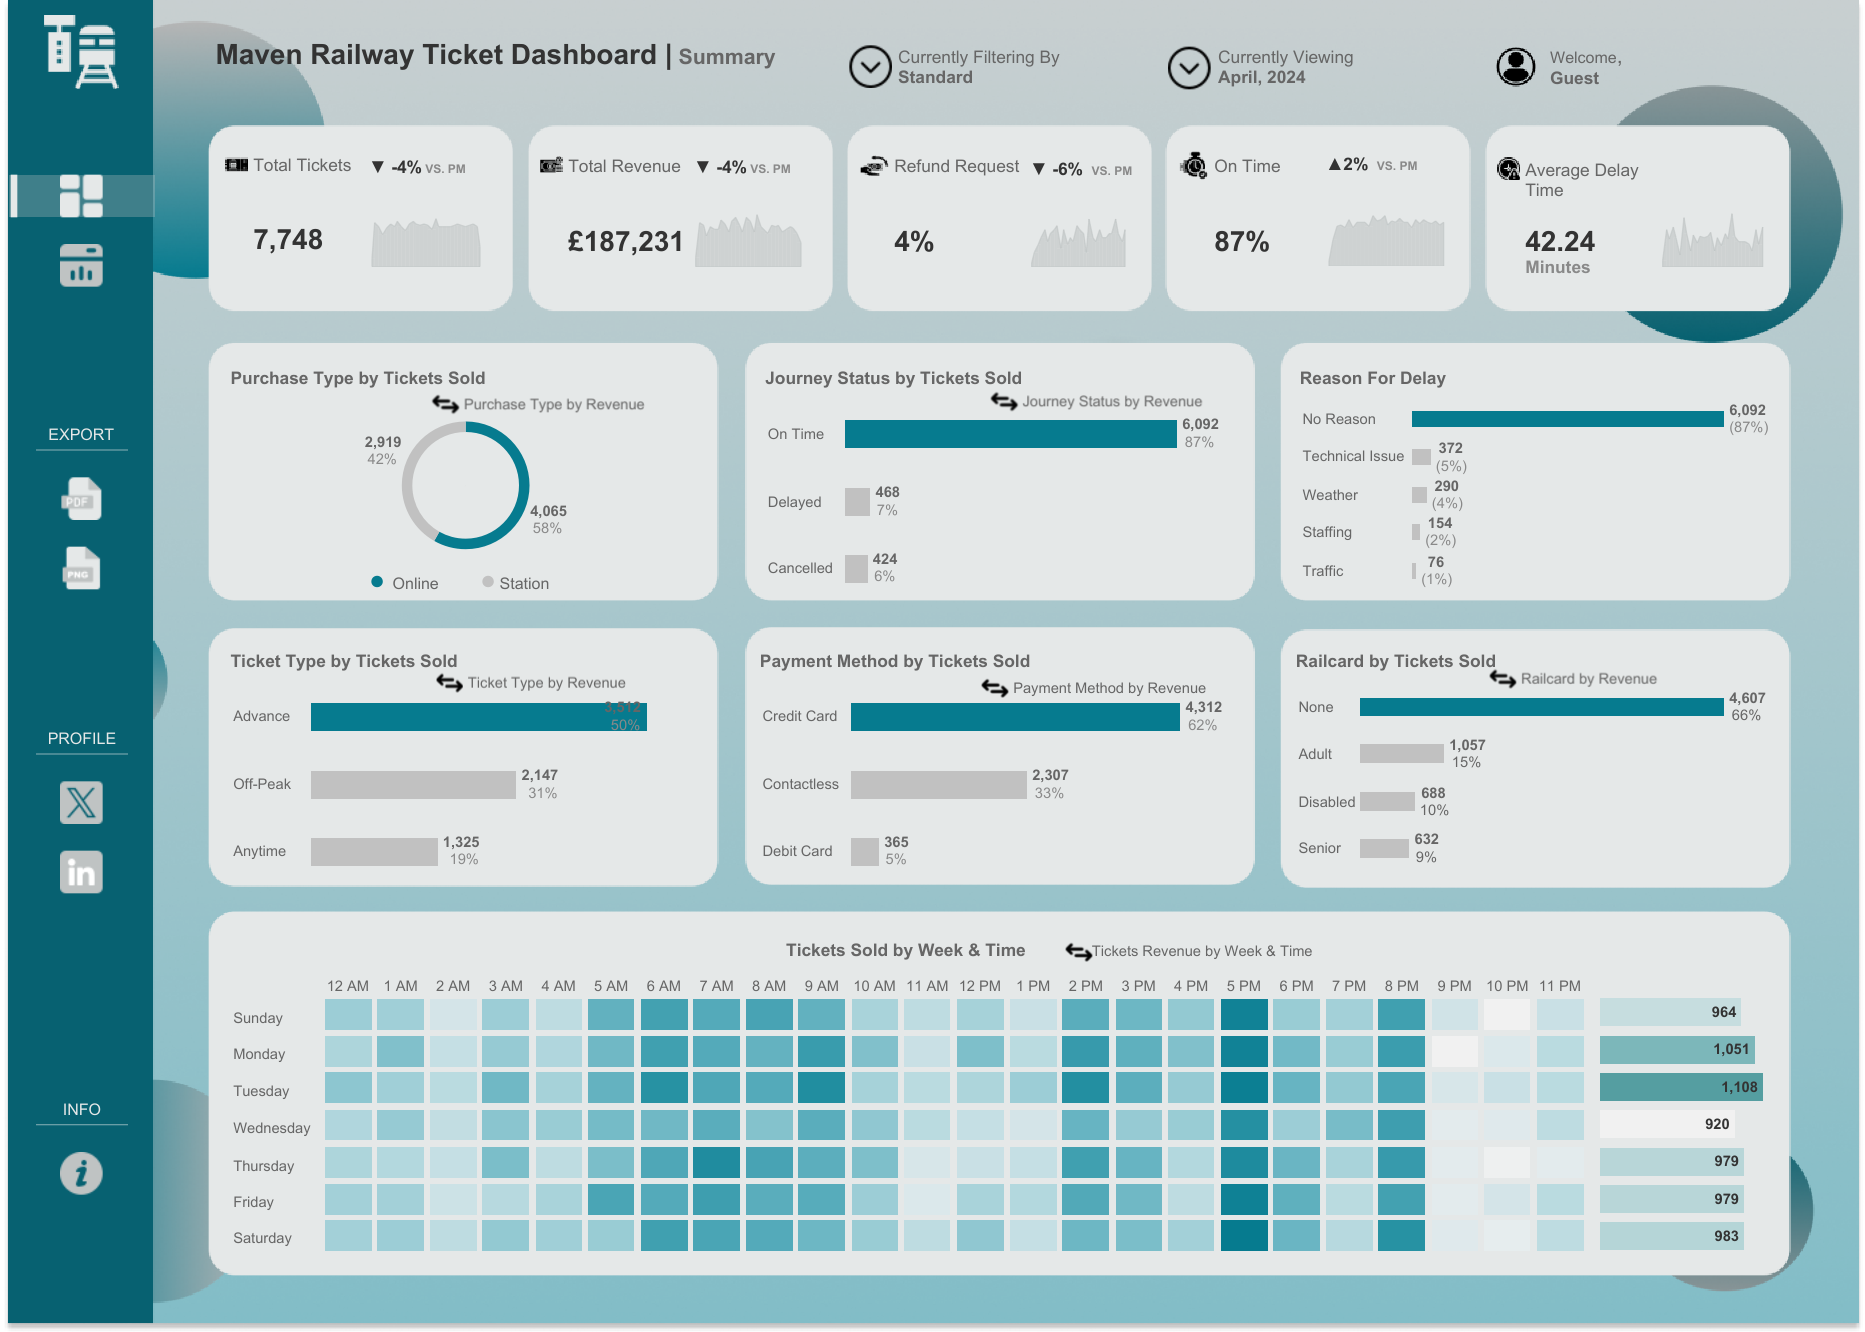
Victory Omovrah: Railway Dashboard
See the latest Viz of the Day, trending vizzes, featured authors, and more on Tableau Public.
Check out some inspirational vizzes created by the community:
- Victory Omovrah: Railway Dashboard
- Faith Rotich: Death from Natural Disasters | #Makeover Monday
- Arshi Saleh: The History of Natural Gas Production (1900 -2022) | #MakeoverMonday
- Jonathan Akpogbo Chris: Natural Gas production Around the World (1900-2022)
- Adedamola (Damola) Ladipo: EURO 2024 Group Stage Stats
- Jennifer Dawes: Historial Women in STEM
- Oluwadunsin Agbolabori: Best Places (Cities) in USA for 4th of July Celebrations in 2024
- Gbolahan Adebayo: HR Resources Dashboard
- Tamaball3: mom2024w27
- Sam Parsons: UK Election 2024
Community Projects
Back 2 Viz Basics
A bi-weekly project helping those who are newer in the community and just starting out with Tableau. Not limited just to newbies!
Web: Back 2 Viz Basics
X: #B2VB
Week 13: Build a Box & Whisker Plot
Workout Wednesday
Build your skills with a weekly challenge to re-create an interactive data visualization.
Web: Workout Wednesday
X: #WOW2022
Week 27: Can you show YTD and PYTD, whilst also being able to change the date range and switch between Month & Week?
Preppin' Data
A weekly challenge to help you learn to prepare data and use Tableau Prep.
Web: Preppin’ Data
X: #PreppinData
Week 27: Tour de France special
Makeover Monday
Create business dashboards using provided data sets for various industries and departments.
Web: Makeover Monday
X: #MakeoverMonday
Week 26: UEFA EURO 2024 - statistics & facts
DataFam Con
A monthly challenge covering pop culture and fandoms.
Web: DataFam Con
X: #DataFamCon
March 2024 Challenge: Sports Movies Edition
EduVizzers
A monthly project connecting real education data with real people.
Web: Eduvizzers
July 2024: Texas Education Agency
Viz for Social Good
Volunteer to design data visualizations that help nonprofits harness the power of data for social change.
Web: Viz for Social Good
X: #VizforSocialGood
Games Night Viz
A monthly project focusing on using data from your favorite games.
Web: Games Nights Viz
X: #GamesNightViz
Season 2: Cooking up the Spice of Data
Iron Quest
Practice data sourcing, preparation, and visualization skills in a themed monthly challenge.
Web: Iron Quest
X: #IronQuest
Women
Storytelling with Data
Practice data visualization and storytelling skills by participating in monthly challenges and exercises.
Web: Storytelling with Data
X: #SWDChallenge
July 2024: graphing for—or with—kids
Project Health Viz
Uncover new stories by visualizing healthcare data sets provided each month.
Web: Project Health Viz
X: #ProjectHealthViz
Diversity in Data
An initiative centered around diversity, equity & awareness by visualizing provided datasets each month.
Web: Diversity in Data
X: #DiversityinData
Sports Viz Sunday
Create and share data visualizations using rich, sports-themed data sets in a monthly challenge.
Web: Sports Viz Sunday
X: #SportsVizSunday
Real World Fake Data
Create business dashboards using provided data sets for various industries and departments.
Web: Real World Fake Data
X: #RWFD
2024 - Admin Insights
Data Plus Music
A monthly project visualizing the data behind the music we love!
Web: Data Plus Music
X: #DataPlusMusic
Articles sur des sujets connexes

DataFam Roundup: February 24-28, 2025

DataFam Roundup: February 17-21, 2025

DataFam Roundup: February 10-14, 2025
Abonnez-vous à notre blog
Obtenez les dernières nouvelles de Tableau dans votre boîte de réception.