DataFam Roundup: August 26-30, 2024


Welcome! Dig into this week's DataFam Roundup—a weekly blog that brings together community content all in one post. As always, we invite you to send us your content—and the DataFam content from your peers that have inspired you! Find the content submission form here.
Community Highlight
To recognize new and consistent Tableau contributors—we’re excited to have a section within the weekly DataFam Roundup called the Tableau Community Highlight. Find out how to get involved.

Omokehinde Ayodeji, Data Analyst
Rivers State, Nigeria
Omokehinde Ayodeji is a data analyst who uses Tableau to simplify complex economic data into actionable insights. She got started with Tableau in her final year as a chemical engineering student through an internship. Seeing the potential for data analytics in the energy, oil, and gas industries, Omokehinde started to explore data analytics on her own. Although there was a steep learning curve with Tableau, resources like Tableau Public and content created by the Tableau community was instrumental in her journey.
Today, Omokehinde is deeply engaged in many parts of the Tableau community. She not only shares her visualizations on Tableau Public, but she also writes blogs, and participates in the community challenges. Additionally, she leads the Lagos Tableau User Group, where she focuses on building a local data community for the Nigerian DataFam through events, open discussions, and collaboration opportunities.
Connect with Omokehinde on Linkedin, X, Tableau Public, and on her blog.
DataFam content
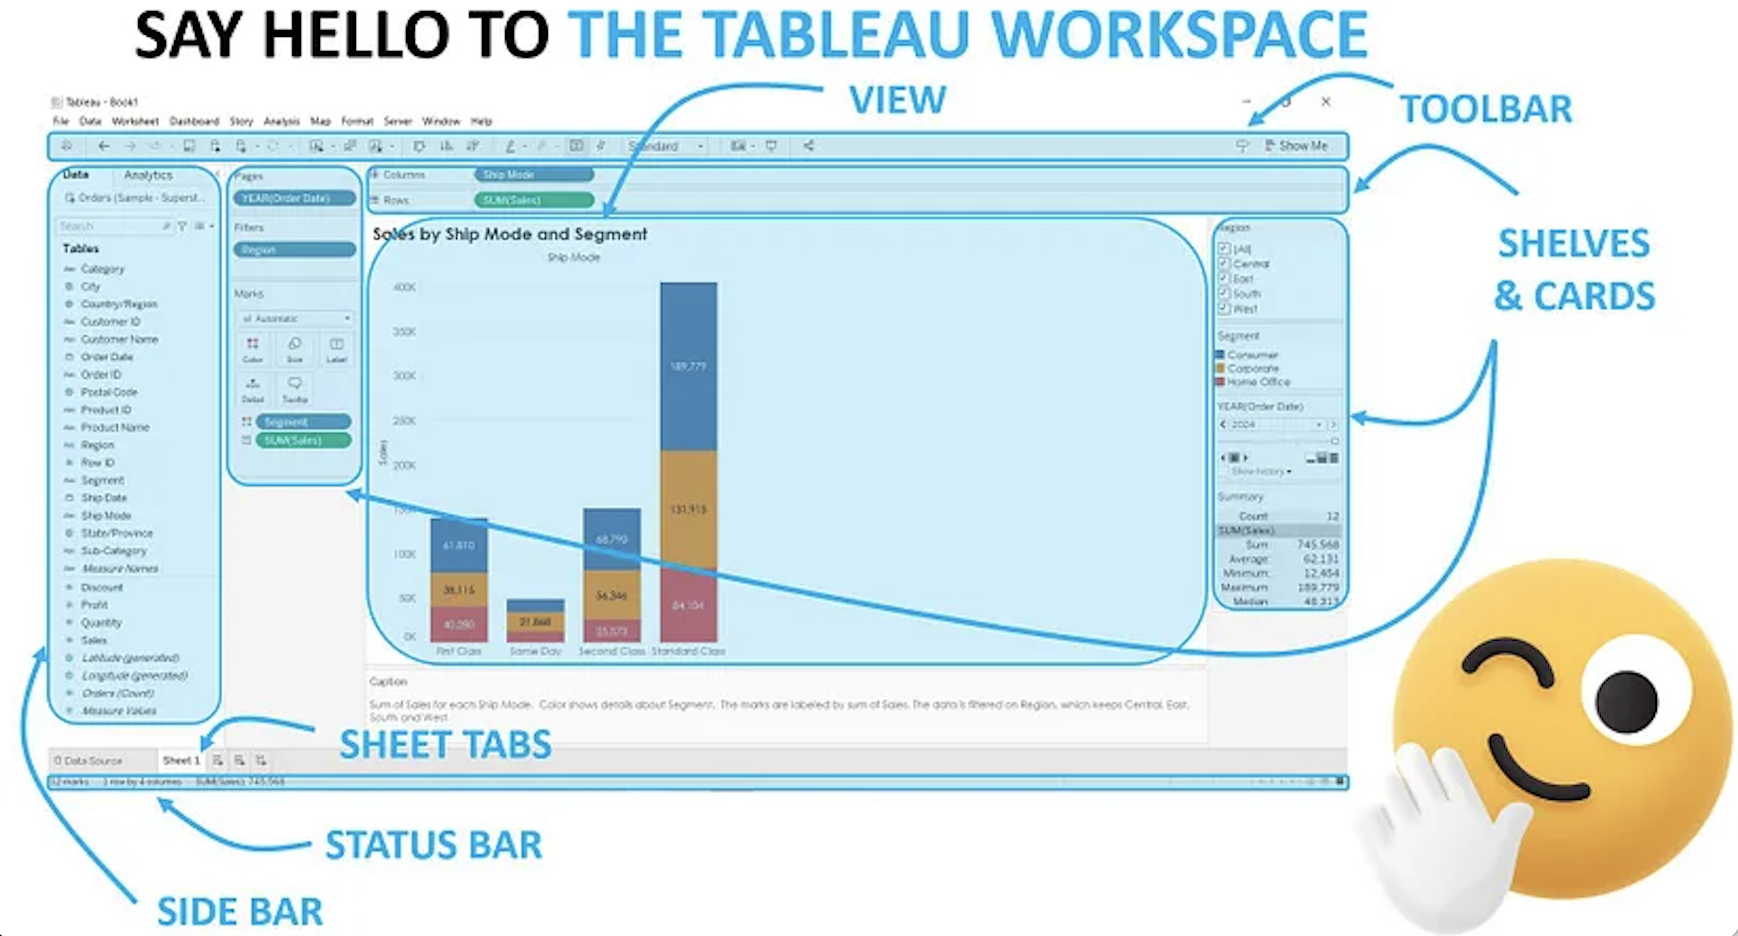
Deepak Holla: Say Hello to the Tableau Workspace
Dive into content created by the Tableau Community:
- Heather Cox, The Flerlage Twins: Data Dance: Combining AI Generated Music with Tableau
- Annabelle Rincon, Rativiz: Van Gogh Letters
- Lisa Muth: Data and Analytics Songbook
- Sarah Bartlett, Sarah Loves Data: Iron Quest Maps II – Recap
- Chris Westlake, Westlake Analytics: Creating Radial Scatterplots
- Lisa Trescott: Behind the Viz: Arrested Development
- Sean Miller, HipsterVizNinja: #MakeoverMonday Tableau Live Stream - 2024 week 35
- Tore Levinsen: #TinyTableauTip
- Deepak Holla: Say Hello to the Tableau Workspace
Team Tableau
- Data Literacy Basics Everyone Should Know
- Iron Viz 2024: Behind the Build featuring Chris Westlake
- Iron Viz 2024: Behind the Build featuring Pata Gogová
- Iron Viz 2024: Behind the Build featuring Jessica Moon
- Authors available for hire on Tableau Public
- 5 Tips from a Data Career Mentor
- Winning with Tableau: Paul Ross’s Tips from Beginner to Iron Viz Champion
Upcoming events and community participation
- Dreamforce 2024 Happy Hour Event
- Dreamin' in Data Dreamin’ in Data is the first Salesforce Community Conference purpose-built to help showcase the entire journey of your organization’s data, from Salesforce (your CRM), through integrations with other applications (using MuleSoft), and finally to analysis and determining the story your data is telling (using Tableau) – ultimately to help your organization make smarter decisions faster and stay ahead of your competition.
- Mark your calendars and join the Data Book Club as we explore, Chart Spark by Alli Torban, and the book's key themes and practical applications in our professional and personal lives. We will be meeting virtually starting August 2nd at 11am CT, but we also have a Slack space to discuss the book asynchronously as well as share notes, ideas, and resources!
- CRM Analytics Community Office Hours! Have CRM Analytics questions? Want to know how to work with data? Want to learn something new? Have visualization ideas you want to share or need feedback on? Want to just hang out with a bunch of us? Come join us (virtual)!
- DataFam Birthday Roundup! In the effort of continuing support for one another, we thought it would be fun to gather data on DataFam birthdays! If you're willing, could you let us know which day you celebrate your birthday? Just go ahead and pick the day from this year's calendar, since it's a leap year and all possible days are available to choose from!
- Mentorship Program by the Data Visualization Society
- Women in Dataviz Virtual Coffee Breaks: Held every sixth Thursday morning and every sixth Wednesday afternoon in the EST time zone, Virtual Coffee Breaks are a casual networking event. Feel free to drop in and out as you need toduring the hour, and stay for as little time or as long as you want.
Vizzes
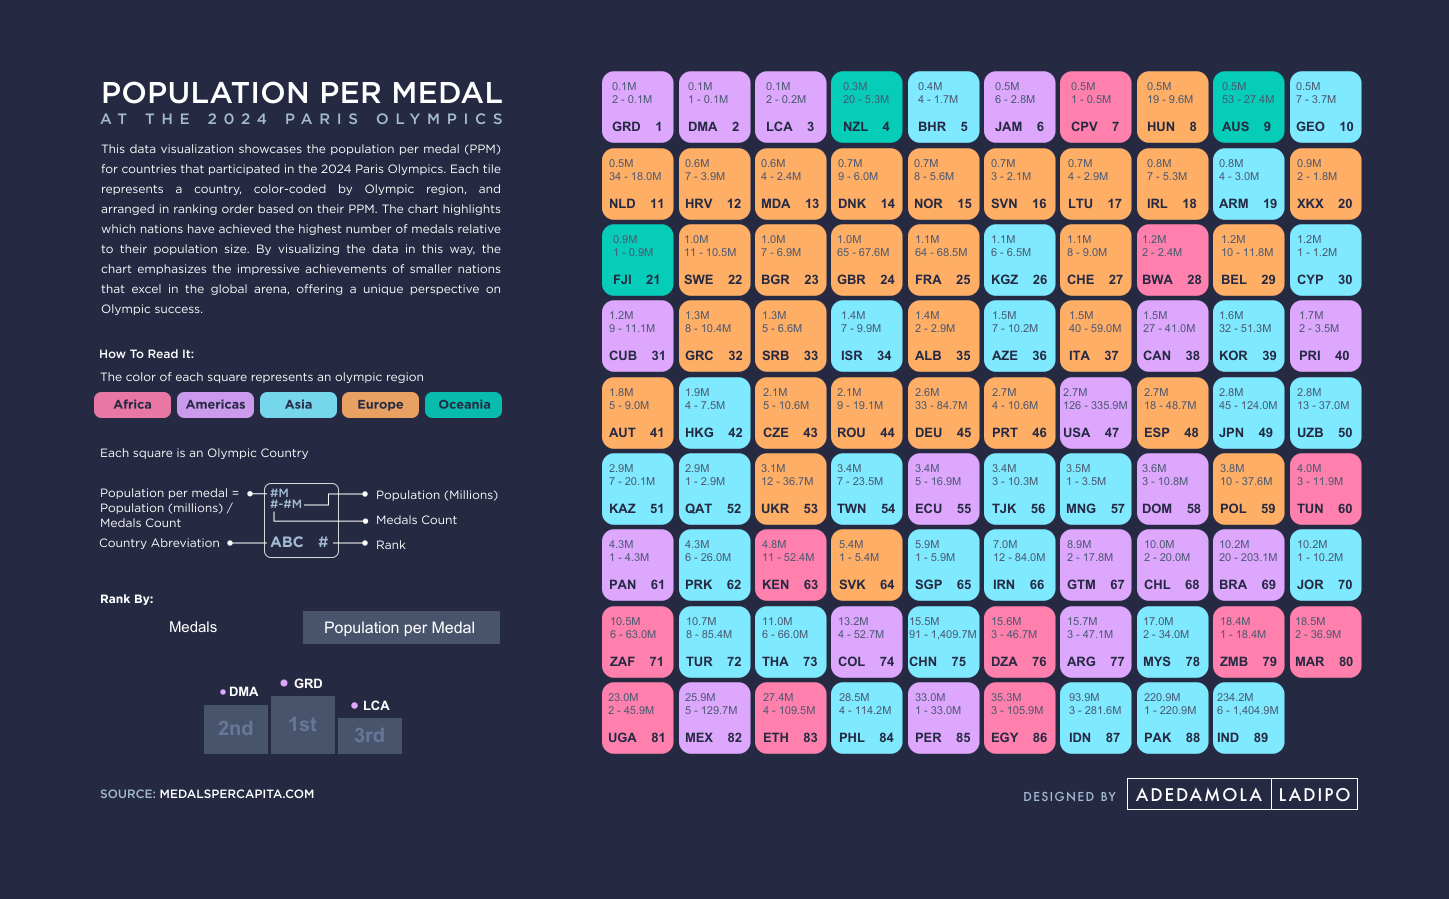
Adedamola (Damola) Ladipo: 2024 Olympics | Population Per Medal
See the latest Viz of the Day, trending vizzes, featured authors, and more on Tableau Public.
Check out some inspirational vizzes created by the community:
- Ojoswi Basu: SocialMedia Usage | #MakeoverMonday | Week 34 | 2024
- Jennifer Dawes: Data Art: CMYK Embroidery - Squares
- Dennis Kao: Paralympics | Paris 2024
- Tobiloba Babajide: Financial Complaints Dashboard #RWFD
- Caroline Swiger: #WOW2024 W32: Can you compare Olympic medalist age to a user's age?
- Adedamola (Damola) Ladipo: 2024 Olympics | Population Per Medal
- Shreya Arya: Harvestella Recipes: Nemea & Shatolla | #GamesNightViz
- Lorela Ferhati: These Are Just Lines
- Tamás Varga: 2024 Paris Olympics Medal Race
- Frederic Fery: Elliott's Epic France to Australia Bike Ride for Charity
- Matthias Giger: Resolved Issues Tableau Desktop, Prep and Server
- Waqar Ahmed Shaikh: 28 Ways to Elevate Your Bar Charts
Community Projects
Back 2 Viz Basics
A bi-weekly project helping those who are newer in the community and just starting out with Tableau. Not limited just to newbies!
Web: Back 2 Viz Basics
X: #B2VB
Week 17: Build a Scatter Plot II
Workout Wednesday
Build your skills with a weekly challenge to re-create an interactive data visualization.
Web: Workout Wednesday
X: #WOW2022
Week 35: Advanced Parameter/Set Action
Preppin' Data
A weekly challenge to help you learn to prepare data and use Tableau Prep.
Web: Preppin’ Data
X: #PreppinData
Week 34: Premier League Results
Makeover Monday
Create business dashboards using provided data sets for various industries and departments.
Web: Makeover Monday
X: #MakeoverMonday
Week 35: 2024 Paris Olympic Medal Count
Visual Climate
Collaborate and share climate data.
Web: Visual Climate
X: #VisualClimate
Gender Equality_ Women Entrepreneurship Participation
DataFam Con
A monthly challenge covering pop culture and fandoms.
Web: DataFam Con
X: #DataFamCon
March 2024 Challenge: Sports Movies Edition
EduVizzers
A monthly project connecting real education data with real people.
Web: Eduvizzers
August 2024: Analyze Boston – Department of Innovation and Technology
Viz for Social Good
Volunteer to design data visualizations that help nonprofits harness the power of data for social change.
Web: Viz for Social Good
X: #VizforSocialGood
: Future Fridays
Games Night Viz
A monthly project focusing on using data from your favorite games.
Web: Games Nights Viz
X: #GamesNightViz
Season 2: Cooking up the Spice of Data
Iron Quest
Practice data sourcing, preparation, and visualization skills in a themed monthly challenge.
Web: Iron Quest
X: #IronQuest
Iron Quest – Maps II
Storytelling with Data
Practice data visualization and storytelling skills by participating in monthly challenges and exercises.
Web: Storytelling with Data
X: #SWDChallenge
July 2024: graphing for—or with—kids
Project Health Viz
Uncover new stories by visualizing healthcare data sets provided each month.
Web: Project Health Viz
X: #ProjectHealthViz
Diversity in Data
An initiative centered around diversity, equity & awareness by visualizing provided datasets each month.
Web: Diversity in Data
X: #DiversityinData
Sports Viz Sunday
Create and share data visualizations using rich, sports-themed data sets in a monthly challenge.
Web: Sports Viz Sunday
X: #SportsVizSunday
Real World Fake Data
Create business dashboards using provided data sets for various industries and departments.
Web: Real World Fake Data
X: #RWFD
2024 - Admin Insights
Data Plus Music
A monthly project visualizing the data behind the music we love!
Web: Data Plus Music
X: #DataPlusMusic
Articles sur des sujets connexes

DataFam Roundup: February 24-28, 2025

DataFam Roundup: February 17-21, 2025

DataFam Roundup: February 10-14, 2025
Abonnez-vous à notre blog
Obtenez les dernières nouvelles de Tableau dans votre boîte de réception.