Heat Map Software

Try Tableau for Free

Full-version trial. No credit card required.

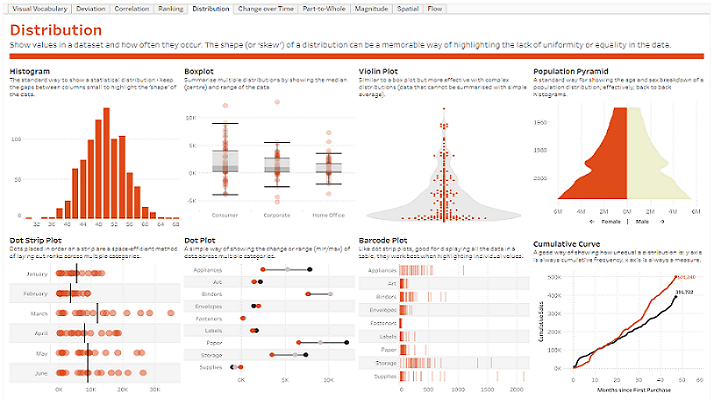
You have data and you have questions about that data. You know that there is a chart or graph out there that will help answer your questions, but it is not always easy to know which chart or graph is best without some trial and error.

Stranding your data in isolated, static graphs limits the number and depth of questions you can answer. Take the first step and transform your data into effective visualizations (any kind of chart or graph) or dashboards. Let your analysis become your organization’s centerpiece by using it to fuel exploration!

Make your data better

This visualization shows the number of endangered species listed in Africa, but the animals themselves are lost in the story.

What different kind of visualization will tell the most truthful story, and best answer the questions at hand?


TRY TABLEAU FOR FREE

Full-version trial. No credit card required.

TRY TABLEAU FOR FREE

THE TRIAL CANNOT BE INSTALLED ON MOBILE DEVICES.
Ver especificaciones técnicas

Especificaciones técnicas


Sistemas operativos
  • Windows 7 o posterior
  • OSX 10.10 o posterior

Entornos virtuales
  • VMWare | Citrix | Hyper-V | Parallels.
  • Los productos de Tableau funcionan en entornos virtualizados cuando se configuran con el hardware y el sistema operativo apropiados.

Internacionalización
  • Nuestros productos están habilitados para Unicode y son compatibles con datos almacenados en cualquier idioma. La interfaz y la documentación se encuentran disponibles en inglés, francés, alemán, español, portugués (Brasil), japonés, coreano y chino simplificado.

Explore your data with a purpose

Data visualization is a form of visual art that grabs our interest and keeps our eyes on the message. When we see a chart, we quickly see trends and outliers.

If we can see something, we internalize it quickly. If you’ve ever stared at a massive spreadsheet of data and couldn’t see a trend, you know how much more effective a visualization can be.

Try Tableau for Free

Before it was always numbers in rows and columns. Now I’m eager to see when I do a new analysis, because it's so much easier to actually see the trends, the story, and the power the data brings.

Visualize your data in Tableau

Fast Analytics

Connect and visualize your data in minutes. Tableau is 10 to 100x faster than existing solutions.

Ease of Use

Anyone can analyze data with intuitive drag & drop products. No programming, just insight.

Big Data, Any Data

From spreadsheets to databases to Haadoop to cloud services, explore any data.

Smart Dashboards

Combine multiple views of data to get richer insight. Best practices of data visualization are baked right in.

Update Automatically

Get the freshest data with a live connection to your data or get automatic updates on a schedule you define.

Share in Seconds

Publish a dashboard with a few clicks to share it live on the web and on mobile
devices.

Acerca de Tableau

Tableau ayuda a las personas a transformar los datos en información útil. Explore con análisis visuales ilimitados. Diseñe dashboards y haga análisis ad hoc con unos pocos clics. Comparta su trabajo con quien quiera y genere un impacto positivo en su empresa. Multinacionales, empresas pequeñas y emergentes... Todo el mundo usa Tableau para ver y comprender sus datos.


Publicado en

Get Your Free Trial

Complete el formulario para obtener la versión de prueba gratuita. Nuestro equipo se pondrá en contacto para ayudarlo a aprovechar al máximo la prueba.

¿Ya tiene una cuenta? Inicie sesión aquí
Dirección