Viewing Data Model for Published Data Sources

Sean Miller is a Tableau Visionary and Principal Consultant at Concord and has been using Tableau since 2015. He hosts a weekly data livestream on YouTube, is a #WorkoutWednesday coach, leads the #DataPlusMusic project, and co-leads the Kansas City User Group.
One of the big announcements that came out of Tableau Conference 2024 was the concept of composable Tableau data sources. Essentially this means you will soon be able to join, relate, and/or modify Tableau published data sources (PDSes) to extend the data sources needed to answer your toughest analytics questions.
Before we get to composable data sources, we first have to allow data authors to see the underlying data model of a published data source. Until recently, when a user connects to a published data source in Tableau who is not the owner of said data source, it's a bit of a black box—unless there is impeccable documentation that lives in a third-party system detailing the data model (and I wouldn't hold my breath for that).
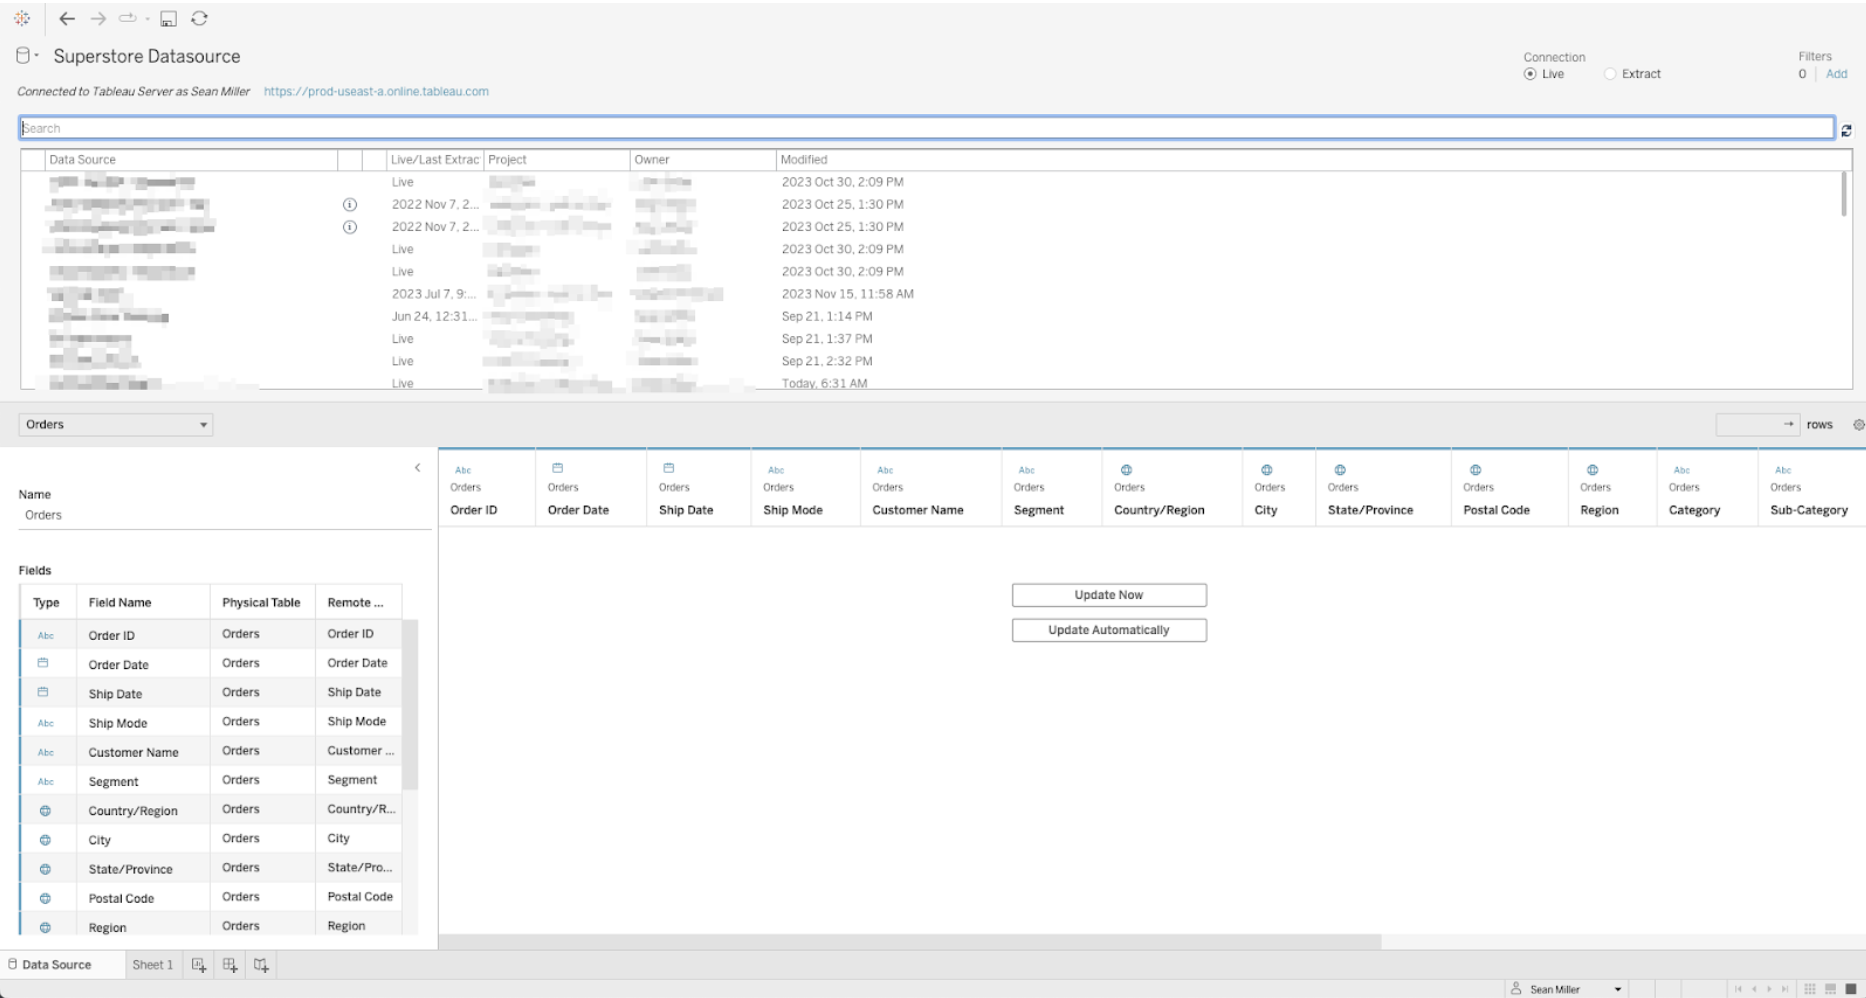
To visually showcase this new feature, I want to show you what a previous version's view was like and contrast that with the experience in the 2024.3 release. Below is what the published data source looked like in 2024.2:

As you can see, not only is it limiting, it's completely different than what we're used to seeing. The lower preview of the top n rows lists the column headers and is consistent with the data source authoring experience. However, the top portion just lists all published data sources and metadata about each data source. Imagine trying to create and then promote the use and flexibility of Tableau-published data sources without visually vital details about the data sources.
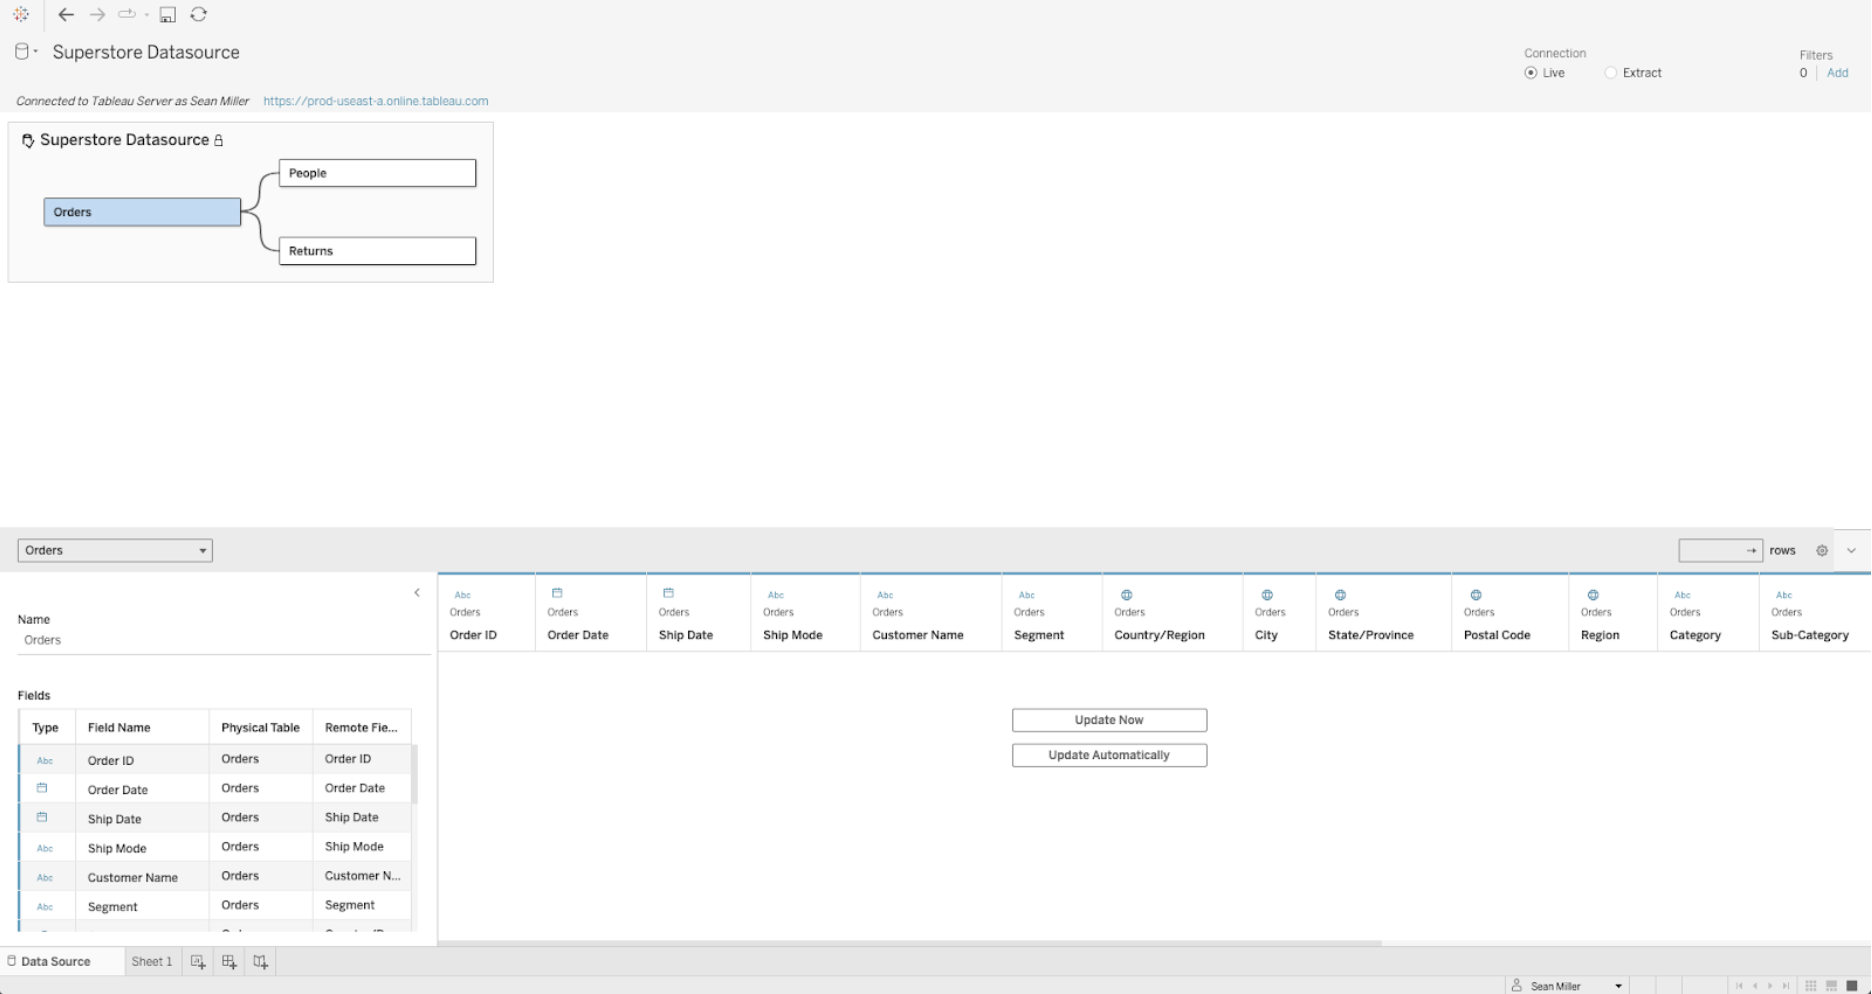
Now, let’s compare this to the new view with Tableau 2024.3:

Okay, now we're talking! As a Tableau user, this feels familiar. I can see the tables used and more importantly, I can see the relationship between tables, just as you would create if you were building a new data source from scratch. For the sake of simplicity, I'm using a familiar data model that we've all seen—Superstore. But imagine how insightful this would be for a much more complex model.
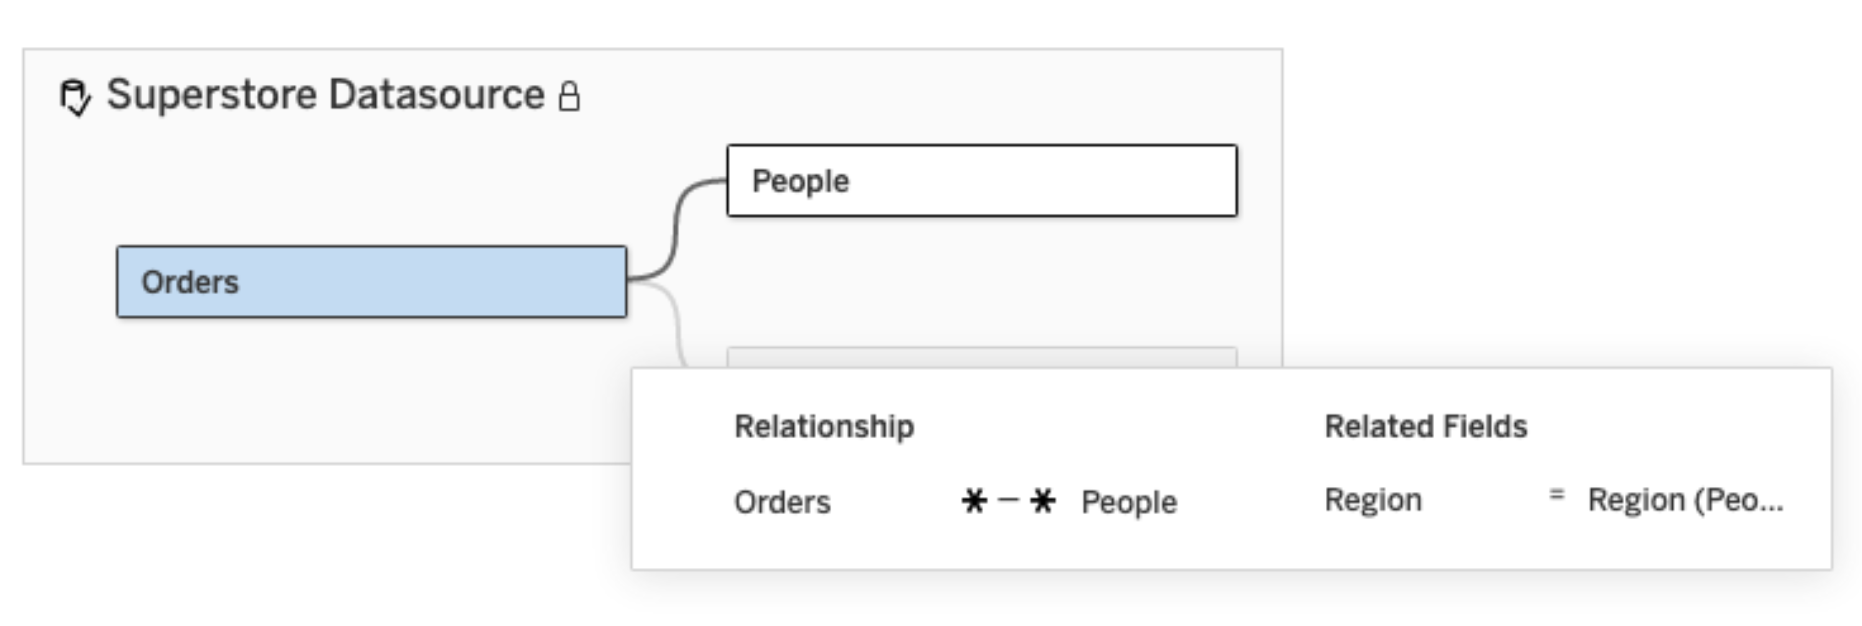
There's more. Not only can I see the table names and their "noodles," but when I click on each noodle, I get even more information about the relationship.

Now we can see the Order and People tables are related together using the Region field and that this is a many-to-many relationship. As a Creator or Explorer, this information is foundational to anything I want to create.
Real-world use case
Let’s consider a data source for a global organization with products, locations, and customers in various regions across the globe. If we wanted to analyze customer behaviors relative to store locations we would want to ensure that the region field(s) being used are from the correct tables. In a single data model we might have:
- Customer Region
- Store Region
- Product Manufacturer Region
By viewing the underlying data model with this new feature, Creators and Explorers can be certain they are using the correct field in their analysis.
Composable data sources are the future
The future of Tableau is published data sources. Being able to view the underlying data model of published data sources is a new and important brick on the road to composable data sources. I do believe composable data sources will aid in your organization's ability to reduce the proliferation of data sources in your environment, and will introduce a level of data source transparency we've never had before.
Want more? Brush up on best practices for published data sources in Tableau, or check out all the features in the latest release.
Historias relacionadas
Suscribirse a nuestro blog
Obtenga las últimas actualizaciones de Tableau en su bandeja de entrada.


