What 17th Century Pioneers Can Teach Us about Sharing Ideas

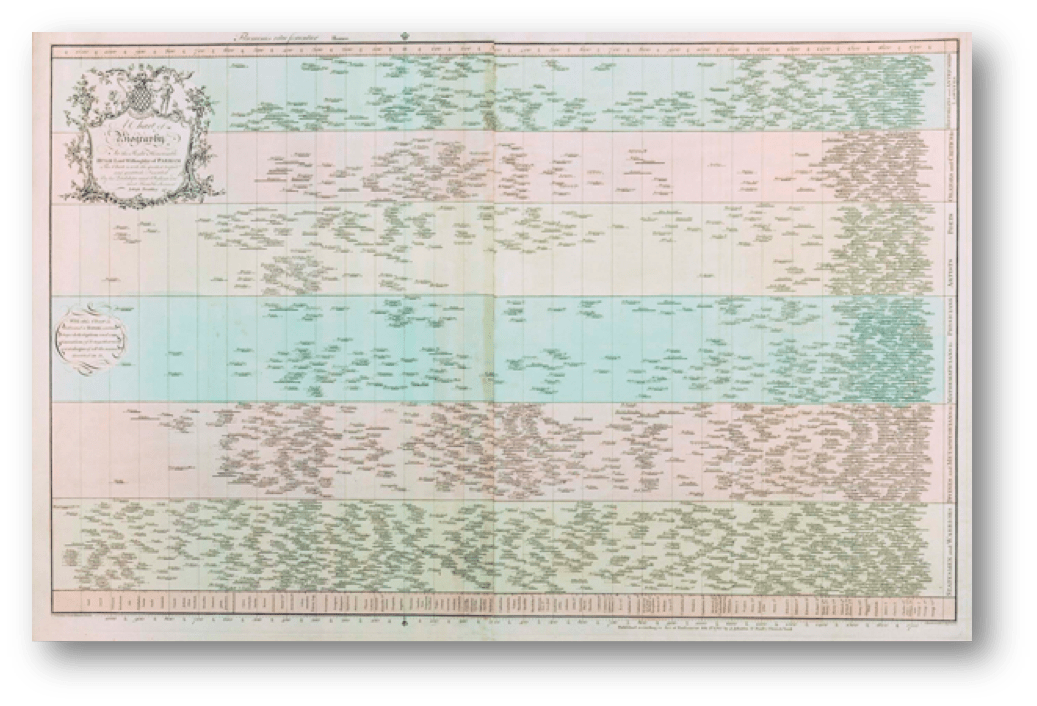
Joseph Priestley's Chart of Biography (1765)
Note: This is the first installment of a three-part series on data rockstars of yore.
How do you know your work is effective? And how can you improve it?
One way is to emulate the 17th century coffeehouse patrons who led the age of Enlightenment.
Back in the 17th century, coffeehouses sprang up around Europe. For the first time, people had a stimulant to consume, and enough spare time to converse and share ideas.
Visual communication was one beneficiary during the period. Two of the most influential visualisations of all time emerged at this stage: Joseph Priestley’s Chart of Biography and William Playfair’s Trade Balance Charts. It’s amazing to think that before those charts, people hadn’t really considered using the x-axis to show time in a consistent manner.

William Playfair's Trade Balance Charts
Priestley’s chart came first, followed by Playfair’s some years later. Playfair’s chart is celebrated as the first published statistical line chart.
What does this have to do with coffee? It all has to do with what Playfair said in the third edition of his book: “It is now sixteen years since I first thought of applying lines to subjects of Finance. Was I the first who applied [Priestley’s] principles to Finance?”
In an age of sharing ideas, the coffee shops enabled people to share ideas and network. They could crowdsource their experiments. They could take inspiration from multiple places.
Sharing ideas is just as vital today. If you want to be more effective in communicating your ideas, do as those coffee drinkers did:
1. Go to conferences: What better way to learn and network? Whether it’s a specific product conference such as Tableau’s own, a storytelling conference such as Tapestry, or a general design conference such as Visualized, you will learn much from seeing what other people do.
2. Go to, or start, a user group: Tableau User Groups, for example, are excellent ways to dive into and share specific learning points or challenges you have with Tableau. We have hundreds around the world, and if there isn’t one near you, why not start one?
3. Network: Wherever you are in the world, you can be active on social networks. Twitter is an amazing place. Just check out the #dataviz hashtag, for example.
4. Drink coffee! Well, OK, you can choose your own beverage. Those pioneers were the first caffeine consumers, and it was the first time in history we wired our brains to work faster.
@visualisingdata @albertocairo At the risk of becoming annoying I'd love your thoughts on my variation on slopegraphs pic.twitter.com/rVCJtPJ0tq
— John Burn-Murdoch (@jburnmurdoch) March 19, 2014
The modern way to network and learn.
To learn out more, check out our whitepaper on how data viz pioneers can inspire you. And read this Harvard Business Review article on crowdsourcing insights from data sets.
Historias relacionadas
Suscribirse a nuestro blog
Obtenga las últimas actualizaciones de Tableau en su bandeja de entrada.


