(Finally!) See and Understand Your IoT Data with Our Google Sheets Connector
The Internet of Things has made collecting data easy. The hard bit has been analyzing that data. The applications bundled with IoT devices don’t allow for freeform exploration, and only the coders of the world can write APIs and build infrastructure to get and store the data.
Tableau Public 10 is changing that with its Google Sheets connector. Finally, it is possible to build a direct path from IoT devices to the analytical, intuitive power of Tableau. In Tableau Public 10, you can connect to your Google Sheets. Not only that, if you publish your analysis to Tableau Server, the data can be set to auto-refresh.
Yes, you read that right: Tableau Public 10 has a refreshing connection to Google Sheets. This has many incredible applications, but today I’m going to focus on my favorite site on the internet, IFTTT.com.

Let’s see how we can use IFTTT and Google Sheets to analyse our IoT data.
All you need are three things:
- One or more connected device. In this example, we’re using a sensor which activates when the front door opens (this is genuine data, but we’ve kept its owner anonymous)
- An IFTTT account and a recipe which, when triggered, saves information to a Google Sheet
- Tableau Public 10 and its Google Sheets connector
What insights can we find about daily habits?
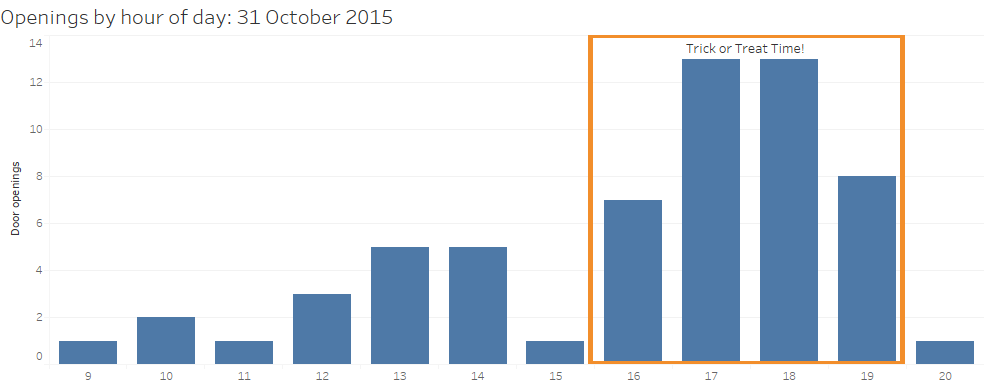
I began by looking at the number of door openings per day. One day jumped right out as an outlier. What day was that? October 31—of course! Halloween! Trick or treat! I verified that by looking at when the door was opened on that day:

That’s right—the door was opened 41 times between 4 p.m. and 8 p.m.—all those kids, all those treats all generating data!
You could set up a dashboard so you can explore any day’s comings and goings with ease.
Check out this video for a detailed demonstration of how to connect to Google Sheets with Tableau 10.
(Don't worry if your Tableau interface looks slightly different as this video was made using Tableau Desktop.)
This is but the simplest of simple explorations of IoT data, but the possibilities for analytics are endless. For some more ideas, check out the channels available on IFTTT.com.
- Maybe you want to explore data from your Fitbit, or bike rides in Strava? You could also track weather in your home city and see if it affects your training.
- You could analyse the temperatures you set on your Nest Thermostat to check home efficiency.
- What if you looked at home security sensors to look for suspicious activity?
- IFTTT has 328 channels you can connect to—an almost-limitless set of ways to track IoT data!
Of course, there’s much more to Google Sheets, too. Try exploring their ImportHTML and ImportFeed functions to retrieve, then explore, data from across the web.
What will YOU do with the Google Sheets connector? Let us know!
To learn more about Tableau Public 10, check out our list of resources.
Historias relacionadas
Suscribirse a nuestro blog
Obtenga las últimas actualizaciones de Tableau en su bandeja de entrada.


