DataFam Roundup: March 7 - 11, 2022
Welcome! Dig into this week's DataFam Roundup—a weekly blog that brings together community content all in one post. As always, we invite you to send us your content—and the DataFam content from your peers that have inspired you! Find the content submission form here.
DataFam content
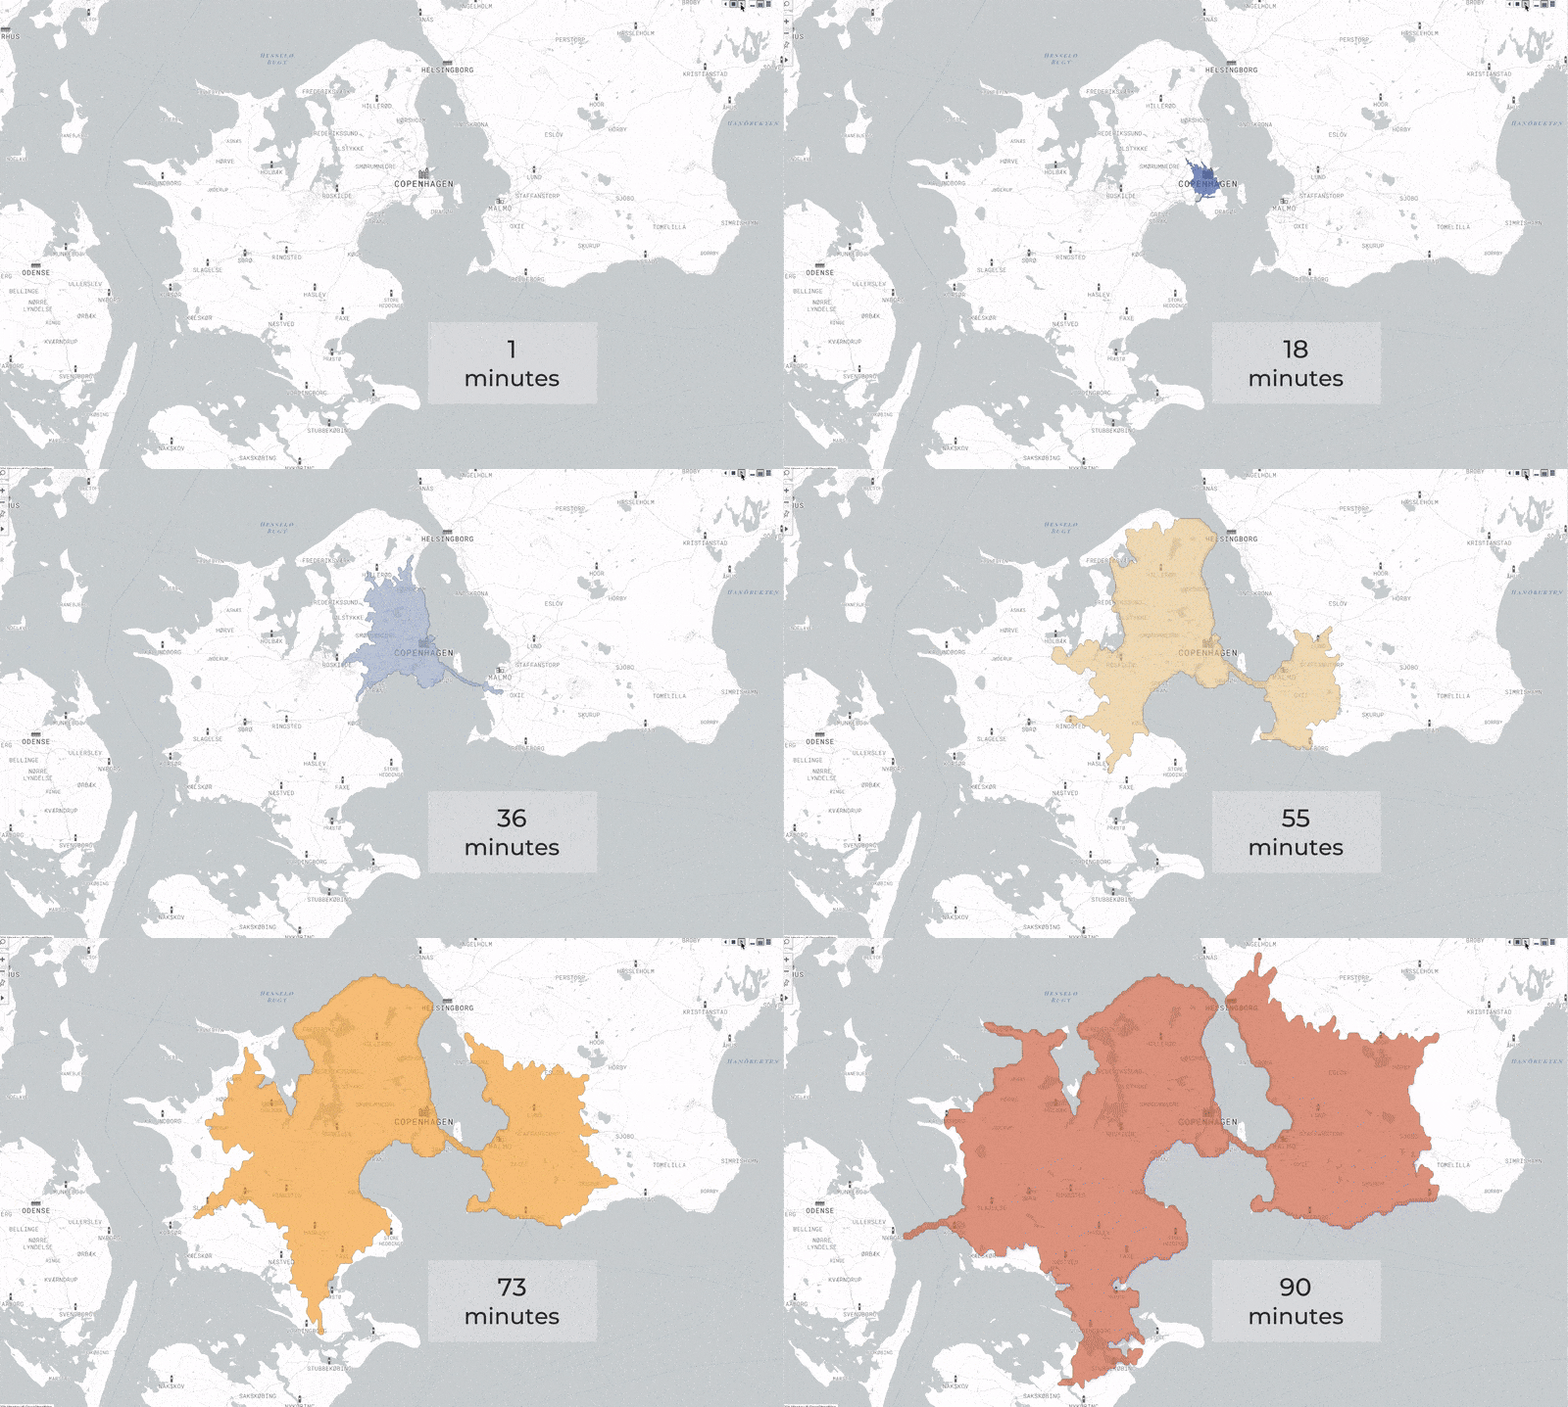
Marc Schønwandt, The Flerlage Twins: Travel/Drive-Time Maps in Tableau
Dive into content created by the Tableau Community:
- Nicole Klassen and Christina Gorga, DataFam Con: February 2022: Toss a Coin to your Witcher …
- Marc Schønwandt, The Flerlage Twins: Travel/Drive-Time Maps in Tableau
- Zach Bowders, Data + Love: The Newbie TUG with Klaus Schulte + Jim Dehner
- Alex Freberg, Alex The Analyst: Tableau Data Analyst Certification Review
- Dawn Harrington, techtipsgirl: Tableau and API
- Alisha Dhillon, The Data School: My Iron Viz Journey - NFTs: Art in the Metaverse and Digital Future
- Anne-Sophie Pereira De Sa, The online dots: 9 details I loved in 2022’s Iron Viz entries
- Alexander Mou, Vizible Difference: How to Send Email from Tableau with a Template
- Candice and Kirk Munroe, Paint with Data: Career Day at Toronto TUG or Is it Ever OK to Use a Pie Chart?
- Marc Reid: Calculate the AREA of your polygons in Tableau and then create charts to compare the sizes.
- Minna Wang, Visual Analytics Field Notes: 6 examples of beautiful Marimekko charts (a.k.a. mosaic plots) & 2 examples with D3 code!
- Jason Khu: My online Tableau Certified Data Analyst exam experience
- Kevin Flerlage, The Flerlage Twins: More Than One Way to Skin a Cat...in Tableau (Part 1)
- Amir Meimand, Open Data Science: Bridging the Gap Between Data Scientists and Business Users
- Annabelle Rincon, Rativiz: Rethink an old viz
- Mark Bradbourne, Just 5 Minutes: Cautiously Optimistic
- Brian Moore, Do Mo(0)re with Data: It Depends: Techniques for Disabling the Default Highlighting in Tableau
- Elliott Stam, Devyx: Visualizing the impact of a bearish market on our automated trading system
-
Klaus Schulte, CO data: Custom Axes in Tableau
-
Morten Bo Daugaard: How To: Tableau Writeback to Microsoft SQL-Server withtout using extensions or APIs
-
Mick Yang: Meet the Community! Kimly Scott, Tableau Data Visualisation Specialist
-
Felicia Styer, Playfair Data: How to Analyze A/B Tests in Tableau Using Z-Tests
Team Tableau
- Celebrating Women's History Month with the Tableau Community
- Explore the Iron Viz entries on Visualizing the Arts
- Announcing the 2022 Tableau Visionaries
Upcoming events and community participation
- Stay up to date with the latest and greatest from the Tableau Community. We'll help you along in your Tableau journey, bring your data skills to the next level, and nurture powerful connections.
- Sign up to be a panelist for the 3charts@3 Live: A Mystery Chart Show featuring topics like personal finance, energy, healthcare and more!
- Calling all DataDevs: Join Tableau at TrailblazerDX 2022, April 27–28 in San Francisco—or virtually from anywhere—to boost your skills and celebrate with other builders, creators, and makers.
Vizzes
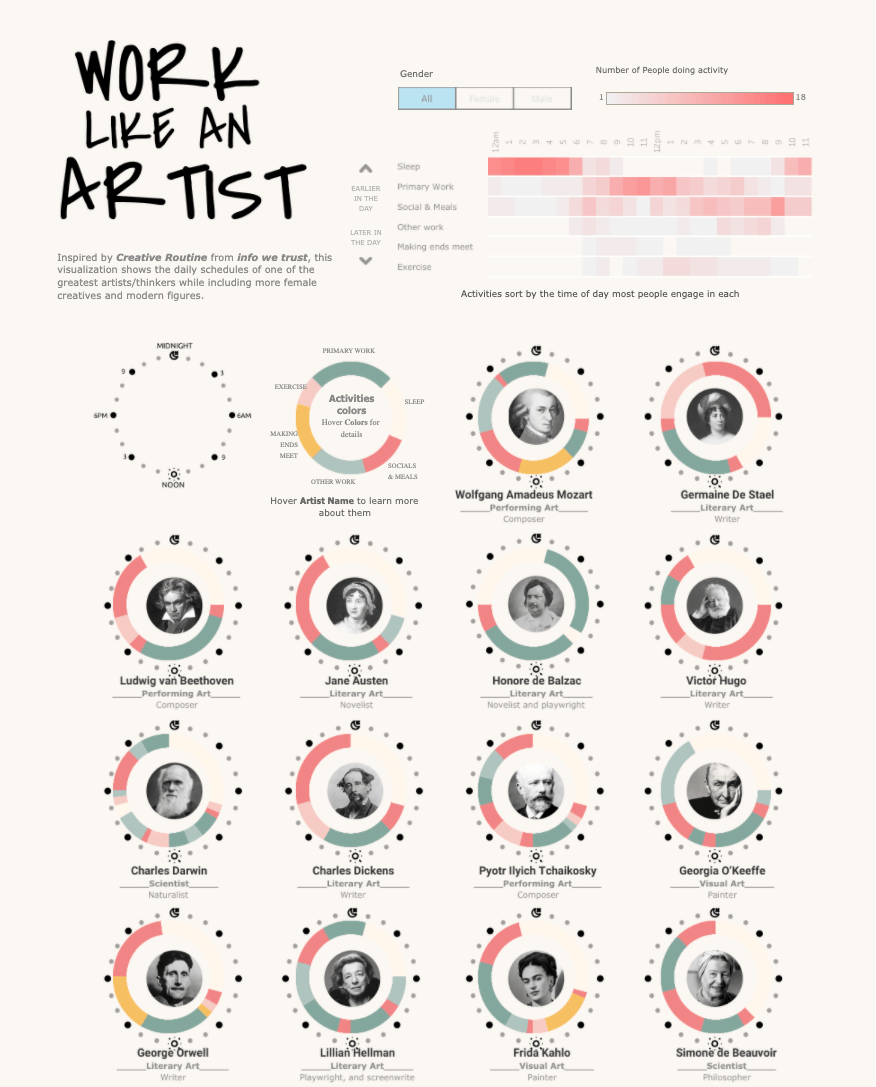
Ha PL: Work Like an Artist: Daily Routines of Famous Creatives
Catch this week’s Viz of the Days here and subscribe to get them emailed directly to your inbox.
Check out some inspirational vizzes created by the community:
- Muhammad Azhar: Adagio | Tomaso Albinoni | #DataPlusMusic
- Timothy Blaisdell: Tuskegee Airmen Challenge
- Ha PL: Work Like an Artist: Daily Routines of Famous Creatives
- Naresh Suglani: Weekly Footballer Salaries
- Samuel Parsons: European Superstore Focusing on Issues
- Fuad Ahmed: Finance Business Dashboard
Community Projects
DataFam Con *NEW!
A monthly challenge covering pop culture and fandoms.
Web: DataFam Con
Twitter: #DataFamCon
February 2022: Toss a Coin to your Witcher …
EduVizzers *NEW!
A monthly project connecting real education data with real people.
Web: Eduvizzers
March 2022:
- Level 1 dataset: IPEDS University Admissions Data
- Level 2 dataset: IPEDS University Directory Data
Back 2 Viz Basics
A bi-weekly project helping those who are newer in the community and just starting out with Tableau. Not limited just to newbies!
Web: Back 2 Viz Basics
Twitter: #B2VB
Week 5: Use Color Purposefully
Data Plus Music
A monthly project visualizeing the data behind the music we love!
Web: Data Plus Music
Twitter: #DataPlusMusic
February 2022: MIDI Music Analysis
Games Night Viz
A monthly project focusing on using data from your favorite games.
Web: Games Nights Viz
Twitter: #GamesNightViz
February 2022: Level 2: Hello World
Workout Wednesday
Build your skills with a weekly challenge to re-create an interactive data visualization.
Web: Workout Wednesday
Twitter: #WOW2022
Week 10: Sales Budget “Burndown” Chart
Preppin' Data
A weekly challenge to help you learn to prepare data and use Tableau Prep.
Web: Preppin’ Data
Twitter: #PreppinData
Week 9: Customer Classifications
Iron Quest
Practice data sourcing, preparation, and visualization skills in a themed monthly challenge.
Web: Iron Quest
Twitter: #IronQuest
February 2022: Re-Viz-It
Storytelling with Data
Practice data visualization and storytelling skills by participating in monthly challenges and exercises.
Web: Storytelling with Data
Twitter: #SWDChallenge
February 2022: declutter & focus
Project Health Viz
Uncover new stories by visualizing healthcare data sets provided each month.
Web: Project Health Viz
Twitter: #ProjectHealthViz
January 2022: One Year of Sleep
Diversity in Data
An initiative centered around diversity, equity & awareness by visualizing provided datasets each month.
Web: Diversity in Data
Twitter: #DiversityinData
November - December 2021: The countdown to Christmas and New Year!
SDG Viz Project
Visualize data about Sustainable Development Goals provided by the World Health Organization.
Web: SDG Viz Project
Twitter: #TheSDGVizProject
Sports Viz Sunday
Create and share data visualizations using rich, sports-themed data sets in a monthly challenge.
Web: Sports Viz Sunday
Twitter: #SportsVizSunday
March 2022: Women in Data
Viz for Social Good
Volunteer to design data visualizations that help nonprofits harness the power of data for social change.
Web: Viz for Social Good
Twitter: #VizforSocialGood
Mar 8, 2022 - Mar 29, 2022: Tap Elderly Women's Wisdom for Youth (TEWWY)
Real World Fake Data
Create business dashboards using provided data sets for various industries and departments.
Web: Real World Fake Data
Twitter: #RWFD
Viz 2 Educate
Each month, create vizzes on global education syllabus topics as resources for teachers worldwide.
Web: Viz 2 Educate
Twitter: #Viz2educate
February 2022: Food & Nutrition
Makeover Monday
Join the community every Monday to work with a given data set and create better, more effective visualizations.
Web: Makeover Monday
Twitter: #MakeoverMonday
If you've made it to the end, here's a Tweet from the DataFam that we hope makes you smile.
Happy #InternationalWomensDay #IWD2022 to all of the inspiring women in the #datafam #datapluswomen #momswhoviz #Tableau Community! 🎉
— Sarah Bartlett (@sarahlovesdata) March 8, 2022
Thank you for driving our community forward, sharing your knowledge and elevating each other.
Tag those who inspire you below! 👇 pic.twitter.com/6nhbuNAxrW
Historias relacionadas
Suscribirse a nuestro blog
Obtenga las últimas actualizaciones de Tableau en su bandeja de entrada.


