DataFam Roundup: March 28 - April 1, 2022
Welcome! Dig into this week's DataFam Roundup—a weekly blog that brings together community content all in one post. As always, we invite you to send us your content—and the DataFam content from your peers that have inspired you! Find the content submission form here.
DataFam content
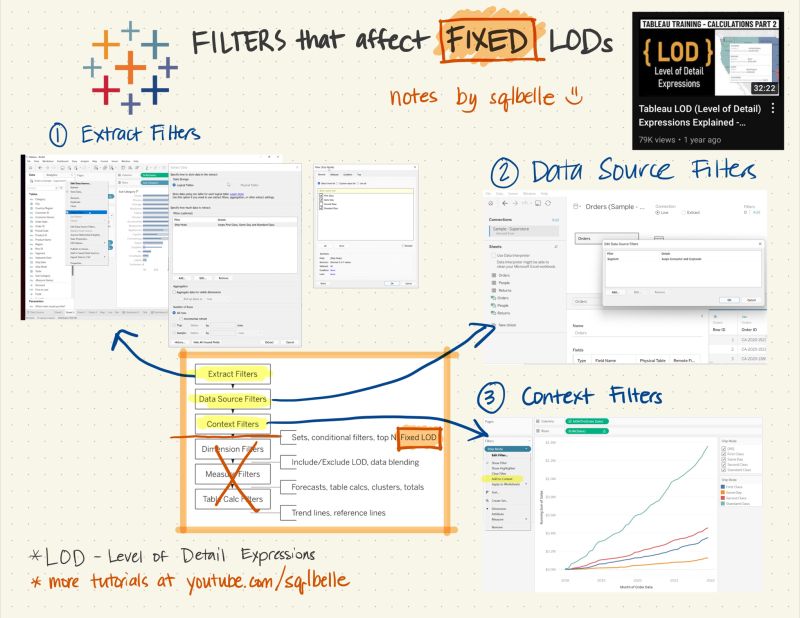
Donabel Santos: #Tableau Quick Notes
Dive into content created by the Tableau Community:
- Donabel Santos:
- Prasann Prem: Do you use the drop-field method in Tableau?
- Tim Ngwena, Tableau Tim: Tableau Workbook Optimiser: New in Tableau 2022.1
- Kevin Flerlage, The Flerlage Twins: Single Sheet Trellis Chart Zoom
- Ken Flerlage, The Flerlage Twins: How to Perform Multiple Pivots in Tableau Desktop
- Jeff Planter, Data Drive: The Final Four
- Rintaro Sugimura: Tableau極めるTableau Master 30 day challenge
- Christina Gorga: The View Behind the Curtain: My Experience as a 2022 Iron Viz Judge
- Tom Seiple: Accessibility, Fonts, and Dyslexia
Team Tableau
- Who are the finalists of the 2022 Iron Viz Qualifiers?
- How the Tableau Community volunteered their data skills to help the Government of Thailand
- Data mentorship and giving back to the Tableau Community
- Two Data+Women leaders on navigating a career in data and technology
- Featured Authors March 2022: Women's Edition
Upcoming events and community participation
- Stay up to date with the latest and greatest from the Tableau Community. We'll help you along in your Tableau journey, bring your data skills to the next level, and nurture powerful connections.
- Sign up to be a panelist for the 3charts@3 Live: A Mystery Chart Show featuring topics like personal finance, energy, healthcare and more!
- March 23: The #DuBoisChallenge Episode
- Watch the recording: Women's History Month Episode
- Calling all DataDevs: Join Tableau at TrailblazerDX 2022, April 27–28 in San Francisco—or virtually from anywhere—to boost your skills and celebrate with other builders, creators, and makers.
- Your Future in Data Analytics, Maggy (Martina) Muellner: aims to support the next generation of DataFam members in gaining/improving their Tableau skills, support them in making their resume "hire friendly" and give advice on personal marketing on LinkedIn.
- Data Book Club, Spring 2022 Selection: Upstream: The Quest to Solve Problems Before They Happen by Dan Heath
Vizzes
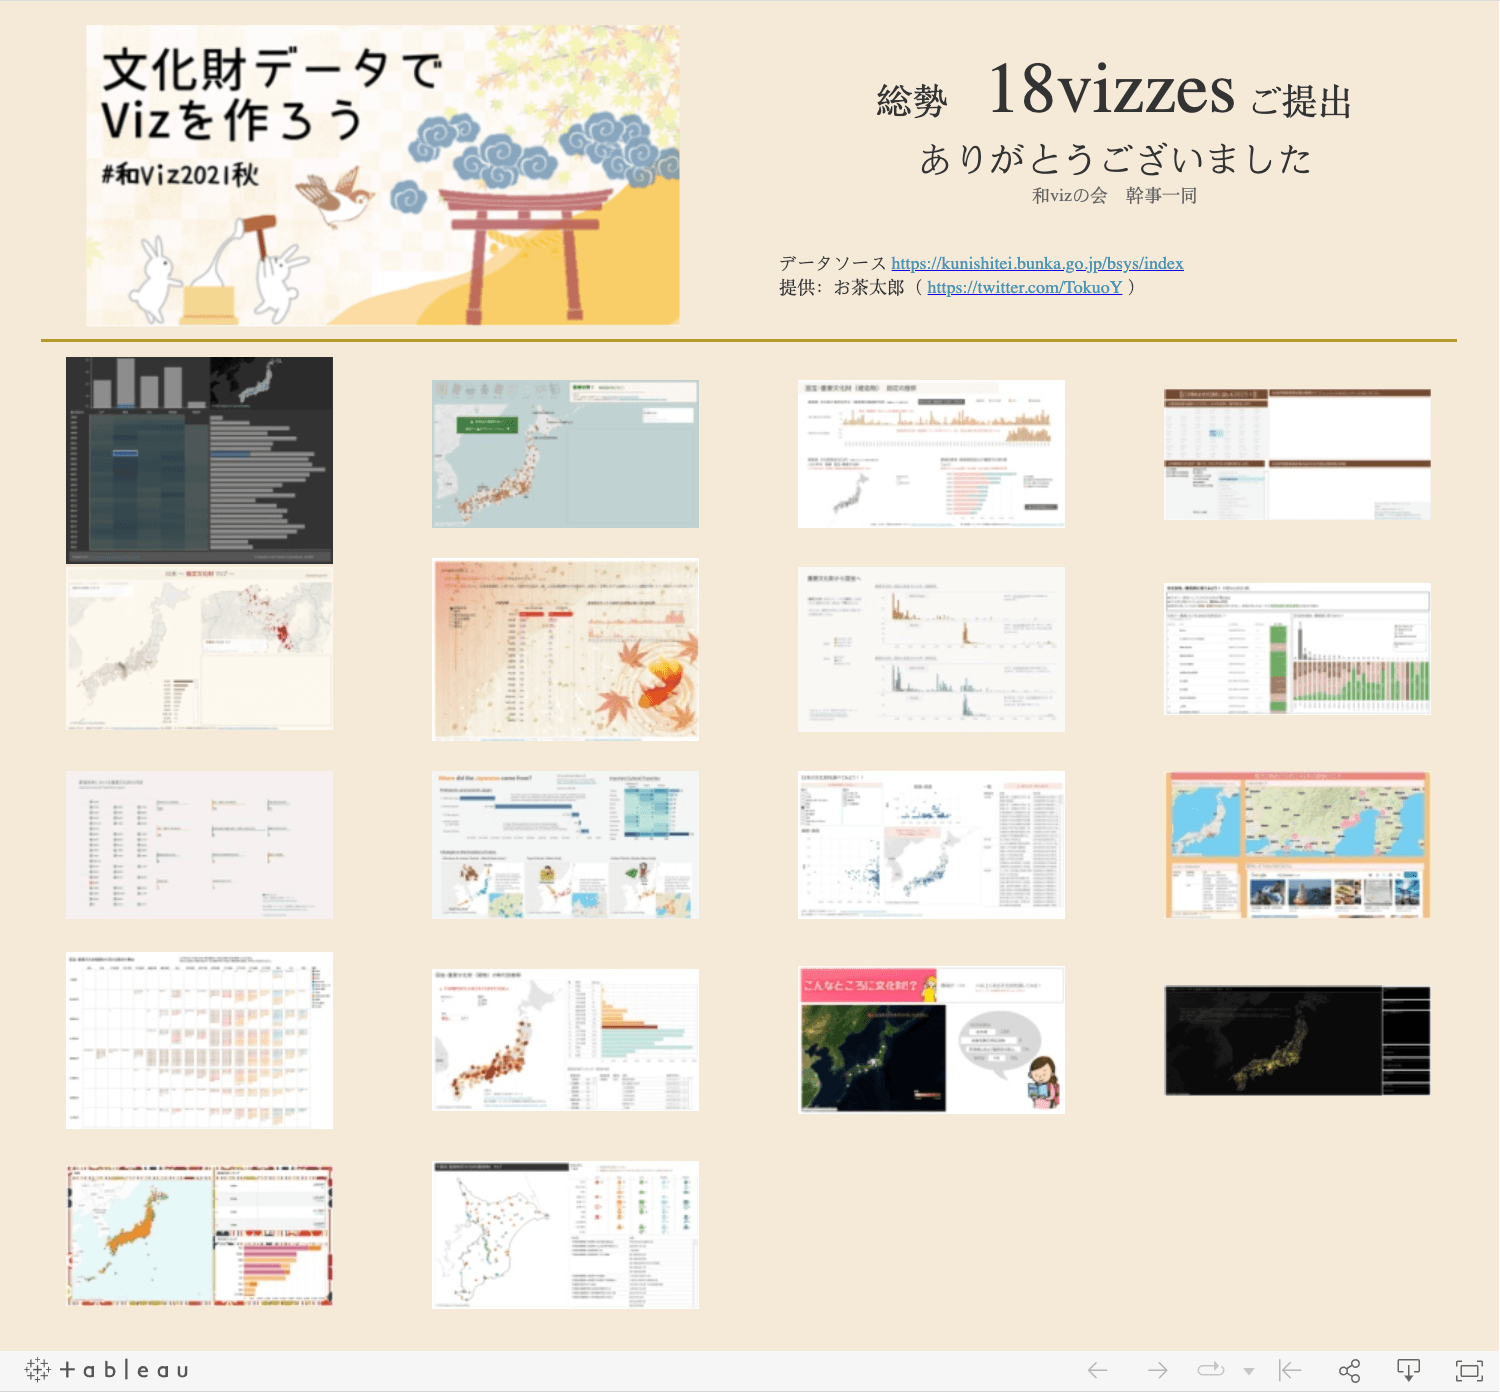
Yuzo Tokutani: 11 25 第4回Tableau 和Vizユーザ会 データアナリティクス勉強会 _秋_ 重要文化財を可視化してみよう ご参加ありがとうございました
Catch this week’s Viz of the Days here and subscribe to get them emailed directly to your inbox.
Check out some inspirational vizzes created by the community:
- Autumn Batanni: Call Center Dashboard | VOTD
- Tristan Guillevin: Back to the 80s
- Yuzo Tokutani: 11 25 第4回Tableau 和Vizユーザ会 データアナリティクス勉強会 _秋_ 重要文化財を可視化してみよう ご参加ありがとうございました
- Samuel Epley: Tableau Public Featured Authors: Women's Edition - March 2022 Cohort
Community Projects
DataFam Con
A monthly challenge covering pop culture and fandoms.
Web: DataFam Con
Twitter: #DataFamCon
February 2022: Toss a Coin to your Witcher …
EduVizzers
A monthly project connecting real education data with real people.
Web: Eduvizzers
March 2022:
- Level 1 dataset: IPEDS University Admissions Data
- Level 2 dataset: IPEDS University Directory Data
Back 2 Viz Basics
A bi-weekly project helping those who are newer in the community and just starting out with Tableau. Not limited just to newbies!
Web: Back 2 Viz Basics
Twitter: #B2VB
Week 7: Design a Wireframe
Data Plus Music
A monthly project visualizeing the data behind the music we love!
Web: Data Plus Music
Twitter: #DataPlusMusic
February 2022: MIDI Music Analysis
Games Night Viz
A monthly project focusing on using data from your favorite games.
Web: Games Nights Viz
Twitter: #GamesNightViz
March 2022: Level 3: Powering Up
Workout Wednesday
Build your skills with a weekly challenge to re-create an interactive data visualization.
Web: Workout Wednesday
Twitter: #WOW2022
Week 13: Can you use multiple Mark Layers?
Preppin' Data
A weekly challenge to help you learn to prepare data and use Tableau Prep.
Web: Preppin’ Data
Twitter: #PreppinData
Week 13: Pareto Parameter
Iron Quest
Practice data sourcing, preparation, and visualization skills in a themed monthly challenge.
Web: Iron Quest
Twitter: #IronQuest
March 2022: Music Firsts
Storytelling with Data
Practice data visualization and storytelling skills by participating in monthly challenges and exercises.
Web: Storytelling with Data
Twitter: #SWDChallenge
March 2022: qualitative data
Project Health Viz
Uncover new stories by visualizing healthcare data sets provided each month.
Web: Project Health Viz
Twitter: #ProjectHealthViz
January 2022: One Year of Sleep
Diversity in Data
An initiative centered around diversity, equity & awareness by visualizing provided datasets each month.
Web: Diversity in Data
Twitter: #DiversityinData
March 2022: Refugees in Ukraiune and Women in the Global Workforce
SDG Viz Project
Visualize data about Sustainable Development Goals provided by the World Health Organization.
Web: SDG Viz Project
Twitter: #TheSDGVizProject
Sports Viz Sunday
Create and share data visualizations using rich, sports-themed data sets in a monthly challenge.
Web: Sports Viz Sunday
Twitter: #SportsVizSunday
March 2022: Women in Data
Viz for Social Good
Volunteer to design data visualizations that help nonprofits harness the power of data for social change.
Web: Viz for Social Good
Twitter: #VizforSocialGood
Mar 8, 2022 - Mar 29, 2022: Tap Elderly Women's Wisdom for Youth (TEWWY)
Real World Fake Data
Create business dashboards using provided data sets for various industries and departments.
Web: Real World Fake Data
Twitter: #RWFD
Session 1: Expert, Basic
Viz 2 Educate
Each month, create vizzes on global education syllabus topics as resources for teachers worldwide.
Web: Viz 2 Educate
Twitter: #Viz2educate
February 2022: Food & Nutrition
Makeover Monday
Join the community every Monday to work with a given data set and create better, more effective visualizations.
Web: Makeover Monday
Twitter: #MakeoverMonday
Historias relacionadas
Suscribirse a nuestro blog
Obtenga las últimas actualizaciones de Tableau en su bandeja de entrada.


