DataFam Roundup: June 27 - July 1, 2022


Welcome! Dig into this week's DataFam Roundup—a weekly blog that brings together community content all in one post. As always, we invite you to send us your content—and the DataFam content from your peers that have inspired you! Find the content submission form here.
DataFam content
Sarah Bartlett, Sarah Loves Data: Iron Quest Music Firsts – Recap
Dive into content created by the Tableau Community:
- Kimly Scott, The Flerlage Twins: Iron Viz Reflections
- Kuan-Yu (Iris) Chen: Things to keep in mind as a TED Talk Presenter [SQL & Python & Tableau]
- Alexander Waleczek, Curvediscussion: #WorkoutWednesday and #PreppinData in CRMA
- Dawn Harrington, TechTipsGirl: Tableau Optimization Tips
- Nicole Lillian Mark: Seven principles of UX design to improve your business data visualizations, Part 2
- Andy Kriebel: Back to Viz Basics - A Conversation with Founder Eric Balash
- Mick Yang, Kontinentalist: Meet the Community! Wendy Wang Shijia, data visualization designer, Tableau Public Ambassador and Tableau Visionary
- Sarah Bartlett, Sarah Loves Data: Iron Quest Music Firsts – Recap
- Zach Bowders, Data + Love: Summer Recap '22
- Annabelle Rincon, Rativiz: What happened in Vegas doesn’t stay in Vegas!
- Brian Moore, Do Mo(o)re With Data: Totally Useless Charts & How to Build Them – “Hand-drawn” Bar Charts
- Marc Reid, datavis.blog: Create a Disappearing Container
- Prasann Prem: Tableau Buddy's Data Visualization Mega Bundle
- Johan De Groot, Tableau Forums: Write your own Tableau Extension for your current dashboard
- Tatyana Niklova, Tableau Forums: Beginners Guide to Tableau Prep
- Adam Mico: Tableau Ambassador Nomination Template for 2022
Team Tableau
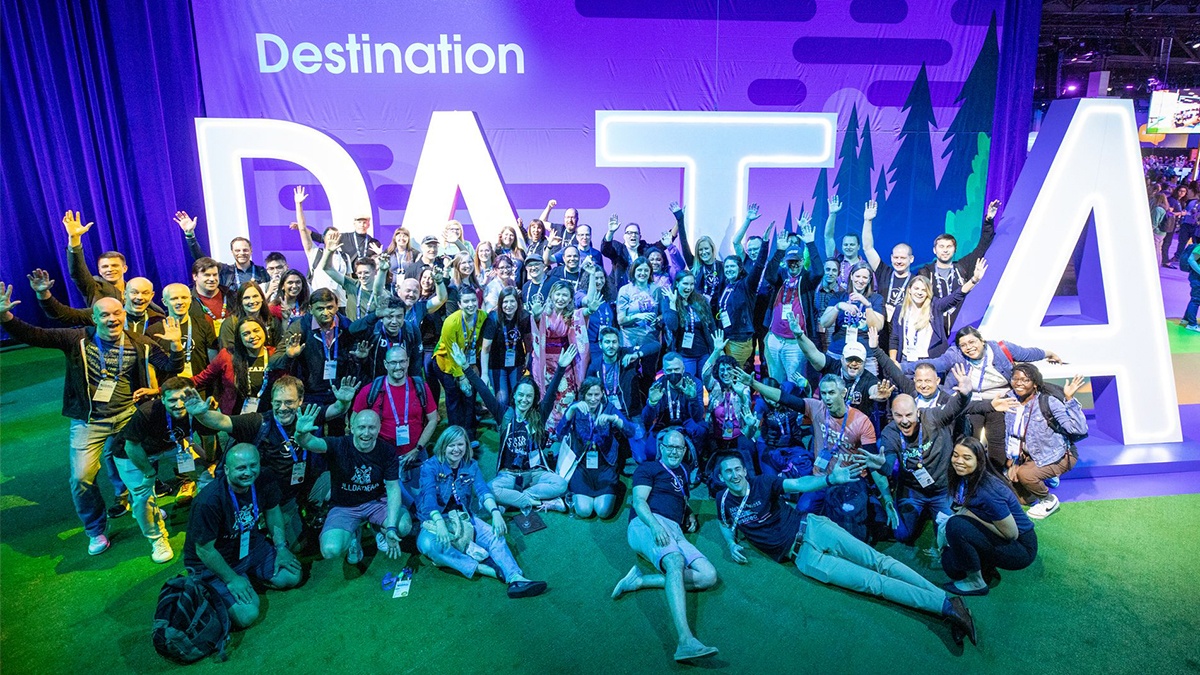
DataFam group photo at Tableau Conference
Upcoming events and community participation
-
VizConnect Tableau Prep Academy: 4 weeks structured program to help you understand foundational knowledge of Tableau prep, Data structure , Data Densification, best practices and Tips & tricks.
- Tableau DataFest 2022: It’s time to sharpen your Tableau skills, propel your career forward, and have some fun at a Tableau DataFest in a city near you. Drawing together key sessions from Tableau Conference ‘22 in Vegas with new bespoke demos and deep dives from local customers and partners, Tableau DataFest is your destination for data.
- Stay up to date with the latest and greatest from the Tableau Community. We'll help you along in your Tableau journey, bring your data skills to the next level, and nurture powerful connections.
- Sign up to be a panelist for the 3charts@3 Live: A Mystery Chart Show featuring topics like personal finance, energy, healthcare and more!
- Data Book Club, Summer 2022 Selection: Invisible Women: Data Bias in a World Designed for Men
Vizzes
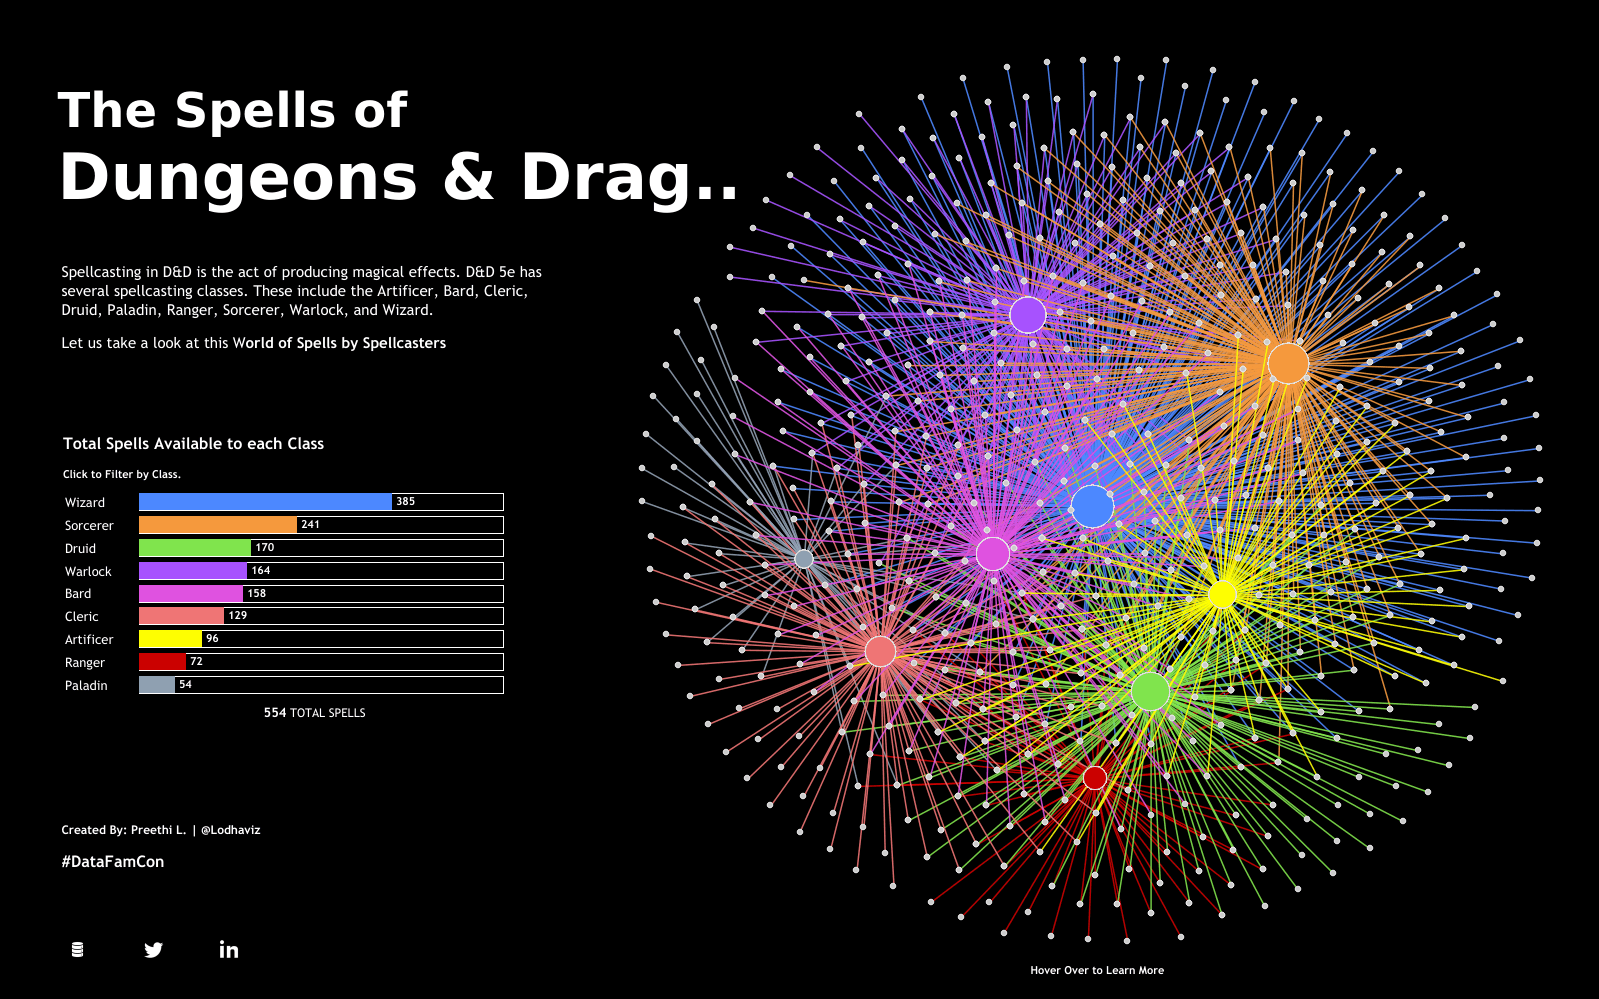
Preethi Lodha: The Spells of DnD
See the latest Viz of the Day, trending vizzes, featured authors, and more on Tableau Public.
Check out some inspirational vizzes created by the community:
- Sam Epley: Tableau Public Featured Authors: Hire Me Edition - June 2022 Cohort
- Rashid Minott: Tableau Visionaries (+ Data Rockstars) with active blogs/websites
- Agata Ketterick: Juneteenth: Not a Paid Holiday in Every State
- Bo McCready: Bar Graphs Vol. 1: Brandy Old Fashioned Sweet
- Josh Hughes: HR Attrition Dashboard
- Priya Padham: Pixar
- Autumn Battani: Insurance Dashboard
- Preethi Lodha: The Spells of DnD
- P A T H | We Are Data People: Basic Education in Brazil
- Muhammad Azhar: HR Attrition Dashboard
- Kimly Scott: The Grand Tour
Community Projects
Back 2 Viz Basics
A bi-weekly project helping those who are newer in the community and just starting out with Tableau. Not limited just to newbies!
Web: Back 2 Viz Basics
Twitter: #B2VB
Week 12: Diverging Values
Workout Wednesday
Build your skills with a weekly challenge to re-create an interactive data visualization.
Web: Workout Wednesday
Twitter: #WOW2022
Week 26: Let’s make a dynamic relative filter
Preppin' Data
A weekly challenge to help you learn to prepare data and use Tableau Prep.
Web: Preppin’ Data
Twitter: #PreppinData
Week 26: Making Spotify Data Spotless
DataFam Con
A monthly challenge covering pop culture and fandoms.
Web: DataFam Con
Twitter: #DataFamCon
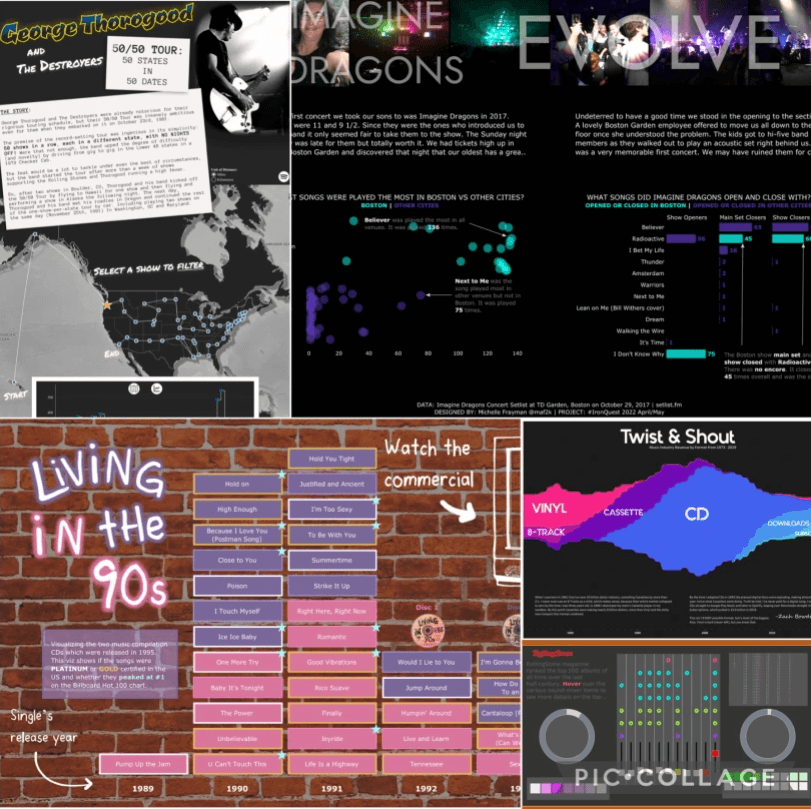
June 2022: Dungeons and Dragons
EduVizzers
A monthly project connecting real education data with real people.
Web: Eduvizzers
June 2022: Chicago Public Schools – Progress Report Cards (2011-2012)
Games Night Viz
A monthly project focusing on using data from your favorite games.Web: Games Nights Viz
Twitter: #GamesNightViz
July 2022: Nostalgic Games
Data Plus Music
A monthly project visualizing the data behind the music we love!
Web: Data Plus Music
Twitter: #DataPlusMusic
February 2022: MIDI Music Analysis
Iron Quest
Practice data sourcing, preparation, and visualization skills in a themed monthly challenge.
Web: Iron Quest
Twitter: #IronQuest
July 2022: Nostalgic Games
Storytelling with Data
Practice data visualization and storytelling skills by participating in monthly challenges and exercises.
Web: Storytelling with Data
Twitter: #SWDChallenge
July 2022: think globally
Project Health Viz
Uncover new stories by visualizing healthcare data sets provided each month.
Web: Project Health Viz
Twitter: #ProjectHealthViz
June 2022: Monthly Cannabis Exposures
Diversity in Data
An initiative centered around diversity, equity & awareness by visualizing provided datasets each month.
Web: Diversity in Data
Twitter: #DiversityinData
May and June 2022: Diversity in Art
Sports Viz Sunday
Create and share data visualizations using rich, sports-themed data sets in a monthly challenge.
Web: Sports Viz Sunday
Twitter: #SportsVizSunday
June 2022: DataPlusMusic mashup!
Viz for Social Good
Volunteer to design data visualizations that help nonprofits harness the power of data for social change.
Web: Viz for Social Good
Twitter: #VizforSocialGood
Real World Fake Data
Create business dashboards using provided data sets for various industries and departments.
Web: Real World Fake Data
Twitter: #RWFD
Season 2: HR Attrition
Viz 2 Educate
Each month, create vizzes on global education syllabus topics as resources for teachers worldwide.
Web: Viz 2 Educate
Twitter: #Viz2educate
Makeover Monday
Join the community every Monday to work with a given data set and create better, more effective visualizations.
Web: Makeover Monday
Twitter: #MakeoverMonday
SDG Viz Project
Visualize data about Sustainable Development Goals provided by the World Health Organization.
Web: SDG Viz Project
Twitter: #TheSDGVizProject
Historias relacionadas

DataFam Roundup December 16-20, 2024

DataFam Roundup: December 9-13, 2024

DataFam Roundup: November 25-December 6, 2024
Suscribirse a nuestro blog
Obtenga las últimas actualizaciones de Tableau en su bandeja de entrada.