DataFam Roundup: August 2 - 6, 2021
Dig into the latest DataFam Roundup—a weekly blog that brings together community content all in one post. As always, we invite you to send us your content—and the DataFam content from your peers that have inspired you! Find the content submission form here.
DataFam content
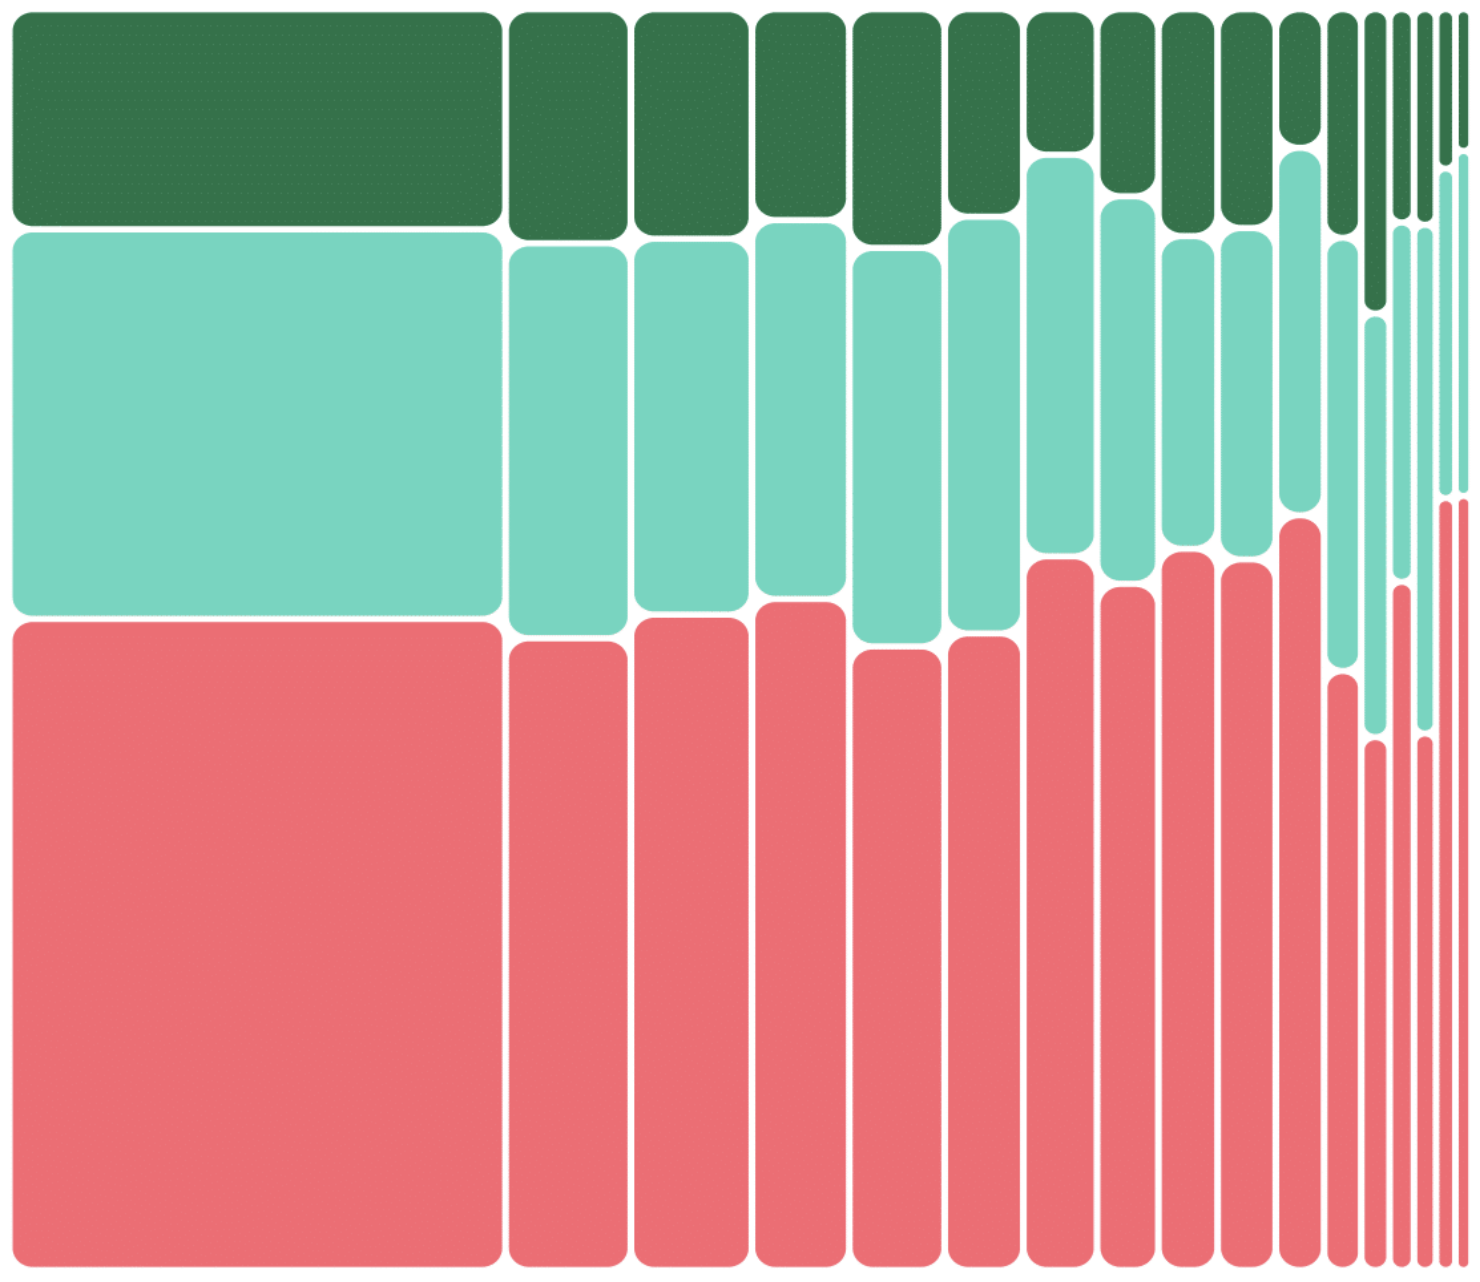
Luke Stanke, Tessellation: How to Use Tableau Marimekko Chart Templates
Dive into content created by the Tableau Community:
- Jason Khu, KhuZ Life: My Tableau Student Ambassador Experience
- Adam Mico: The Ultimate Motivation of a Lifeline | A Tableau Visualization Tutorial
- Mark Wu, Scaling Tableau to Enterprise: Tableau Row Level Level
- Spencer Baucke, Tessellation: Forecasting Inventory in Tableau Using Relationships
- Harry Cooney, The Information Lab Ireland: How to create a Percent of Total Chart in Tableau
- Dzifa Amexo, As Dzif: Where to Learn Tableau | 5 Free Beginner Tableau Resources
- Eva Murray: Defining and Building a Data Culture
- Jennifer Rash, Rash Design: The Universal Language of Visualization
- Andrés Quiroz Sánchez: Media Torta | en Tableau Desktop
- Luke Stanke, Tessellation: How to Use Tableau Marimekko Chart Templates
- Tim Ngwena, Tableau Tim: End-of-Maintenance Accelerated for Tableau Versions 2019.3.x - 2020.3.x
Vizzes
Ana Milana: Women in Bank Notes
Catch this week’s Viz of the Days here and subscribe to get them emailed directly to your inbox.
Check out some inspirational vizzes created by the community:
-
Ben Radburn: The Showrunners of Doctor Who
-
Ana Milana: Women in Bank Notes
-
Christian Felix: Tableau Visual Resume Templates
-
Kevin Flerlage: The Tableau Zen Master Collection
Makeover Monday
Join the community every Monday to work with a given data set and create better, more effective visualizations.
Web: Makeover Monday
Twitter: #MakeoverMonday
Week 31: Bike Collisions in London
Workout Wednesday
Build your skills with a weekly challenge to re-create an interactive data visualization.
Web: Workout Wednesday
Twitter: #WOW2021
Week 30: Can You Find the Needle in the Haystack?
Sports Viz Sunday
Create and share data visualizations using rich, sports-themed data sets in a monthly challenge.
Web: Sports Viz Sunday
Twitter: #SportsVizSunday
August 2021: UFC
Iron Quest
Practice data sourcing, preparation, and visualization skills in a themed monthly challenge.
Web: Iron Quest
Twitter: #IronQuest
August 2021: Travel & Vacations
Storytelling with Data
Practice data visualization and storytelling skills by participating in monthly challenges and exercises.
Web: Storytelling with Data
Twitter: #SWDChallenge
July 2021: exploring unit charts
Project Health Viz
Uncover new stories by visualizing healthcare data sets provided each month.
Web: Project Health Viz
Twitter: #ProjectHealthViz
SDG Viz Project
Visualize data about Sustainable Development Goals provided by the World Health Organization.
Web: SDG Viz Project
Twitter: #TheSDGVizProject
Goal 17: Partnerships for the Goals
Preppin' Data
A weekly challenge to help you learn to prepare data and use Tableau Prep.
Web: Preppin’ Data
Twitter: #PreppinData
Week 29: PD x WOW - Tokyo 2020 Calendar
Real World Fake Data
Create business dashboards using provided data sets for various industries and departments.
Web: Real World Fake Data
Twitter: #RWFD
Dataset #12: Hospitality
Viz 2 Educate
Each month, create vizzes on global education syllabus topics as resources for teachers worldwide.
Web: Viz 2 Educate
Twitter: #Viz2educate
Topic: Microbiology
Diversity in Data
An initiative centered around diversity, equity & awareness by visualizing provided datasets each month.
Web: Diversity in Data
Twitter: #DiversityinData
June 2021: Pride Month
Viz for Social Good
Volunteer to design data visualizations that help nonprofits harness the power of data for social change.
Web: Viz for Social Good
Twitter: #VizforSocialGood
Historias relacionadas
Suscribirse a nuestro blog
Obtenga las últimas actualizaciones de Tableau en su bandeja de entrada.


