Critiquing data visualizations: A discussion on channeling empathy and productivity
This post comes from Alli Torban, Data Visualization Designer and host of the Data Viz Today Podcast. A version of this post was originally published on the Data Visualization Society Medium Page. Original illustrations in this article are by Martin Telefont.
Critique is hard. Receiving it and giving it is full of risk and nuance, especially for the untrained. Because of the diverse backgrounds found among people creating data visualizations, the chances are high that you’ll work with someone who wasn’t trained to give or receive critique. I’m in the never-been-trained camp. I’m part of the Data Visualization Society—a community of data viz professionals—that has a Slack channel where we discuss interesting topics like this. My ears perked up when the bi-weekly discussion topic was “critique —how do we best give it and receive it?”
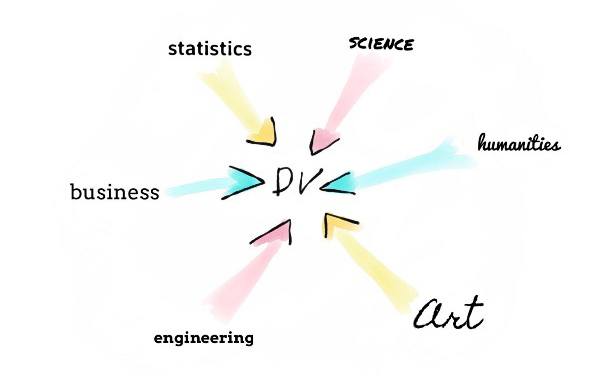
When I first started creating visualizations, I’d panic at the thought of getting critiqued. It felt like anything was fair game, so I didn’t know what to expect.
But I’ve since learned two very important things:
- Not all critique is created equal: For example, it’s reasonable to consider the perspective and knowledge of the giver before absorbing the critique.
- Growth is uncomfortable, and it always includes some form of critique (so bring it on!).
This knowledge helped me embrace critique and the community discussion gave me a fuller picture of what a productive critique looks like. Below, I had the honor to summarize the thoughts of these generous, experienced practitioners in the Data Visualization Society, but you’ll see that there are still open questions—so I encourage you to join the conversation.
Defining critique
Critique is an analytical evaluation of what works and what doesn’t.
Open question: We’re still discussing how critique is different than feedback. Is feedback just general impressions or opinions of your work, while “critique” is a formal review of design choices?
Preparing for productive critique
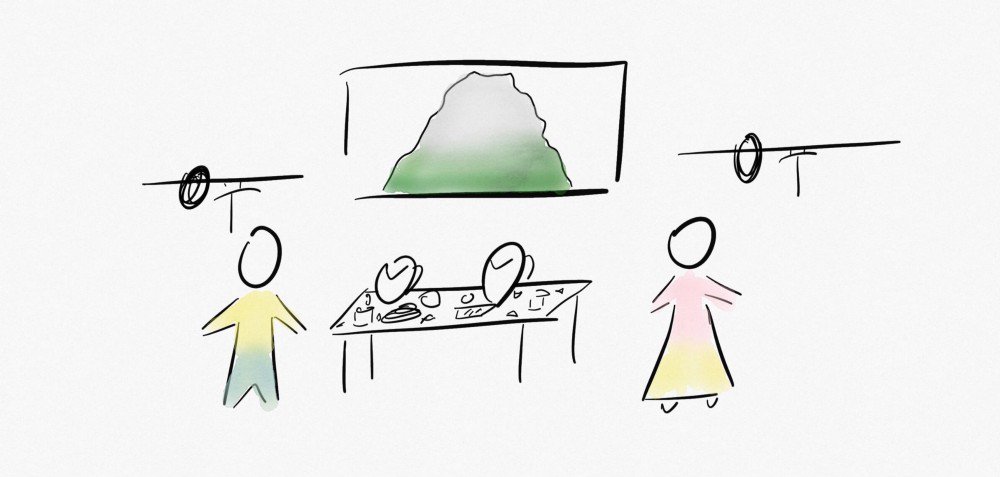
As the receiver of critique…
Get in the right mindset. Critique is valuable and helps you grow, so decide to seek it out. We all have a good amount of impostor syndrome, which makes critique feel personal. But if we want to grow personally as well as grow the data visualization field, we need to prioritize receiving critique. Finding people you trust or a mentor can help with impostor syndrome/sensitivity.

Gather your “cast of characters.” It’s important to recognize the character that you’re talking to during the critique (e.g. does this person really know which chart type would work better?). This can include:
- You as the creator
- Future you (who has fresh eyes)
- Other data viz practitioners (they understand the struggles)
- Trusted mentors/colleagues (they understand your constraints)
- Someone unfamiliar with your work (ideally from your target audience)
As the giver of critique…
Consider if you should ask permission to critique the work.
Open question: Do you always need to ask permission to give critique? On one hand, it shows respect to the creator and increases the likelihood they’ll listen openly. On the other hand, it can limit productive conversations and it might harm the public by letting it go.
During the critique
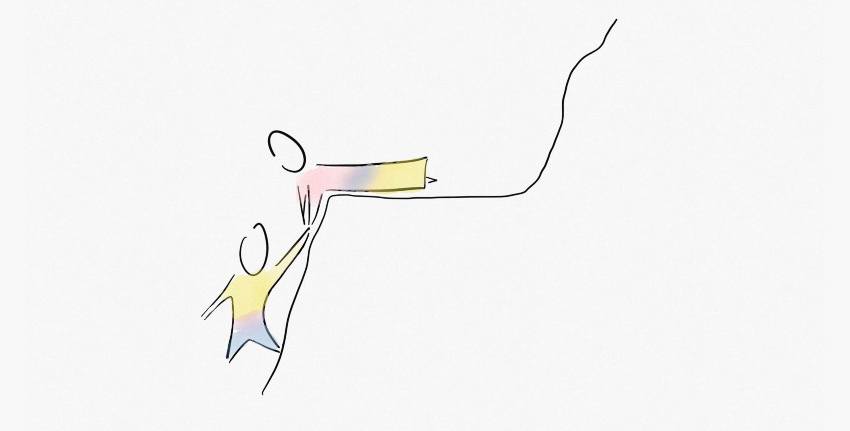
As the receiver of critique…
State your objective when you ask for critique and engage your cast of characters. First, define what you want them to critique. For example, who is the audience? What do you want them to know? Is there a specific element that you want feedback on or don’t want feedback on?
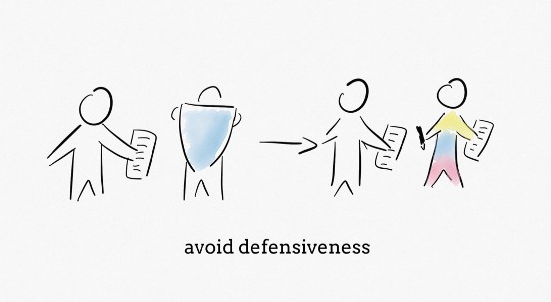
Fight the temptation to be defensive. Rather than explain yourself, try to lead with “tell me more.” Even rude or terse critique can be useful, and it would be a shame to lose the chance to improve because you’re busy responding or taking it personally.
As the giver of critique…
State the intention of your critique before giving your assessment of the work. What are you hoping to improve and why?
Open question: Is this necessary if the receiver has already set the objectives?
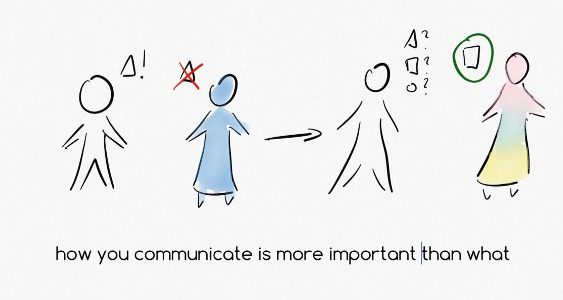
Evaluate your communication tactics: Many people emphasized that how you communicate is often more important than what you’re communicating. Here are some hard-won tips for delivering your critique:
- Try using phrases like “I like…I wish…I wonder…” This is an approach developed in Stanford’s d.school that is used to explain an intuitive response to details. It requires that you start all feedback with either “I like…”, “I wish…” or “I wonder…” to produce a structured dynamic between giver and receiver.
- State your suggestion as a question for the receiver to take or leave.
- Try to give critique in person (or with audio) so the receiver can hear your tone.
Be specific: In the collective experience, critiques are much more productive when the giver is as specific as possible. Rather than saying, “this could be confusing,” try stating what is specifically confusing to you. A useful exercise is to talk through how you’re experiencing the visualization and weigh the pros and cons of each design compromise.
Responding to critique
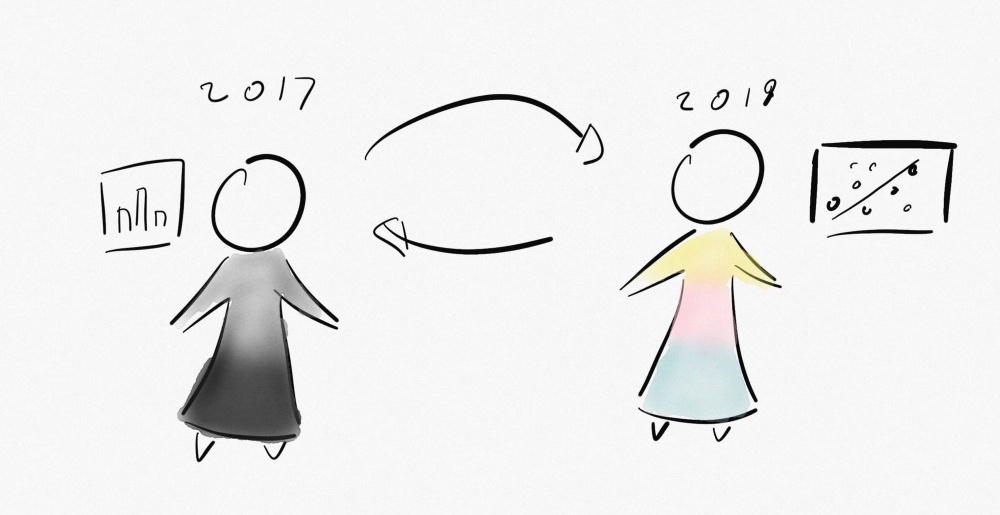
Should you do a redesign as a critique? This approach is described in detail in this article by Fernanda Viégas and Martin Wattenberg. If you decide to do a redesign, make sure you state your goal of the redesign and any data simplifications that you performed. Be kind and open with the creator (especially with newbies). There are pros and cons to redesigns:
- Pro: Easier to show what you mean and conveys that you’re invested in the solution.
- Con: It can be very time-consuming.
Interesting ideas from the Data Visualization Society
Try a “backward” redesign where you redesign a viz and remove key elements that were effective to show how effective they were (another great idea from Viégas and Wattenberg).
Do a critique of your own, old work! Remember that one of those people at the table above was your future self, and developing a habit of critiquing your former work will not only make you better at critique, it will make you more comfortable receiving it.
Join the conversation!
This conversation about productive critique has helped me see the dynamic between giver and receiver more clearly and also notice the nuances of the relationship. I hope this has given you the courage and some tools to execute more productive critiques in your work.
Please leave a comment if we missed any of those aforementioned nuances. Join the Data Visualization Society for more data viz conversations and an invitation to our Slack channel.
Many, many thanks to Martin Telefont for the wonderful illustrations, Mara Averick and Elijah Meeks for your keen editing, and the members of the Data Visualization Society for sharing your expertise.
Historias relacionadas
Suscribirse a nuestro blog
Obtenga las últimas actualizaciones de Tableau en su bandeja de entrada.


