Creating Animated Data Visualizations with Tableau Public
Visualizing data helps people spot trends, patterns, and outliers that you may not easily see in a spreadsheet, and can be an effective form for communicating stories. When you add interactivity to a visualization, you empower others to freely explore the data and form a deeper understanding. As helpful as interactive visualization can be for data analysis and storytelling, sometimes filtering and sorting makes changes to a visualization which aren’t easy to understand.
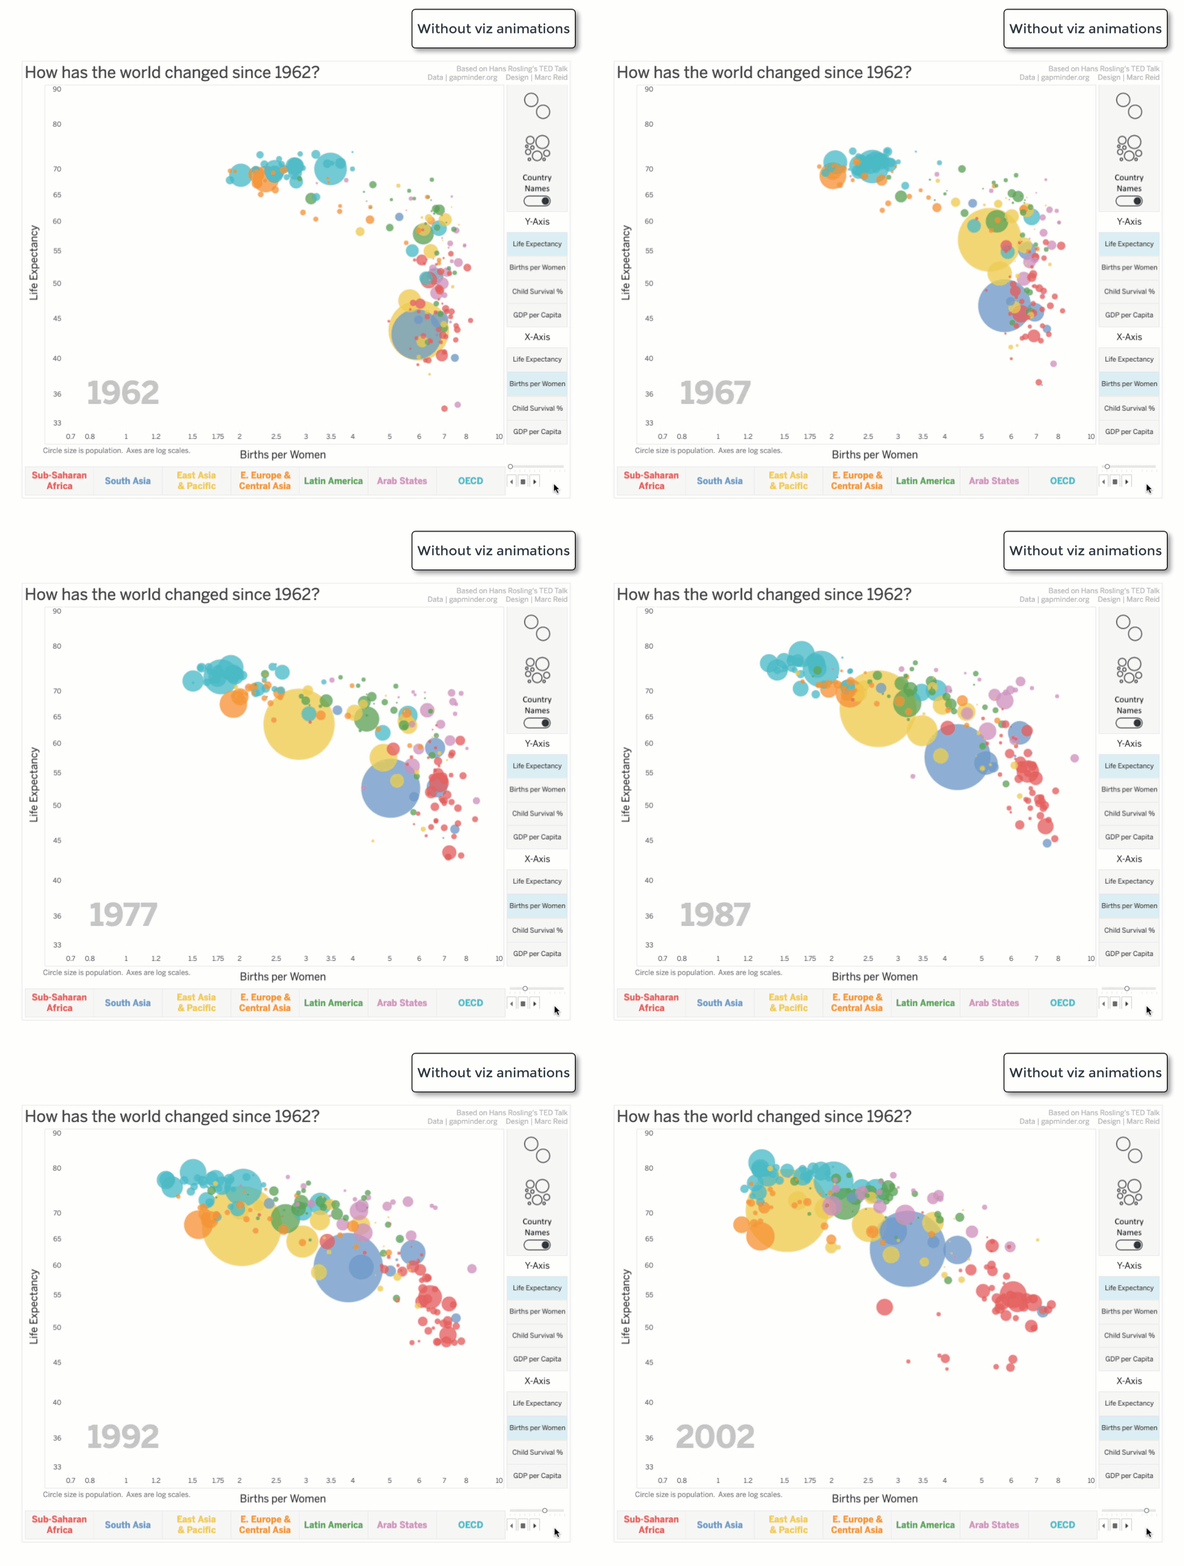
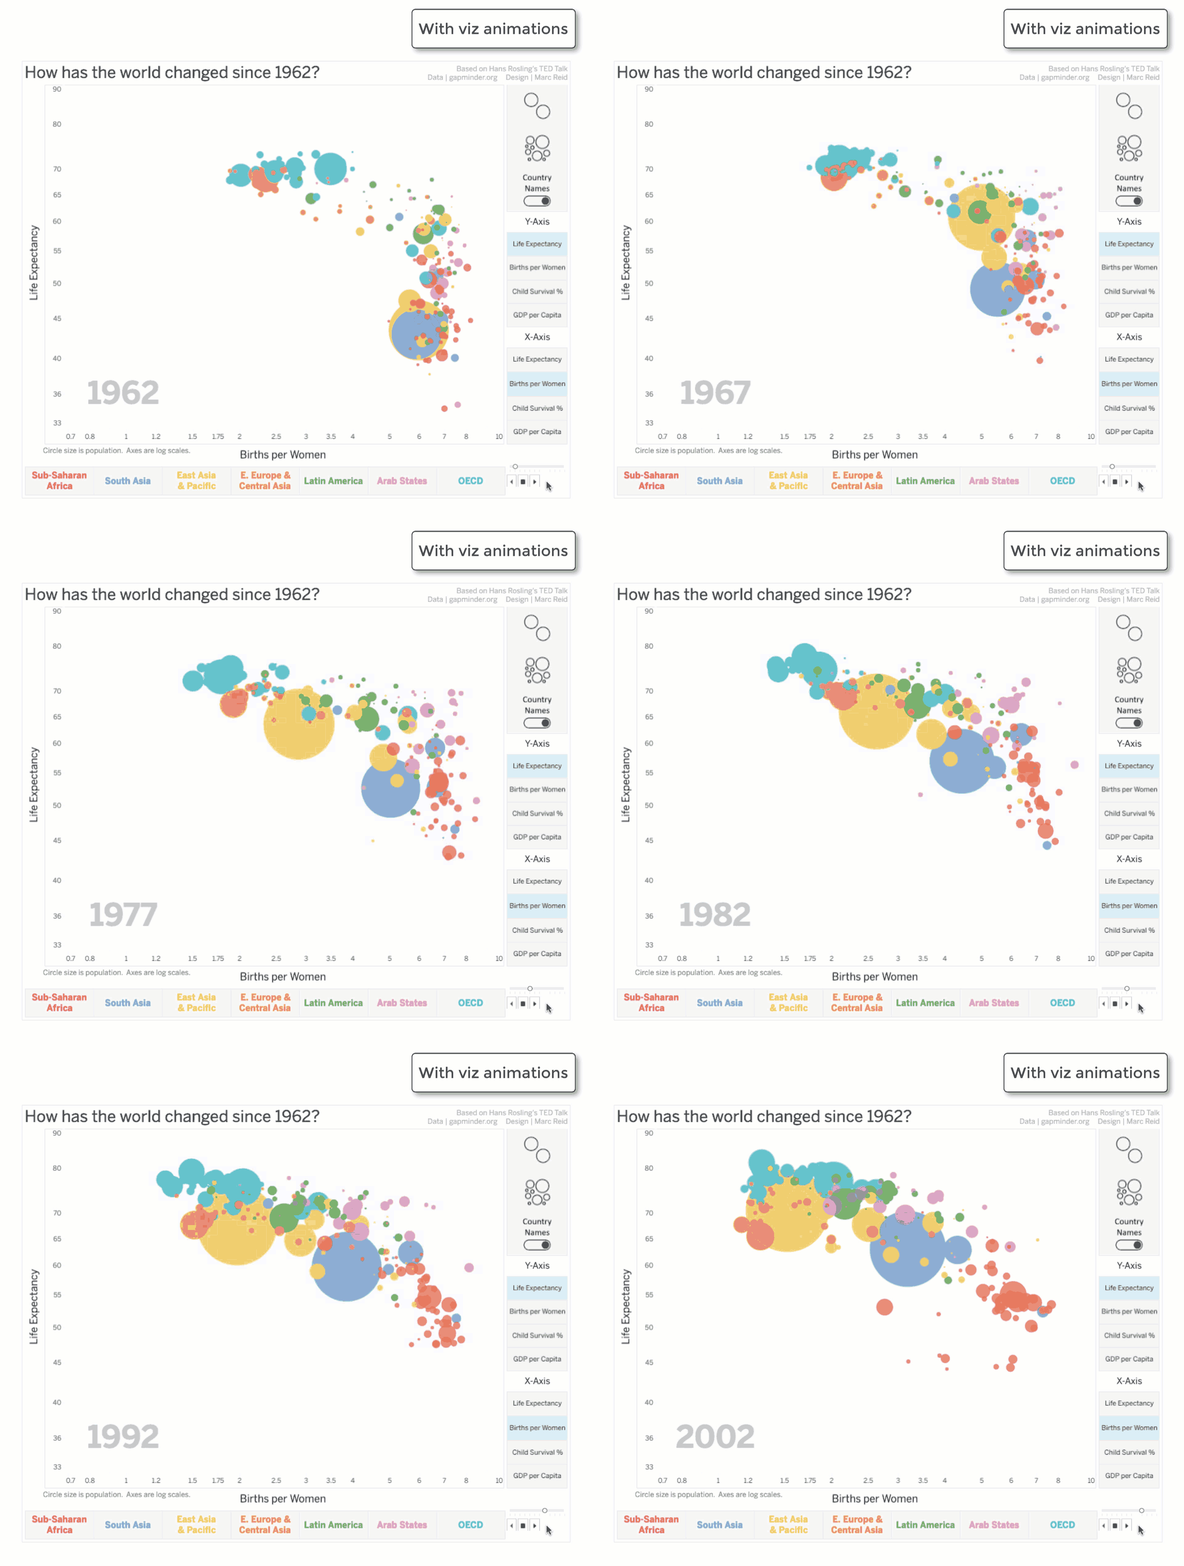
Viz animations help you see and understand data as it changes. Sorting, filtering, adding fields, and other actions smoothly animate your visualizations. These animations apply to many different chart types: lines, circles, bars, oh my! In the example below created by Marc Reid, animation makes it easy to follow the circles representing each country in the dataset as time changes.


Animations are powerful for storytelling when combined with pages, which allow you to automatically advance through states. Examples of how this could be used are for comparing dimension values or showing change over time. The example above uses pages with animation to show how births per woman and life expectancy change by year for many countries.
How to add animations to your Tableau Public vizzes
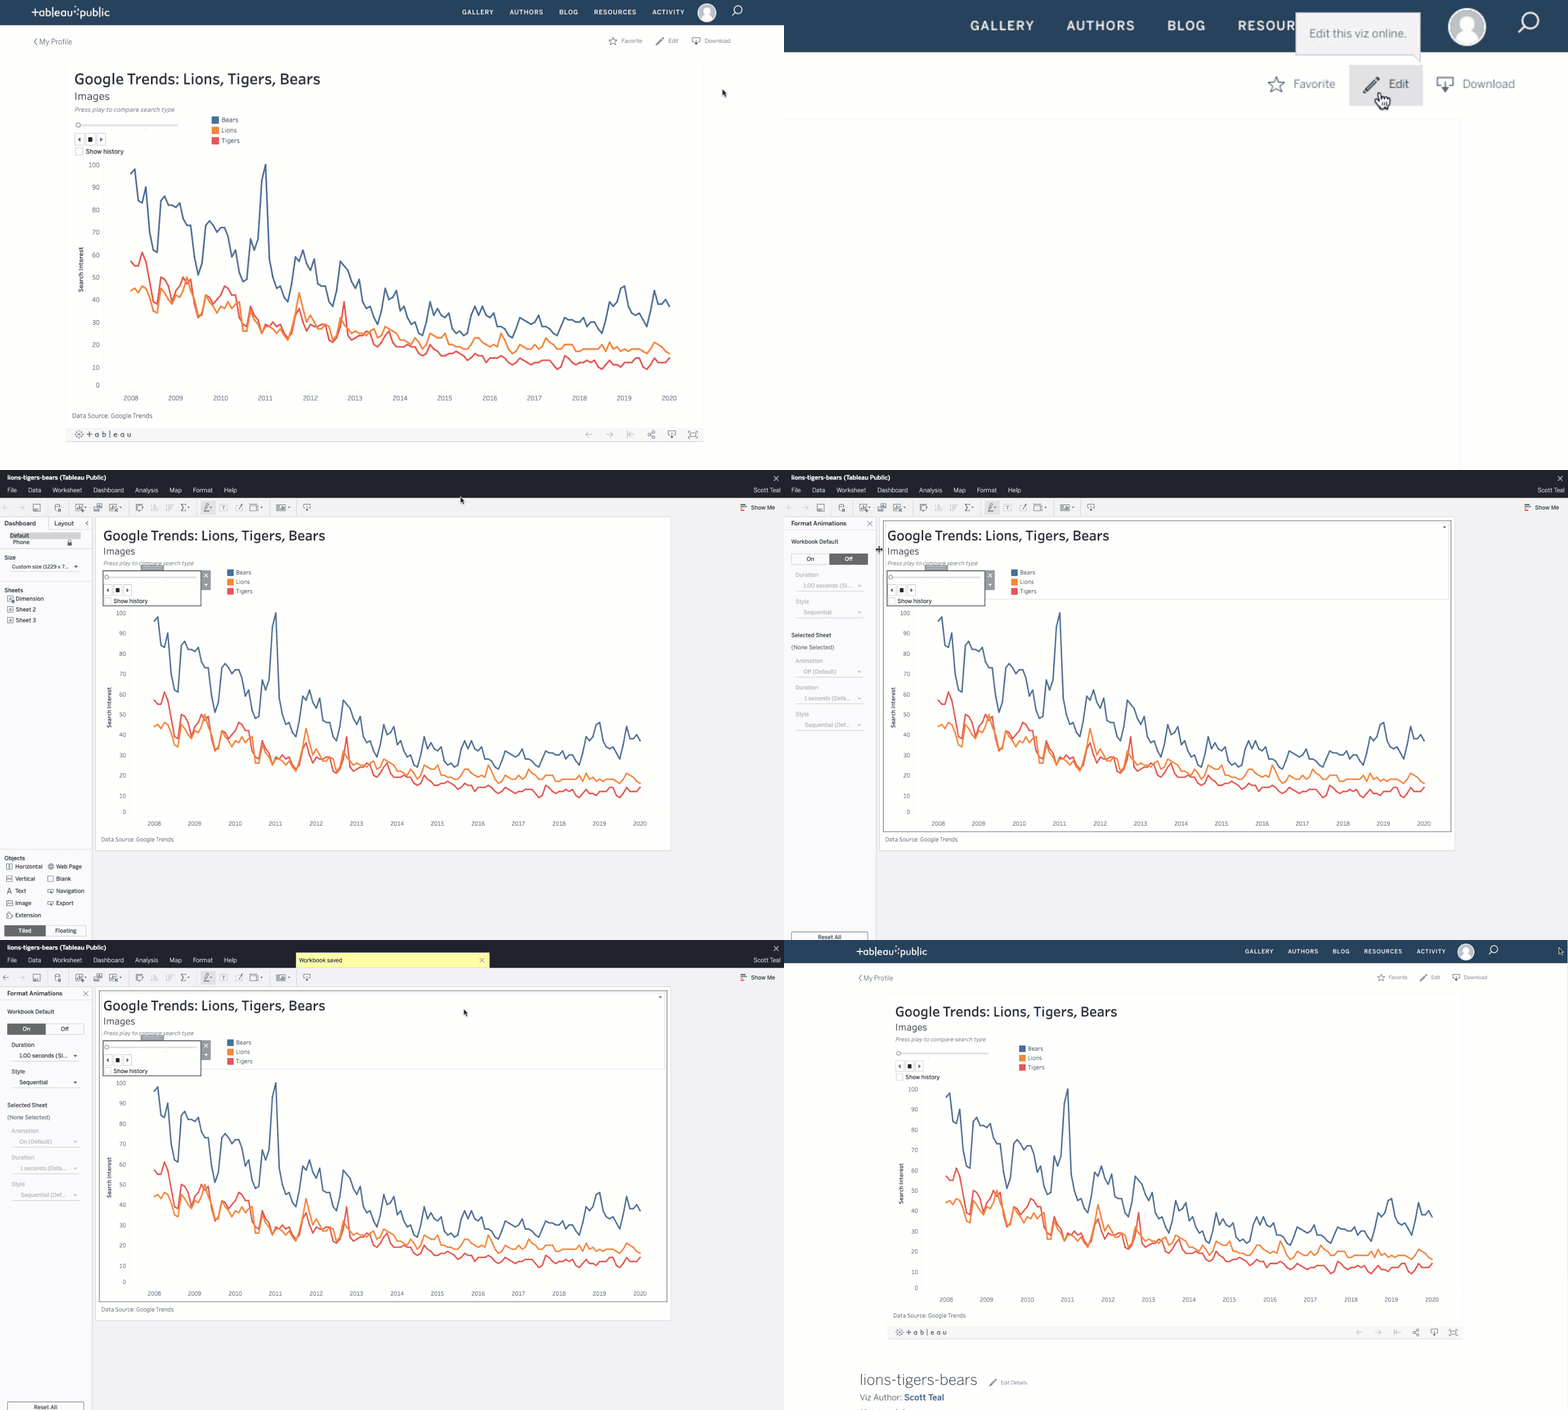
If you already have vizzes saved to your Tableau Public profile, adding animations to your vizzes is easy.
- Sign in to your profile.
- Click on a viz in your profile.
- Click ‘Edit’ to edit the viz in your browser.
- Click Format > Animations > On
- Save the viz, and close out of web authoring.

If you don’t already have a Tableau Public profile, no problem! You too can start using viz animations.
- Create a profile.
- Download Tableau Desktop Public Edition.
- Get some data (check out our Sample Data page)
- Create a chart with drag-and-drop.
- Click Format > Animations > On
- When finished authoring, save the viz to your Tableau Public profile.
You can adjust the duration and sequence settings, and you can choose to turn animations on/off for the entire workbook or specify only specific sheets. For more information about using viz animations, check out these resources:
- Tableau Help: Formatting Animations
- Blog: "Animated Transitions in Tableau" by Marc Reid
- Video: Data Stories and Animation by Jock Mackinlay
- Video: Tableau in Motion: Tableau's New Native Viz Animations by Paul Isaacs and Phil Naranjo
Get inspired by animations from the community
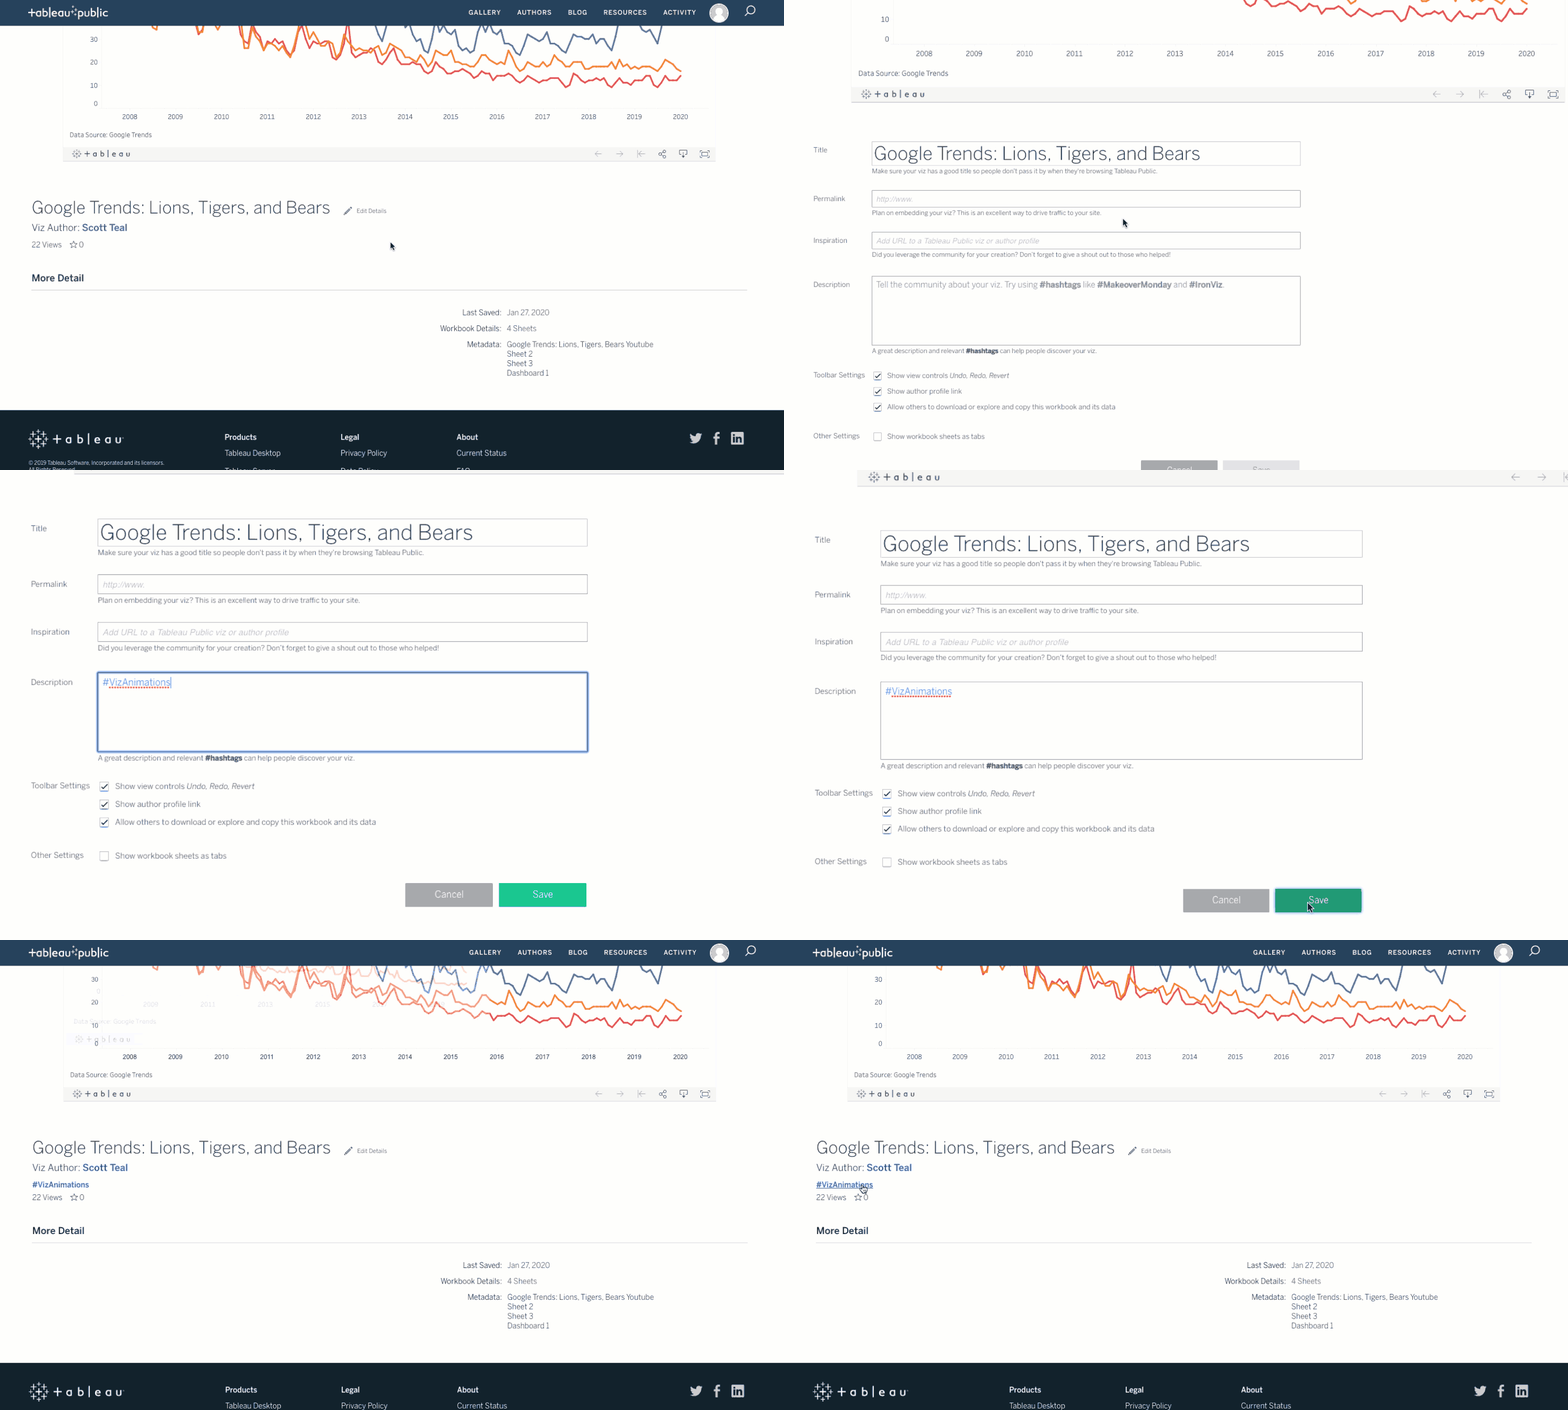
The example above comparing Google Trends data is only one example. Check out this gallery containing a variety of amazing vizzes using new features including viz animations, dynamic parameters, and buffer calculations. Want to submit a viz of your own to be included in the gallery? Just add any of these hashtags to the description of your viz:

Curious to learn about the other features included in Tableau 2020.1? Check out this page for more information.
Historias relacionadas
Suscribirse a nuestro blog
Obtenga las últimas actualizaciones de Tableau en su bandeja de entrada.


