Climate and socioeconomic data are merged in new interactive tool for cities
Cities want to protect people and property from the impacts of climate change, but usually don't have the capacity to wade through reams of demographic, economic, and climate data required to plan for the long-term.
At Headwaters Economics, we are committed to helping cities advance climate adaptation. A nonpartisan research organization, we provide socioeconomic data and insights to agencies, jurisdictions, elected officials, businesses, and other organizations.
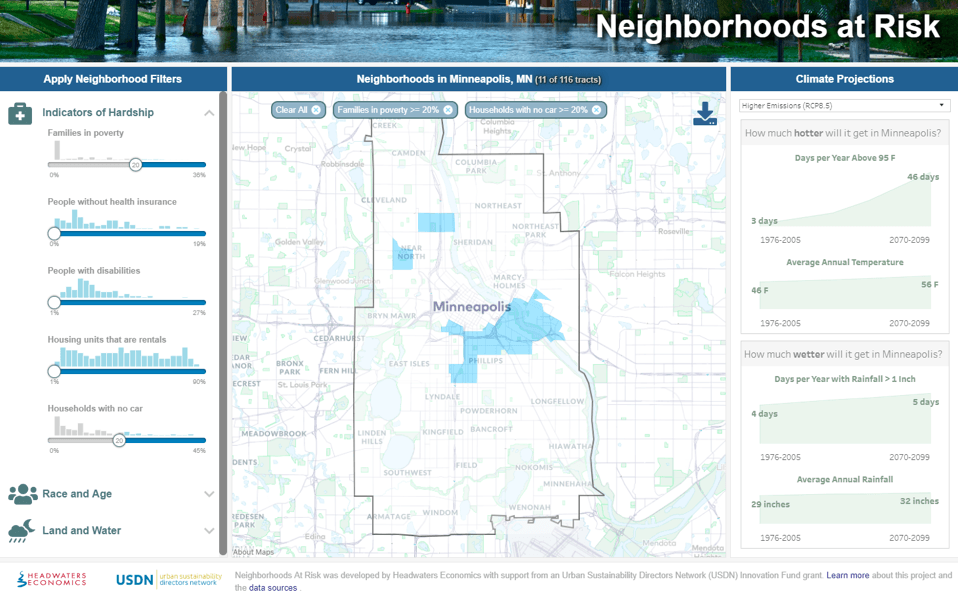
We designed Neighborhoods at Risk—an interactive, web-based tool—to provide city planners and others with direct access to up-to-date, practical, neighborhood-level information about residents’ vulnerability to heat, drought, flooding, and other climate impacts. Climate data is overlaid on detailed demographic data that focus particularly on at-risk populations.
Neighborhoods at Risk was designed in collaboration with staff from 18 Midwestern and mid-Atlantic cities to ensure that it addresses the needs of its users. Simplicity and flexibility were the guiding themes. The interactive tool allows users to determine and manipulate the data that are relevant to their specific situation and download customized maps. For example, the geographic location of residents who are unable to speak English may be an important consideration for emergency operations and hazard mitigation plans, but not at all relevant to a city’s tree canopy assessment.
Cities access current data with Tableau
Keeping data fresh is critical. Neighborhoods at Risk is designed to be embedded in cities’ own websites (for example, see Minneapolis’ vulnerability assessment site), but data are linked to Headwaters Economics’ servers. Maintaining current socioeconomic data is part of our core capacity—we update socioeconomic information continually as new data are released by the U.S. Census Bureau and other government agencies.
The data on climate history and projections displayed in Neighborhoods at Risk were generously provided by the North Carolina Institute for Climate Studies (NCSU/CICS-NC) and represent LOCA Scenarios developed for the latest National Climate Assessment.
To bring the importance of these issues home to city planners and residents alike, translating complex data into simple, understandable maps, charts, and tables is critical. Tableau allows us to quickly develop practical decision support tools for cities, so they can solve problems. Neighborhoods at Risk is built as a JavaScript React application that leverages the Tableau JavaScript API. The geniuses at DataBlick helped us get the project off the ground, and the development team at Headwaters Economics took it through the finish line. The result is friendly, engaging, and even mobile-friendly—and most importantly, it has been met with great enthusiasm by our city partners.

A platform with many uses
Our goal is to increase cities’ capacities to adapt to climate change and protect their residents in the years to come. The 18 partner cities that participated in designing Neighborhoods at Risk anticipate using the tool to:
- Develop city-wide vulnerability assessments
- Improve emergency operations and hazard mitigation plans
- Identify places for engaging in temperature-reducing projects such as green spaces and tree planting
- Manage storm water
- Locate cooling shelters
- Identify priority zones for sewer districts
- Identify neighborhoods for energy retrofits and investments in weatherization
- Initiate cross-departmental conversations between police, fire, water, and public works
The tool is also useful for improving cities’ public outreach efforts. For example, cities may use the tool to:
- Target at-risk neighborhoods for recruiting participants for trainings
- Identify neighborhoods where cities can reduce barriers to participation (lack of child care, transportation, etc.) that prevent citizen involvement
- Select neighborhoods for investment in local leadership and community organizations
- Identify peer neighborhoods confronting similar threats for shared learning
- Prioritize and justify neighborhood-level project proposals for small grants
- Provide a data-driven resource, arming community leaders with knowledge of trends and how to work with socioeconomic changes to further their goals
Next steps for Headwaters Economics
Looking ahead, Headwaters Economics will continue to expand and adapt Neighborhoods at Risk to advance climate adaptation by:
- Supporting Existing Partners: We will continue to collaborate with our original cohort of 18 cities – providing support, learning how they use Neighborhoods at Risk, and tweaking the tool as needed.
- Adding Cities: We will include data for additional US cities as they strategize how to adapt to climate change.
- Enabling Customization: Future iterations of Neighborhoods at Risk will be more customizable according to cities’ specific needs – giving cities more control of the data presented in their custom interface.
Editors note: Headwaters Economics is an independent nonprofit research group that works to improve community development and land management decisions. It is based in Bozeman, Montana. The organization's work is supported in part by the Tableau Foundation.
Historias relacionadas
Suscribirse a nuestro blog
Obtenga las últimas actualizaciones de Tableau en su bandeja de entrada.


