
Top 10 Principles of Business Analytics
From the world’s greatest data community
Our data enthusiasts want to let you in on a secret: Solving business problems with data isn’t as difficult as you may think.
For the thousands of data devotees who belong to the Tableau Community, data and analytics aren’t just niceties. They are key to finding easy answers to tough questions.
At Tableau, we’re on a mission to help all people achieve success with data—including you. To help you get there faster, we’ve assembled a team of data
leaders from the world’s greatest data community to share their top 10 principles of business analytics. Straight from Tableau experts, these proven practices serve as the foundation for successfully solving business challenges with data.
Use these 10 principles as your guide to navigate questions and address challenges to working with data. Apply them again and again to reach your data goals faster and make smarter decisions.
Principle #1
Analyse and iterate to answer business questions.
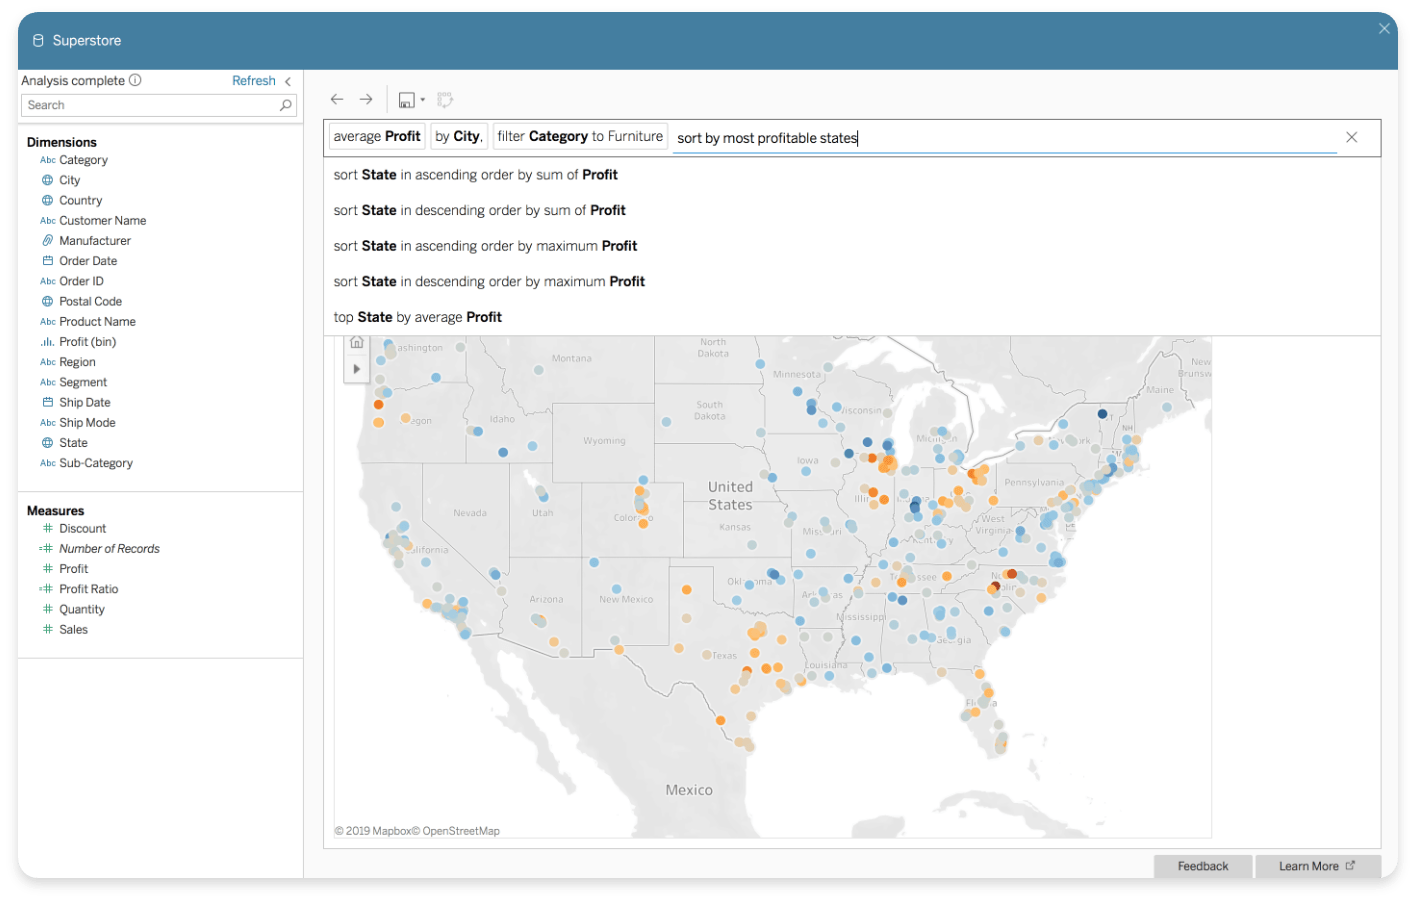
"The principal value of visual analytics is the ability to quickly answer your own business questions. To get to the bottom of your business problem, you must continually ask and answer questions of your data until you find the insights you need. The ability to ask why again and again brings a real fluidity to your analysis. I call it Analyse and Iterate: Each question unearths new questions until you find the answer that you’re looking for.
With the power of data at their fingertips, anyone in your organisation—from the CEO to the analyst—can ask why. The CEO can interact with easy-to-understand dashboards or use natural language capabilities, such as Ask Data in Tableau, to quickly answer strategic business questions. Analysts and analytics users can leverage any business intelligence platform—Tableau is my personal favourite—to ask deeper questions of their data to discover new business insights."


Principle #2
Business needs come first.
"Time flies when you’re having fun—and analysing data is a lot of fun. However, in business you must ensure that the visualisations you create, and the data-driven insights you discover, are truly necessary. No matter how many or how beautiful the visualisations you create, if they don’t match the needs of your business, you’ll be unable to answer the question that frequently arises: So, what did we learn?
When you visually analyse data you need to understand exactly what’s required of that visualisation and ensure that it meets your business needs, and the resulting insights must be clear and simple enough for your audience to understand. Do this as quickly as possible.
Additionally, think about how data visualisation can go beyond your business needs, giving you further insight. It will make you work more fun and if the needs of your business change or expand, you’ll have a data-driven answer ready at hand."

When you visually analyse data you need to understand exactly what’s required of that visualisation and ensure that it meets your business needs, and the resulting insights must be clear and simple enough for your audience to understand.
Principle #3
Practice. Experiment. Grow.
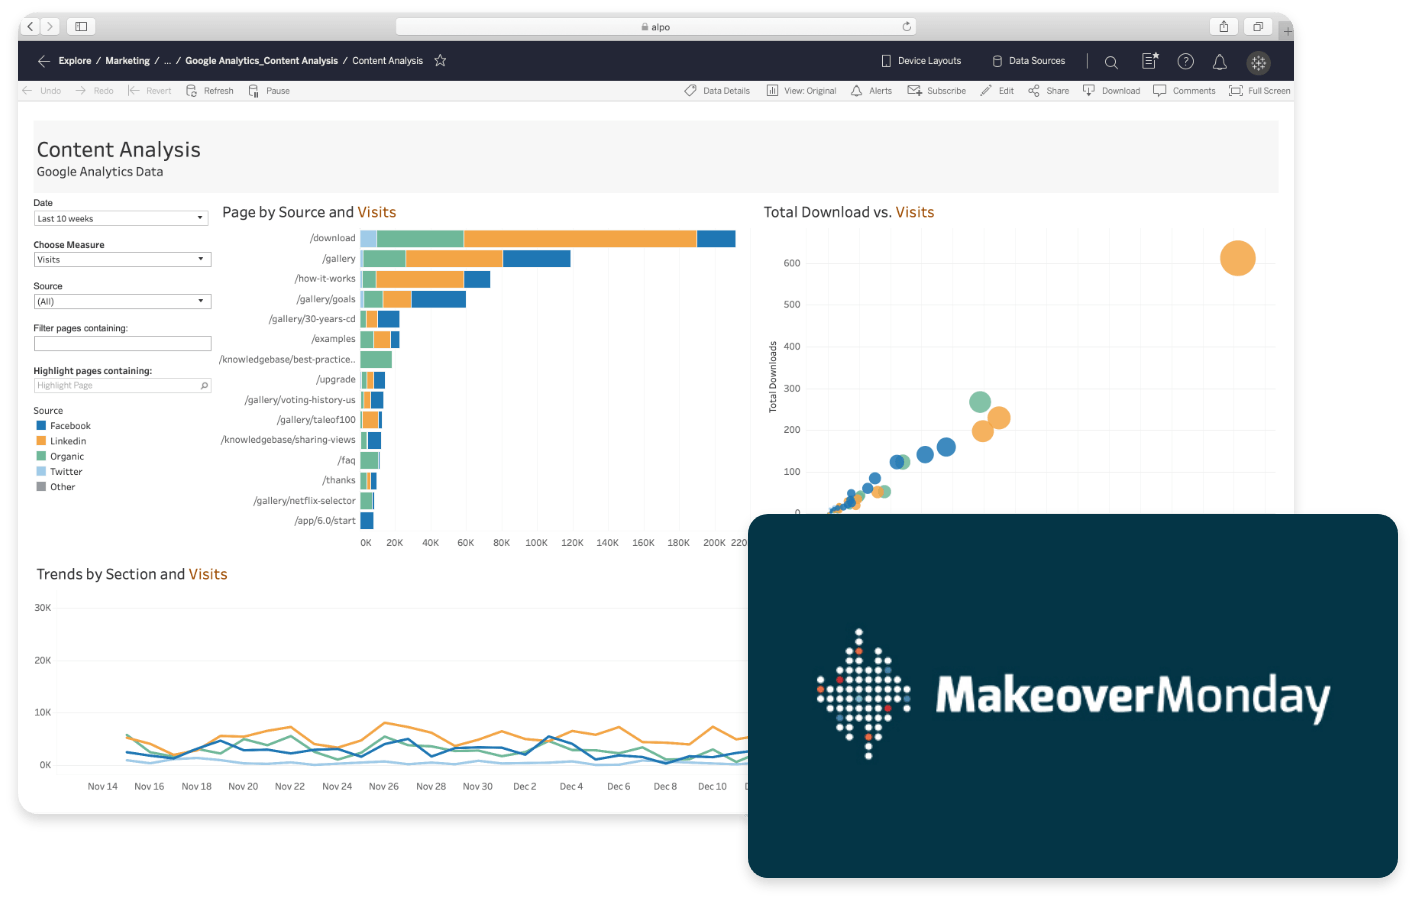
"No matter your role or the industry you work in, consistently practicing and experimenting with data and visual analytics will open exciting new career paths. Visually analysing data gives you the ability to create compelling stories that can be easily communicated to your team, company, and clients—even non-technical audiences. You quickly build a strong set of data skills when you regularly analyse data to answer business questions or experiment with data by joining social data projects such as the brilliant #MakeoverMonday.
This investment in data skills, problem-solving, and data-driven decision-making will give you an expertise that can be transferred to any role or organisation. Whether you decide to dive deeper into your current role or change direction, analytics experience will serve as a key asset throughout your career and accelerate your growth."


Principle #4
Prove it.
"Without data you're just another person with an opinion.
Would you buy a house without a survey? Would you hire a surveyor without checking their qualifications? I’m sure you wouldn’t, so why would you make a key business decision without the data to back it up? And when analysing data, why would you not examine its source?
Making a data-driven decision doesn’t replace your gut feeling or business brain—it simply makes your decisions more legitimate. Empower yourself and your organisation to prove it: Get closer to the numbers, understand the details, and make better decisions with quality data, presented in a scalable and easy-to-understand format."

Charlotte Nickels
Business Intelligence Manager, Lloyds Banking Group
Making a data-driven decision doesn’t replace your gut feeling or business brain—it simply makes your decisions more legitimate.
Principle #5
Be prepared to change.
"When people and organisations talk about visual analytics, the discussion often centres on which platform can help them analyse their data better and faster. But what’s next?
You won’t unlock the true value of your data by simply discovering new insights. You unlock business value by acting upon those insights—which often requires change. It might be a small change, such as adjusting a KPI, or a big change, such as reimagining your business strategy. It may involve the internal change of a system or process that your data reveals as inefficient or an external change if your data reveals declining customer satisfaction.
Whatever data-driven insights you discover, be prepared to challenge your long-held assumptions and switch things up. It may require extra effort and resources to make those changes, but the practice of visual analysis is worthless if you don’t act upon the insights you discover."



Principle #6
Create a single source of truth.
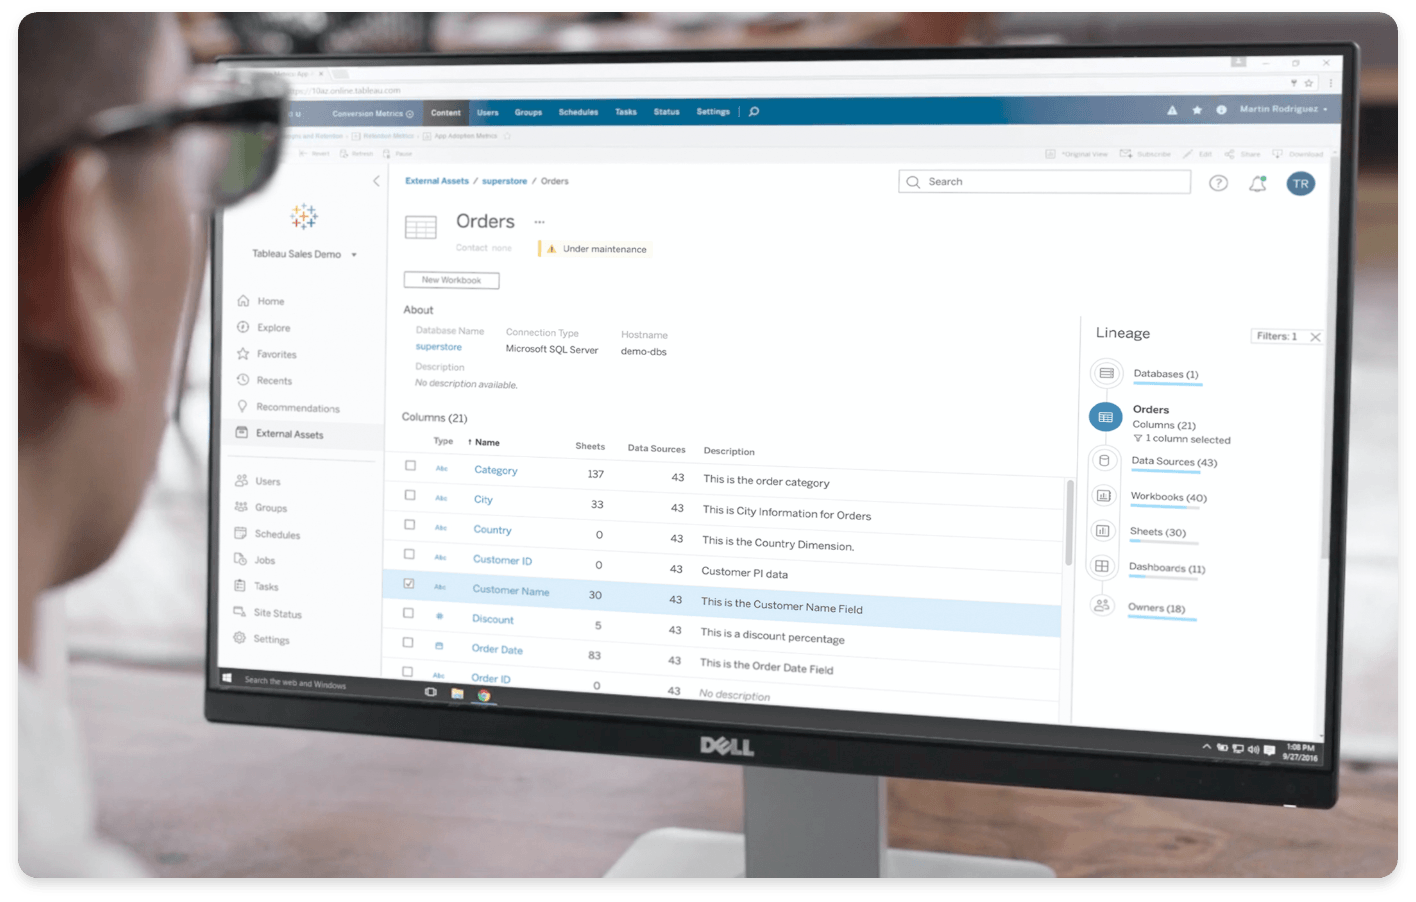
"Data and visual analytics usage has rapidly increased in recent years, and the amount of data available to you and your organisation is at an all-time high. With this comes many data challenges, none greater than the importance of having a single, unified source of truth.
Don’t waste time debating which data sources your organisation should use. Establish a unified data source to solve the needs of everyone in your organisation—from the CEO to the analyst—and create a holistic truth that resonates with everyone."

Erin Hamm
Senior Cybersecurity Engineer, Telecommunications Industry

Principle #7
Data skills are a competitive advantage.
"Simply being able to see your data is not enough. To transform your data into actionable insights, both you and those who consume your analysis need to be empowered to better understand the data. Investing in data fluency or literacy—the universal language of data—is the best way for you and your organisation to ensure success.
As you become more fluent with data, your confidence will grow. With that confidence comes increased engagement based upon a foundation of intrigue and curiosity—a burning desire to not only uncover the what but also the why behind your insights. Invest in your data skills and watch your career and impact on your organisation flourish organically. Harness your natural desire to be the best you can be, and achieve your potential through the language of data."

Simon Beaumont
Global BI Centre of Excellence Director, JLL
Investing in data fluency or literacy—the universal language of data—is the best way for you and your organisation to ensure success.
Principle #8
Measure your successes—and failures.
"Use data and visual analytics to measure and track your outcomes. Data doesn’t just help you make informed decisions, it also enables you to evaluate whether those decisions were successful by quantifying how much value they contributed to the business.
No matter what department you work in—marketing, sales, finance, human resources, or customer service—data and analytics are a powerful ally for helping you succeed. Analysing data ensures that the business activities you tackle can be accurately measured and tracked against KPIs. Even if you fail this time, data and analytical capabilities and insights give you what you need to take the next step with greater clarity."


Principle #9
Data isn’t the end goal—but it will get you there.
"In isolation, data doesn’t have much value. However, data has the power to help you reach your end goal. It brings people together around a single source of truth. It allows you to ask better questions to reach your business goals. Whether you want to understand what happened, why it happened, or how, you can repeat your successes and use data to inform your opinions and decisions. It will be both powerful and liberating."



Principle #10
Seeing is understanding.
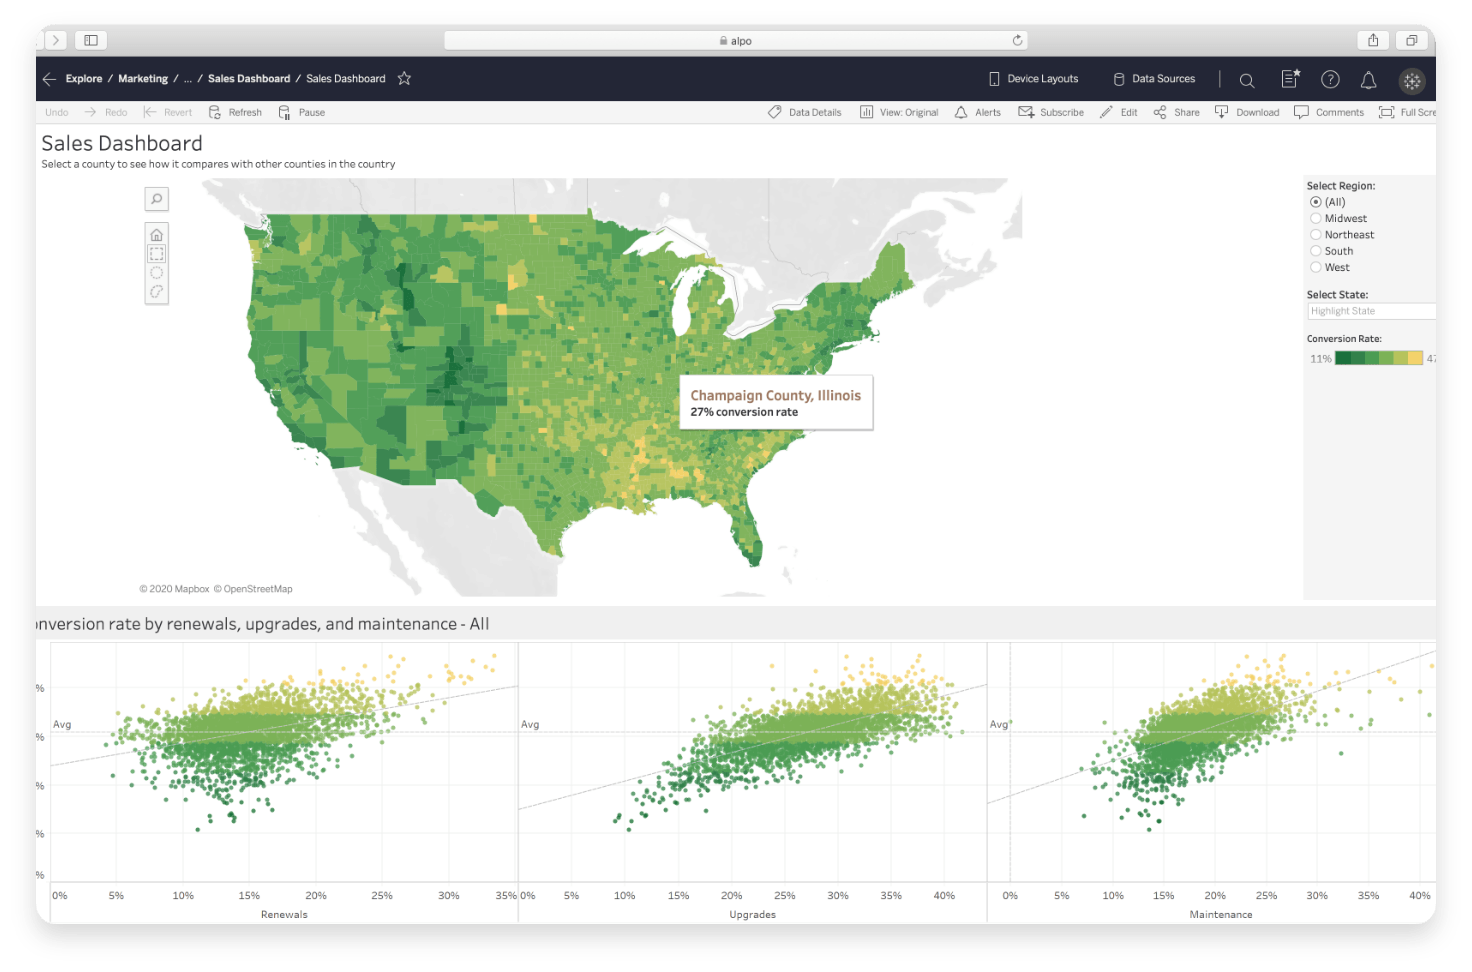
"Your brain is wired to quickly recognise patterns. Leverage that power to spot the unexpected! Seeing your data represented visually enables you to easily investigate your assumptions. The shape of a graph will either confirm or conflict with your views about the performance of your business. If you spot an outlier, it’s a great flag for further investigation and, ultimately, better understanding."
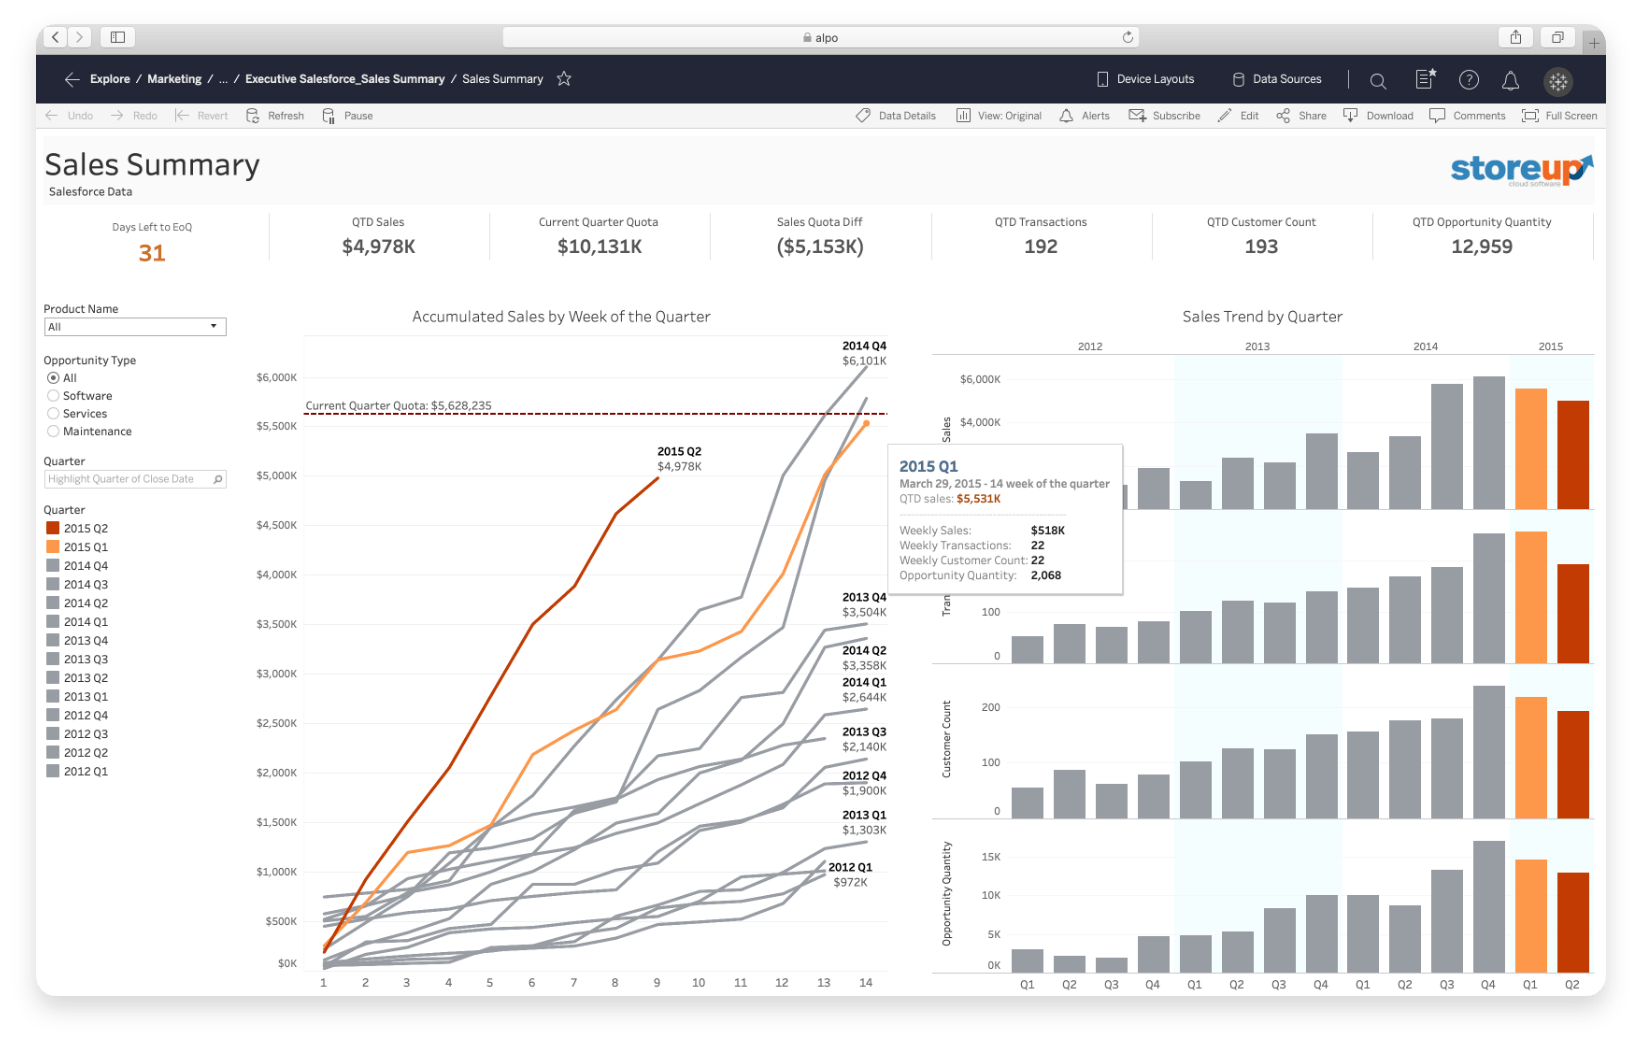


See and understand your data
Change the way you think about data and business analytics. Get started with Tableau.
Thank you to the world’s greatest data community for sharing their enthusiasm and expertise. Special thanks goes to Annabelle Rincon, Charlotte Nickels, Satoshi Ganeko, Eleni Gkika, Alex Waleczek, Erin Hamm, Simon Beaumont, Kimly Scott, David Pires, and Jim de Clercq for providing their tips on how best to start solving your business problems with data.
To learn more from the world’s greatest data community, visit the Tableau Community Hub.