Tableau 2020.4
Analytics made for your workflow

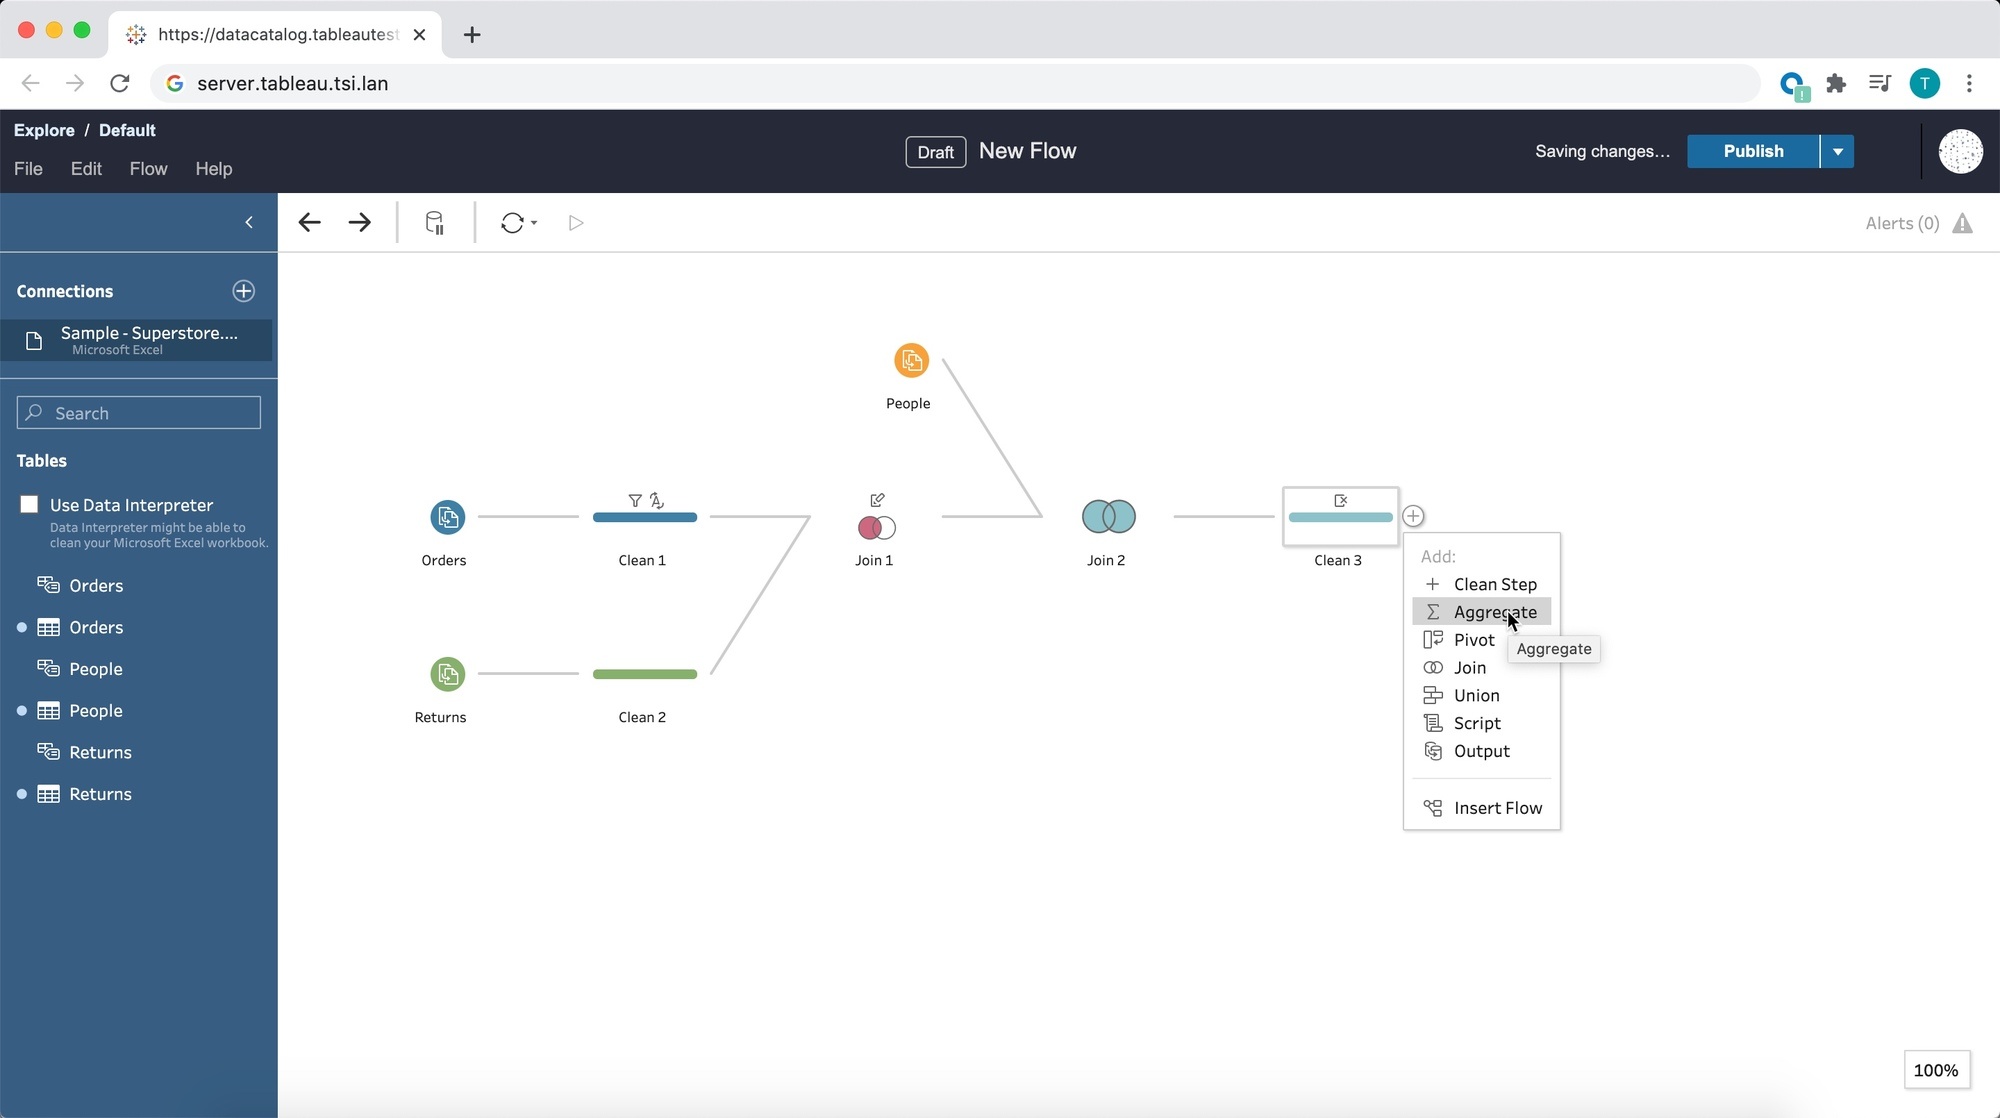
Tableau Prep Builder in the browser
Tableau Prep Builder in the browser allows you to prep your data from wherever you have access to a browser, bringing the data-prep process into one integrated platform on the web. No need to manage individual desktops: IT admins can now upgrade the server to get everyone in the organisation on the latest version.
Tableau Prep Builder in the browser is putting the data prep process in the hands of the people who know the data best, in any browser they can access. This is really going to empower teams to prepare their own data whenever necessary, and unlock all the value that data has to offer.
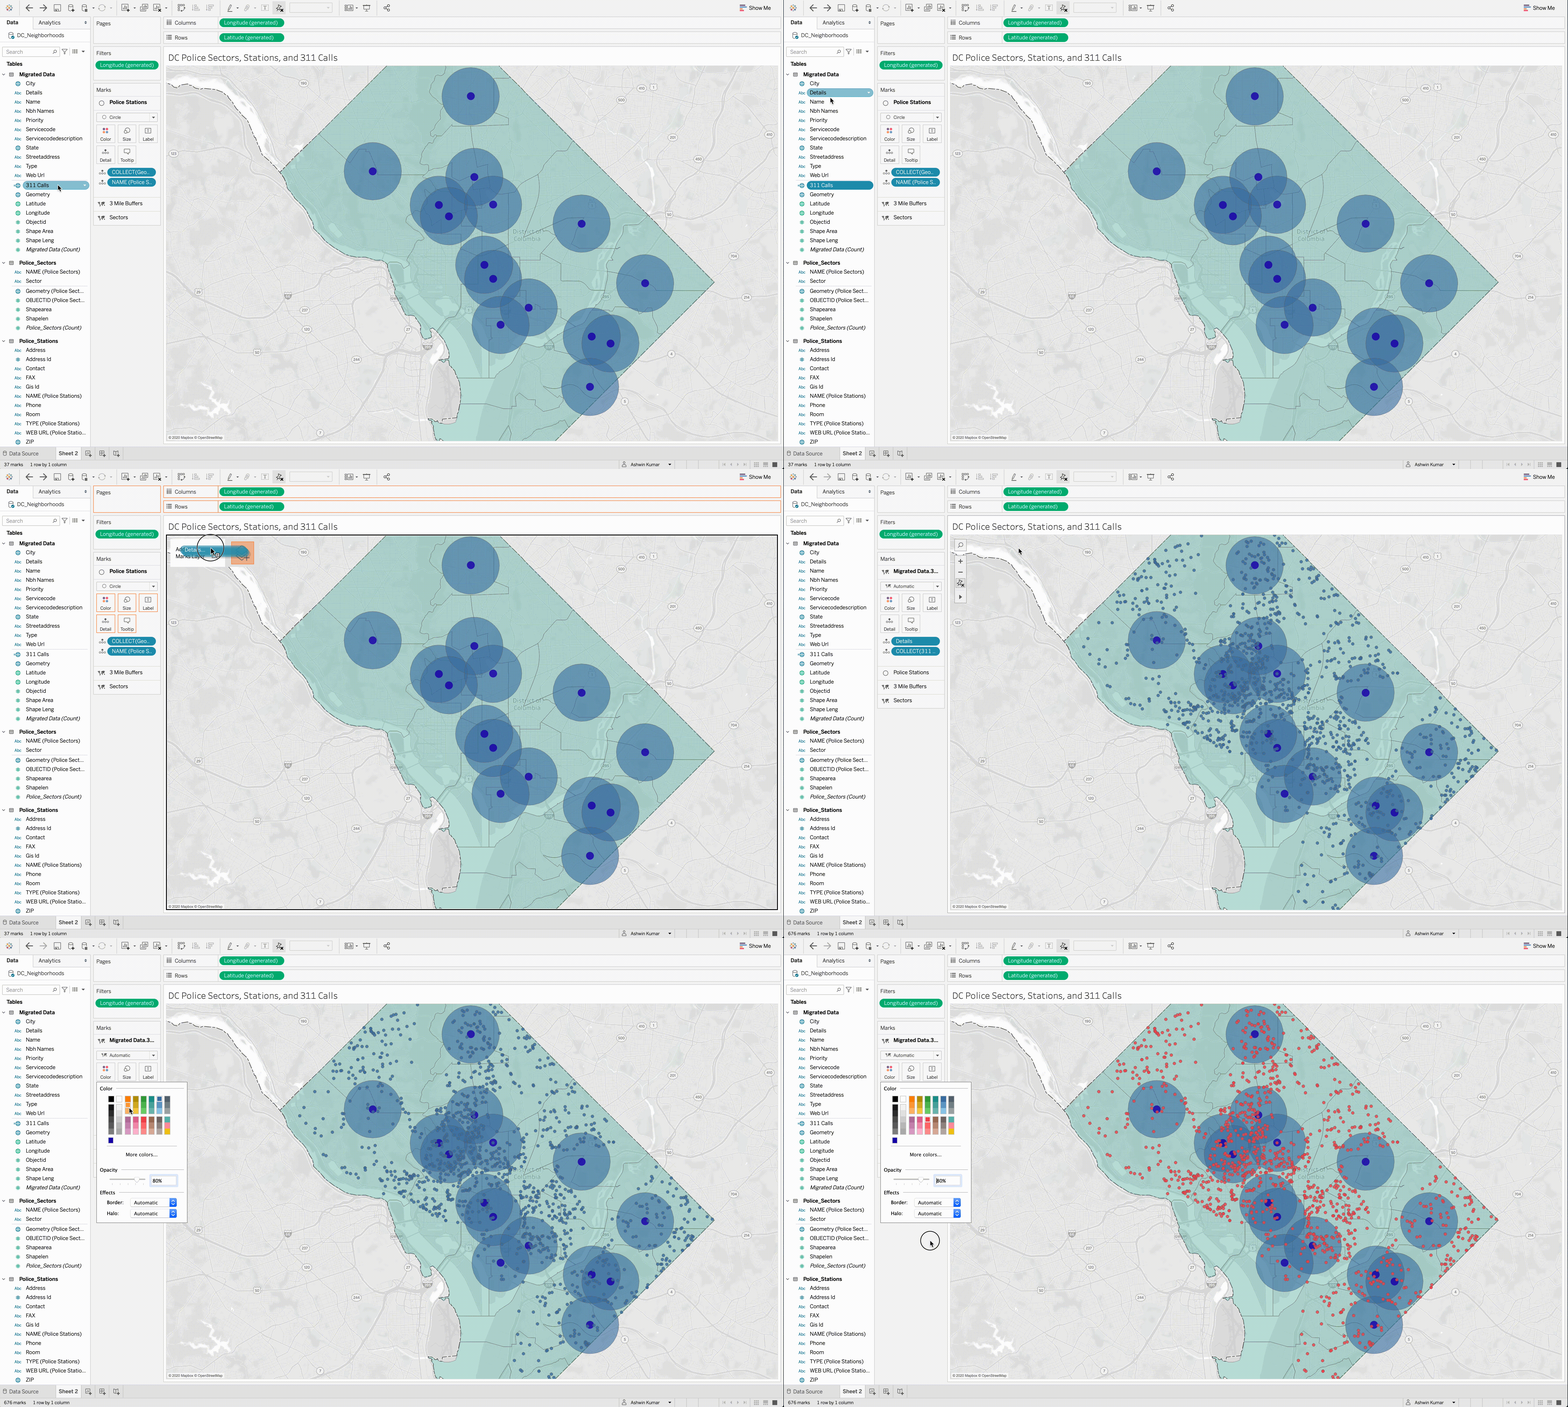
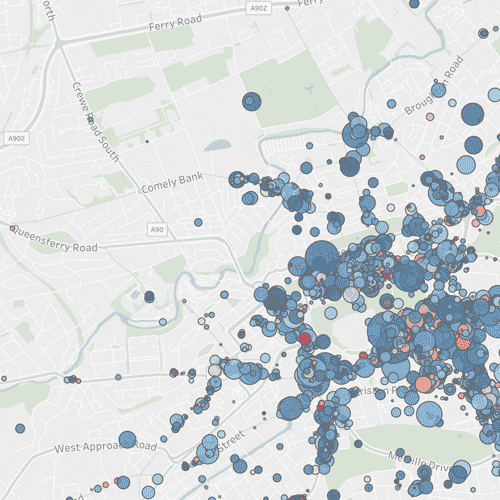
Multiple marks layer support for maps
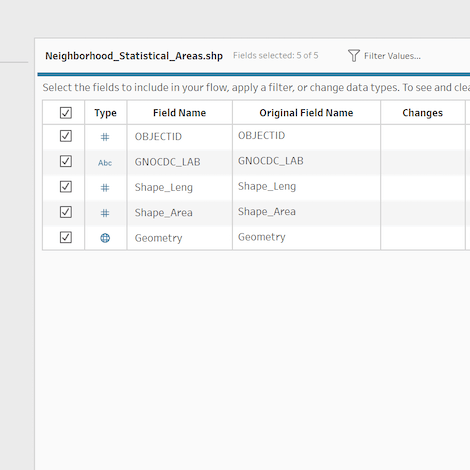
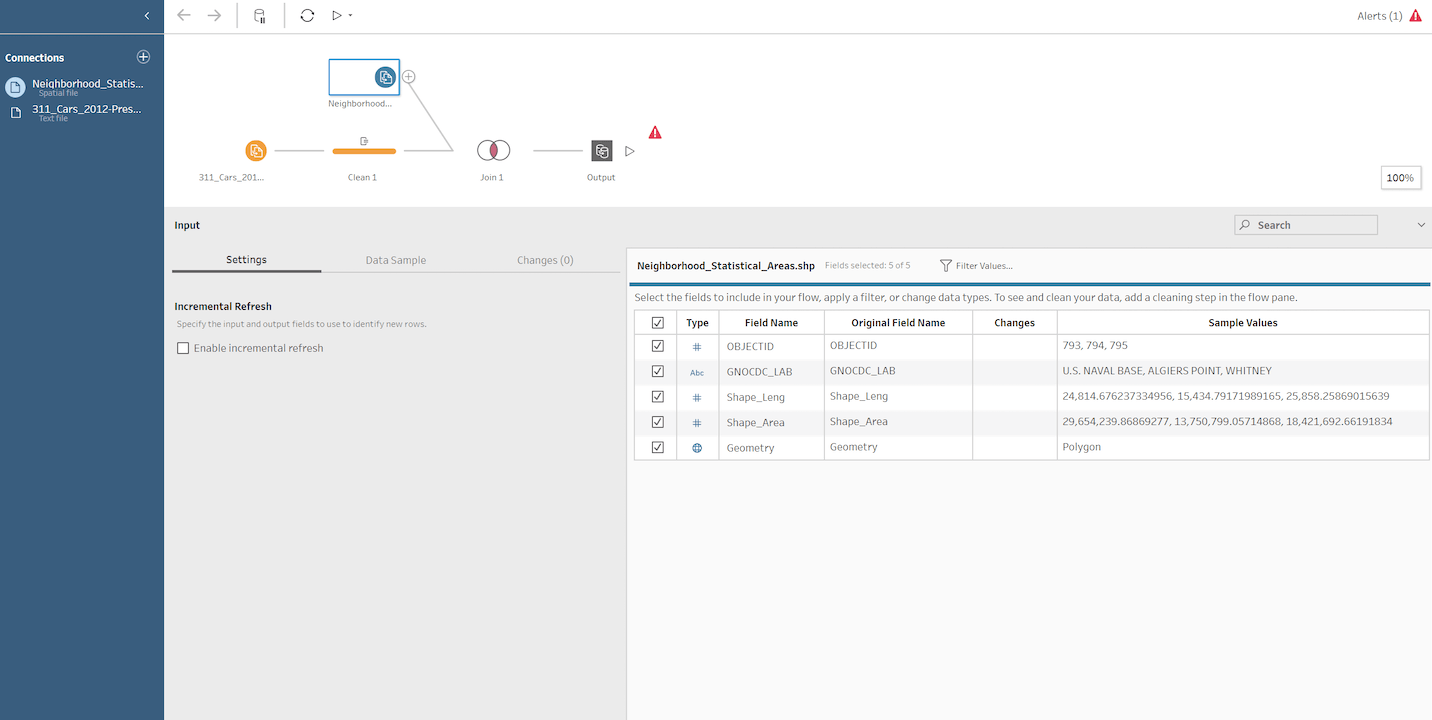
Enhance your geospatial analysis with multiple mark layer support for maps. You can now add unlimited mark layers from a single data source to your map visualisations, bringing multiple spatial layers and context together for better understanding and analysis. This release also brings Redshift spatial support, offline map support in Tableau Server and spatial support in Tableau Prep.
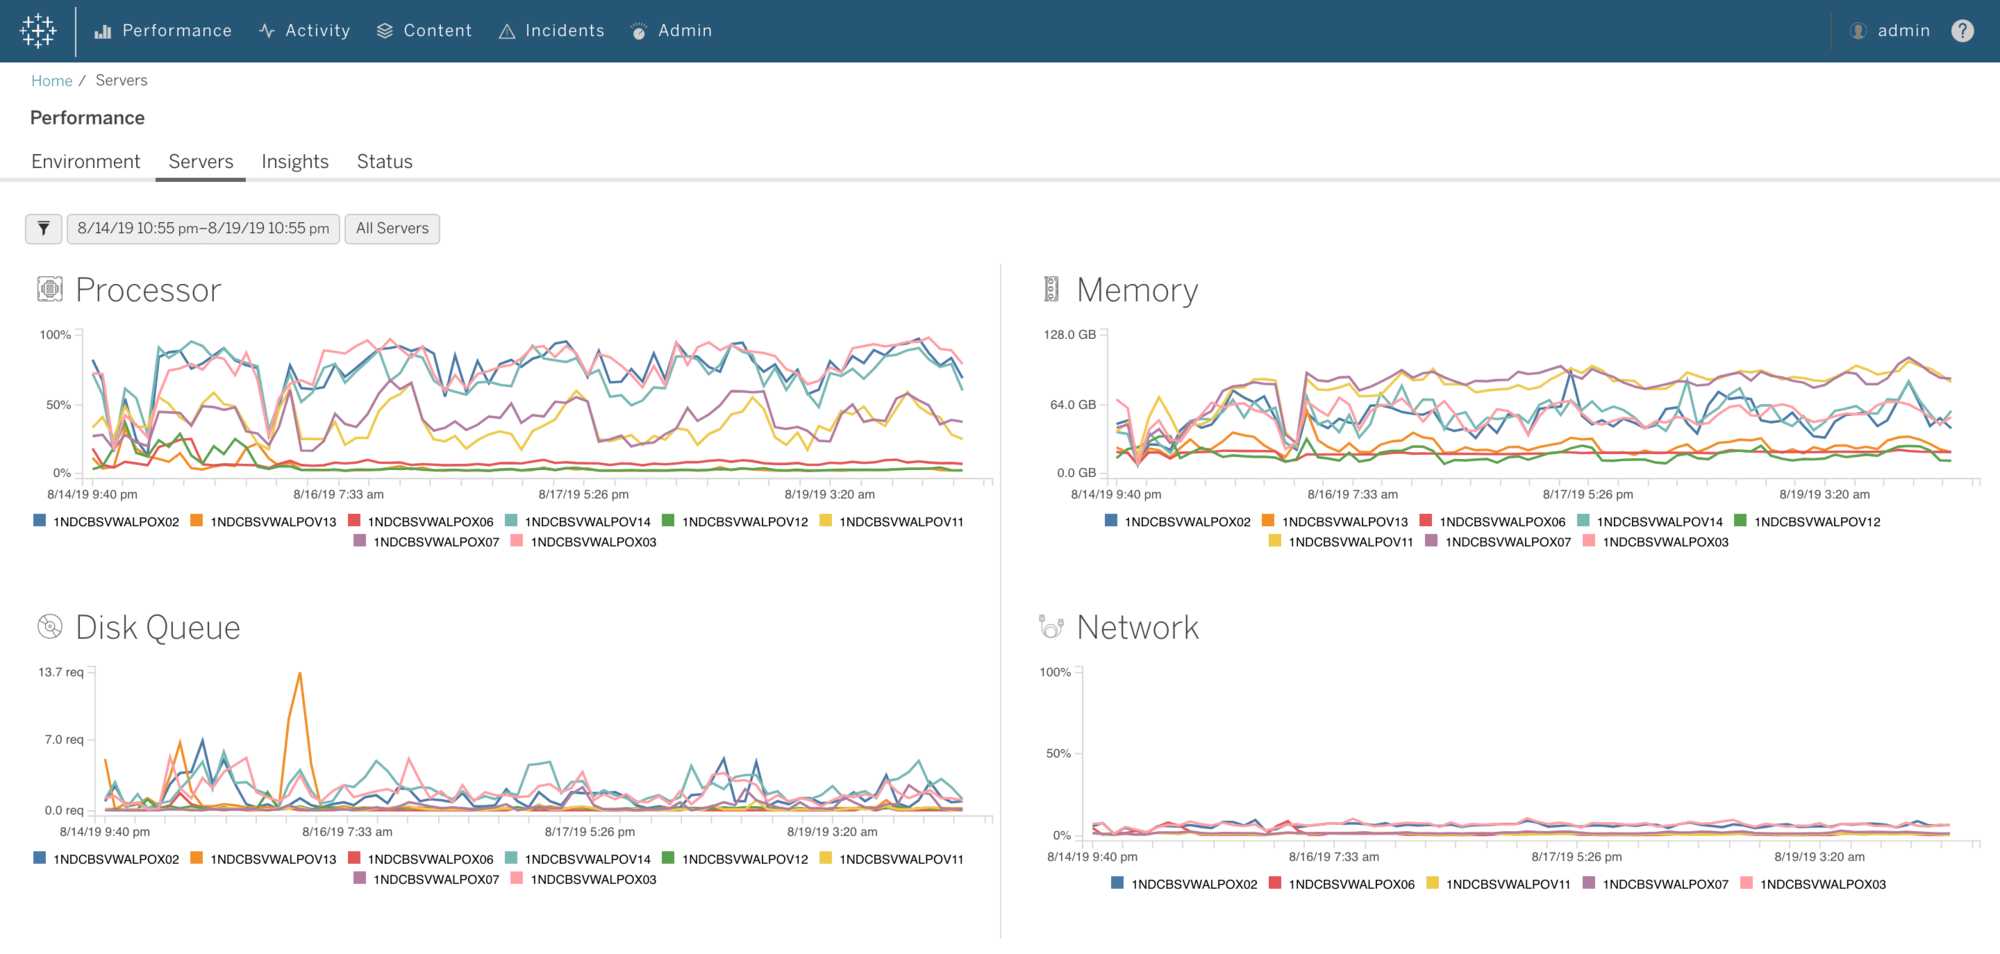
Resource Monitoring Tool for Tableau Server on Linux
Previously available for Windows only, Resource Monitoring Tool now provides agent-based monitoring of your Tableau Server on Linux deployment as part of the Server Management Add-on. Proactively monitor and troubleshoot server health with improved visibility into hardware and software performance.
Tableau 2020.4 feature overview
Tune in for an overview of all the new features included in this release.
Watch nowAll features
Offline map support for Tableau Server
We’re making it easier to access and analyse spatial data on Tableau Server with offline map support. You can now create maps using the offline map style in web authoring, ensuring that maps remain accessible to all users – especially in organisations with strict Internet access requirements.

Resource Monitoring Tool for Tableau Server on Linux
Previously available for Windows only, Resource Monitoring Tool now provides agent-based monitoring of your Tableau Server on Linux deployments as part of Advanced Management for Tableau Server. Proactively monitor and troubleshoot server health with improved visibility into hardware and software performance.
Web authoring enhancements
Highlight Actions
Highlight actions allow you to call attention to marks of interest by coloring specific marks and dimming all others and is now available on Tableau Server and Tableau Online web authoring. Define highlight actions using the Actions dialog box. There you can specify the source and target sheets and the fields you want to use for highlighting.
Marks Card
Users can customize and choose which marks to label in a visualization and decide if they want those labels to overlap. For example, in a view that shows product category sales over time as a line, you can label sales next to each point along the lines. These new marks to Label updates apply to Tableau Online, Tableau Server, Tableau Public, and Tableau Desktop.
Apply Filter to Worksheets
In an effort to build the most efficient dashboard design, we're excited to deliver the 'Apply Filter to Worksheets' option to the web. Apply Filter to Worksheets unlocks the ability to choose specific sheets a filter should be applied, fine-tune your dashboards, and achieve more complex designs.
Create Fixed Sets
Creators and Explorers now have an easy and quick way to create a set either from the data pane or visually via the tooltip command menu for expedient analysis.
Create extracts
Create extracts without leaving the browser. In the web authoring flow, you can now choose to extract your data sources to improve performance.

Predictive modelling function improvements
Select from two additional models in predictive modelling functions, regularised linear regression and Gaussian process regression, in addition to the default model of linear regression. Change the model from the calculation itself and get immediate visual feedback on how that change impacts the predictions when compared to historical data.

Date axis extension
Date axis extension allows you to make customised time-based predictions in Tableau. Select from a pre-populated set of extension options or use a custom menu to select your own range. Date extension works with predictive modelling functions, table calculations like running average, and external services like R or Python.

Custom views tab
We’re making it easier to see and manage custom views on Tableau Server and Tableau Online. Navigate to a new custom views tab to understand how custom views are being used on a workbook. Admins can now easily manage both private and public custom views in one place, deleting unused views or alerting users if their views will be impacted by changes.

Ask Data improvements
Ask Data has a new date range refinement widget that makes it quick and intuitive to change the bounds of any time series viz. Additionally, users can now specify that they want Ask Data to deliver results as a stacked bar chart. Other improvements include the ability to edit data role synonyms directly on the definition page and admin views of Ask Data's usage at the site level – both enabling more centralised governance.
Salesforce Connector API Update
Connect to the latest Salesforce objects, including Work.com objects, with the Salesforce connector API update. Long description: Work.com is Salesforce’s offering of advisory services and technology solutions to help companies and communities safely reopen in the COVID-19 environment. The Salesforce connector API update lets you connect to objects like Crisis, Employee, and InternalOrganizationUnit from Work.com data in order to visualize it in Tableau. This update brings the connector up to API version 49.0

Intelligence (formerly Datorama) connector
Salesforce Intelligence unifies marketing spend and performance data across channels into one system of record, empowering marketers to measure impact to increase customer engagement, eliminate waste, test and learn, and align all stakeholders. The Intelligence integration connects Tableau to Intelligence, creating an easy way for customers to consume harmonised Intelligence reports in Tableau.
Create Tableau Server backups faster
Enjoy improved data compression performance that creates Tableau Server backups up to twice as fast. A new progress bar gives visibility into what step the backup is on and how much time is remaining.
Retry from last checkpoint during install or upgrade
In the case of an unexpected issue or error, easily resume the Tableau Server install or upgrade from the step before the point of failure after addressing the issue.

Tableau Catalog & Metrics integration
Tableau Catalog allows you to see all up and downstream data assets and their relationships, and knowing which Metrics use a particular data asset is just as important. See which Metrics are created off a data asset and take advantage of understanding the impacts any changes might have.
Learn more about Tableau releases


