Visualizing Dense Data
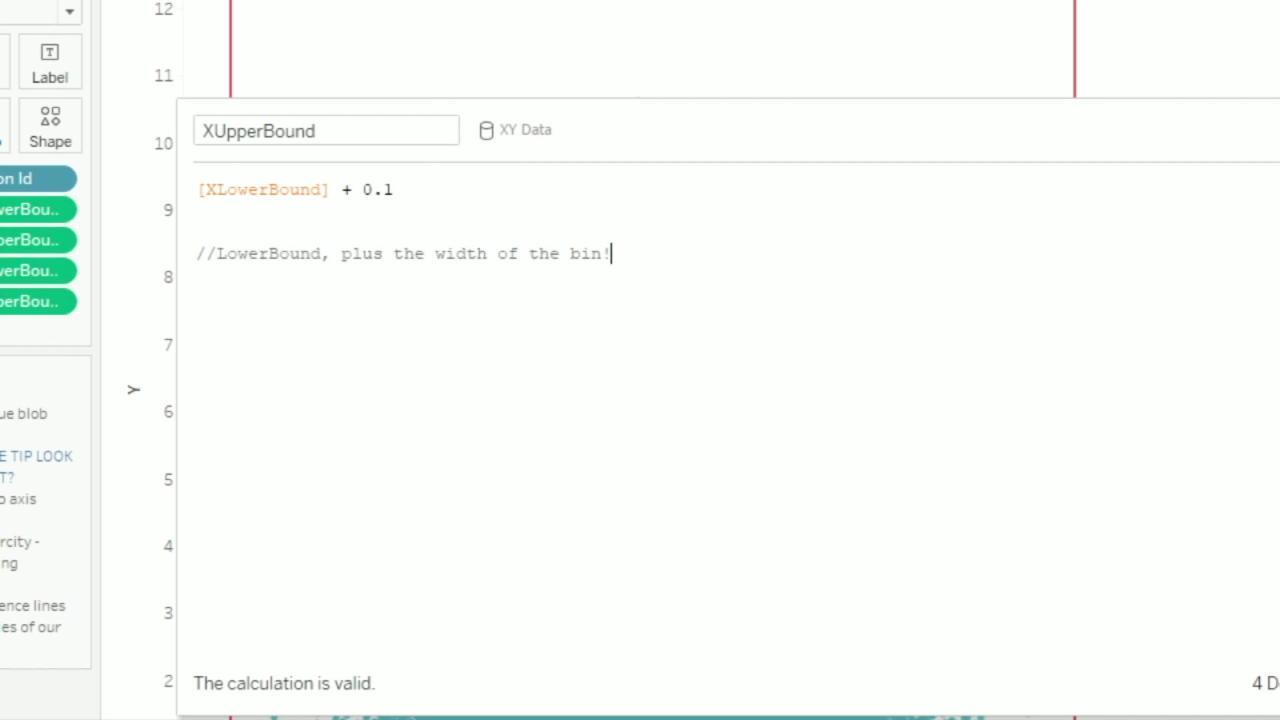
Most chart types are not made for big data. Have you ever seen scatterplots or maps with way too many marks? They are unusable. Leaving performance aside, visualizing tens of thousands of marks is also a design challenge. If jittering and hexbinning sound like gibberish to you, join this session and learn about tips, techniques and chart types for visualizing dense data.
Session Speaker: Sasha Singh
Type
Video on Demand
Topic
Analytic Skills