Interactive Mathematical Analytics
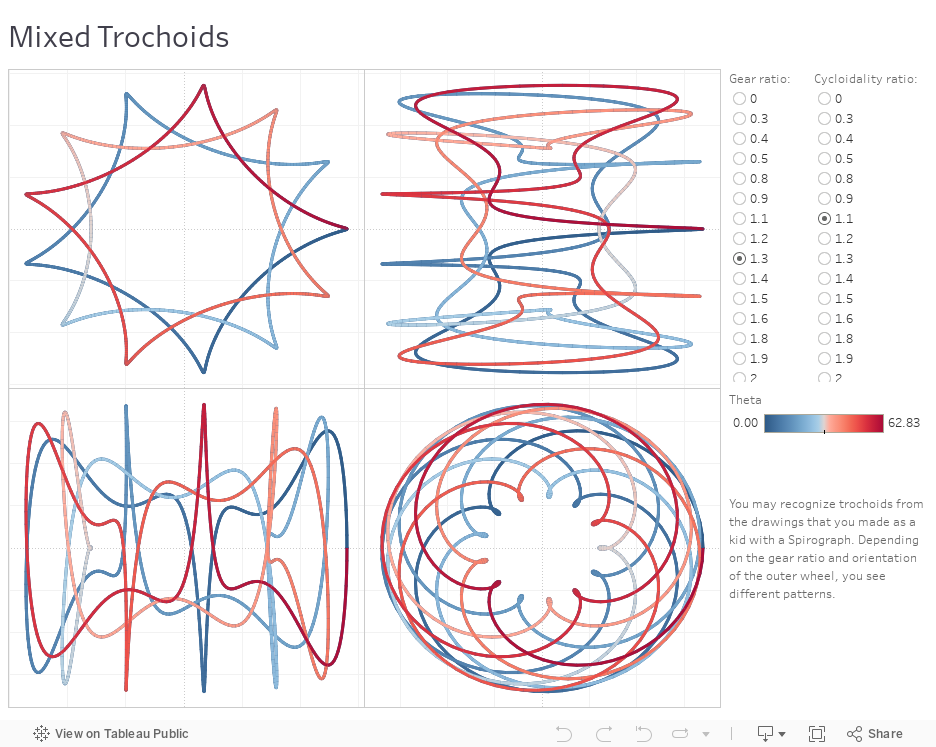
This workbook illustrates the family of curves called trochoids. To get a trochoid, fix a point on a circular disk (like a reflector in a bicycle wheel) and roll it along another circle. Using filters, dashboards, and drag-and-drop exploration, we can generate a variety of interesting curves with our back-end functionality. Tableau gives you the flexibility to visualize virtually any type of data.
Create and share on Tableau Public
Join the newsletter and find daily inspiration with the Viz of the Day. Yours could be featured next!

Tableau Conference Step Tracker 2025
Get ready to step your way to Tableau Conference #TC25 with this #VizOfTheDay by Brittany Rosenau. See you in San Diego!
Interact with the viz