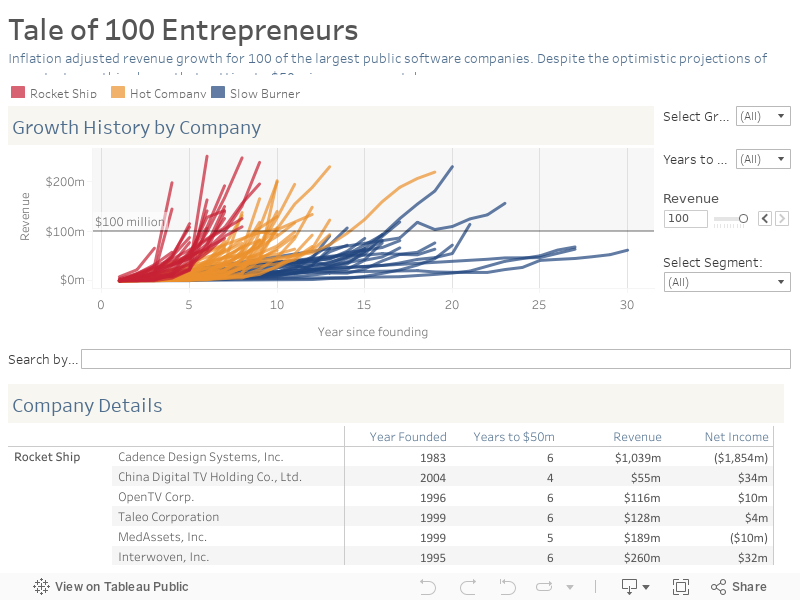
Tale of 100 Entrepreneurs
The visualization is filled with investment stories and insights. For instance, most successful technology companies aren’t rocket ships. Only 28% of the nation’s most successful public software empires were rocket ships. (A rocket ship is defined as a company that reached $50 million in annual sales in 6 years or less.)
Create and share on Tableau Public
Join the newsletter and find daily inspiration with the Viz of the Day. Yours could be featured next!

Two Eras of Safety (Iron Viz 2025 Winner)
Explore this #VizOfTheDay by 2025 #IronViz champion Bo McCready. Created on stage during the live competition at #TC25, Bo uses marks and animations to visualize wildlife strikes by species between 1990 and 2023.
Interact with the viz