Visually Analyzing College Football's BCS Rankings
The 2007 college football season ended with LSU hoisting the $30,000 Waterford Crystal BCS Championship Trophy.
If you're unfamiliar, BCS (Bowl Championship Series) is the organization that determines which teams play in the major college football bowls – including matching the top two teams against each other for at least a share of the national championship.
Four of the five BCS bowl games this year were blowouts, including a lackluster title game. These match ups were decided using a formula that consists of three equally weighted components: the USA Today Coaches Poll, the Harris Interactive College Football Poll, and an average of six computer rankings. Despite the controversy that surrounds it, there is one thing the BCS does do right – it waits until mid season to release its first rankings rather than judge a team on what it did last year or its weak pre-conference opponents.
Using Tableau I created a data visualization of this year's BCS data and three things stood out (Download the Tableau Packaged Workbook - view with Tableau Desktop or free Tableau Reader).
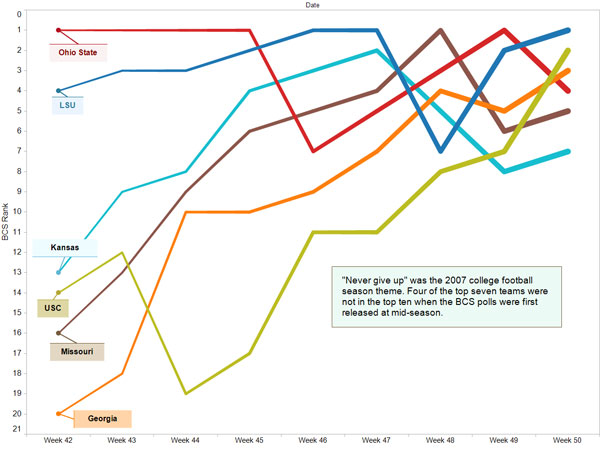
1. It was a wild ride. In the view below, you can see long color streaks as teams moved dramatically though the rankings. As the paths change direction a story is told about late season heroics and failures. You can see that several teams moved all the way to #2 only to lose their next game (highlighted). We even see teams like South Florida climb to #2, South Carolina to #6, and Kentucky to #7, only to be left out of the season ending polls. South Florida did get a chance to resurrect their season in the Sun Bowl, but lost badly to Oregon, another #2 that took a nose dive though the polls. I guess this could have been called the Overrated Bowl.

2. Never give up the fight. An interesting visual brought to light that several of the top teams were not ranked above #12 when the BCS rankings were first released. Except for Ohio State, the top teams have strong upward end-of-season trends. USC moved all the way from #19 to #2 and Georgia went from #20 to #3.

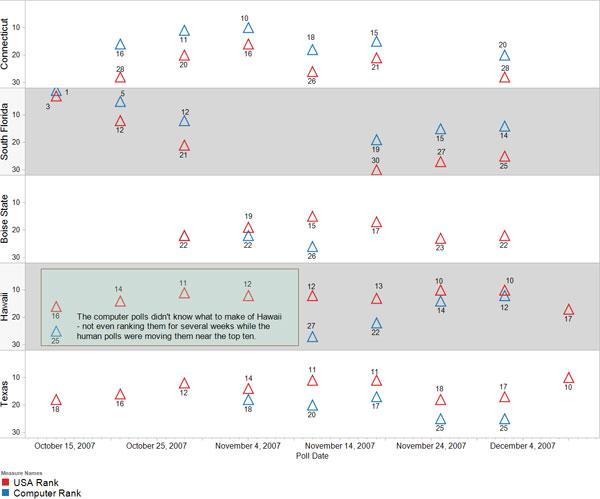
3. The three BCS inputs are relatively consistent in the way they treat conferences. I did some analysis on how the different polls treated different conferences. The only obvious outlier was how the computer rankings score WAC teams. I’m not sure, but perhaps the computers rankings weigh strength-of-schedule more so than the Harris and USA polls. I'm guessing, given human nature, that the coaches and panelists voting in the Harris and USA polls tend to give the smaller, underdog schools the benefit of the doubt. In the view below, I isolated five teams with the largest discrepancy between the computer rankings and the USA Poll (Harris and USA are nearly identical). Most notable was how the computer rankings liked the Big East (South Florida and Connecticut) and were not huge fans of the WAC (Boise State and Hawaii). But considering what Georgia did to Hawaii and then East Carolina taking care of Boise State, maybe the computers do know best. Out of the teams that carried the largest ranking differences only two ended up in the final USA Rank (they all fell out of the computer rankings).

- Click here to download the Tableau Packaged Workbook file (2007-BCS-Analysis.twbx)
- I used the final USA poll for my final BCS rankings as the BCS does not release a poll after the bowls.
- The six computer rankings used in 2007 include:
Subscribe to our blog
Get the latest Tableau updates in your inbox.


