Our Favorite Turkey Day Dashboards
For data nerds who celebrate the holiday, Thanksgiving is about a lot more than food, family, shopping, and sports. It's about the plethora of new data sets made possible by the holiday—and all the delicious dashboards that ensue.
Here at Tableau, great visualizations make us drool. So in honor of the holiday, we'd like to share some of our favorites. The themes range from shopping to, well, lots and lots of food. (What can we say? Data makes us drool, but so does pie.)
Black Friday: Now bigger than Thanksgiving
Tableau Product Manager, Dan Hom, made this viz three years ago—but we think it’s timeless.
Thanksgiving vs. Black Friday, Revisited
Wondering what's actually going on this year? Tara Walker, from our Tableau Public team, revisited the shopping trends and discovered something fascinating...
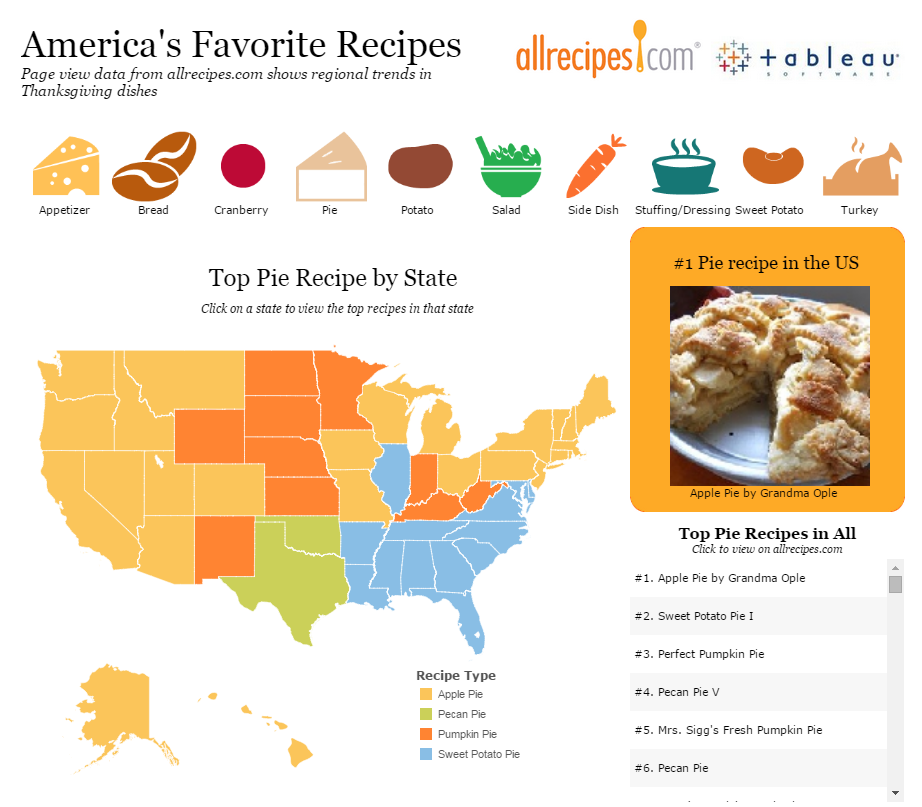
America's Favorite Thanksgiving Recipes
Last year, our Senior Tableau Public Data Analyst, Jewel Loree, teamed up with Allrecipes to discover which recipes got the most traffic on their website. Go on, check out your state's stats! (Click to view the live viz.)
A Real Food Dashboard
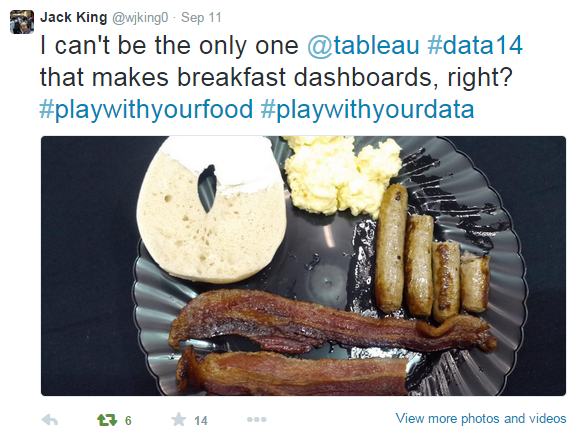
We couldn't resist throwing this in as well. Jack King made this amazing 'dashboard' at Tableau Conference. Then we thought, 'How creative can data geeks get with their food?' That's the challenge we have for you this weekend. We want you to play with your food and create a fun 'dashboard' out of it!
So whether you build your dashboard right in front of Grandma—or if you need to save this activity for your leftovers—we want to see what you create with your food. Snap a picture, then share it with us on Twitter, Facebook, or Instagram using the hashtag #playwithyourdata.
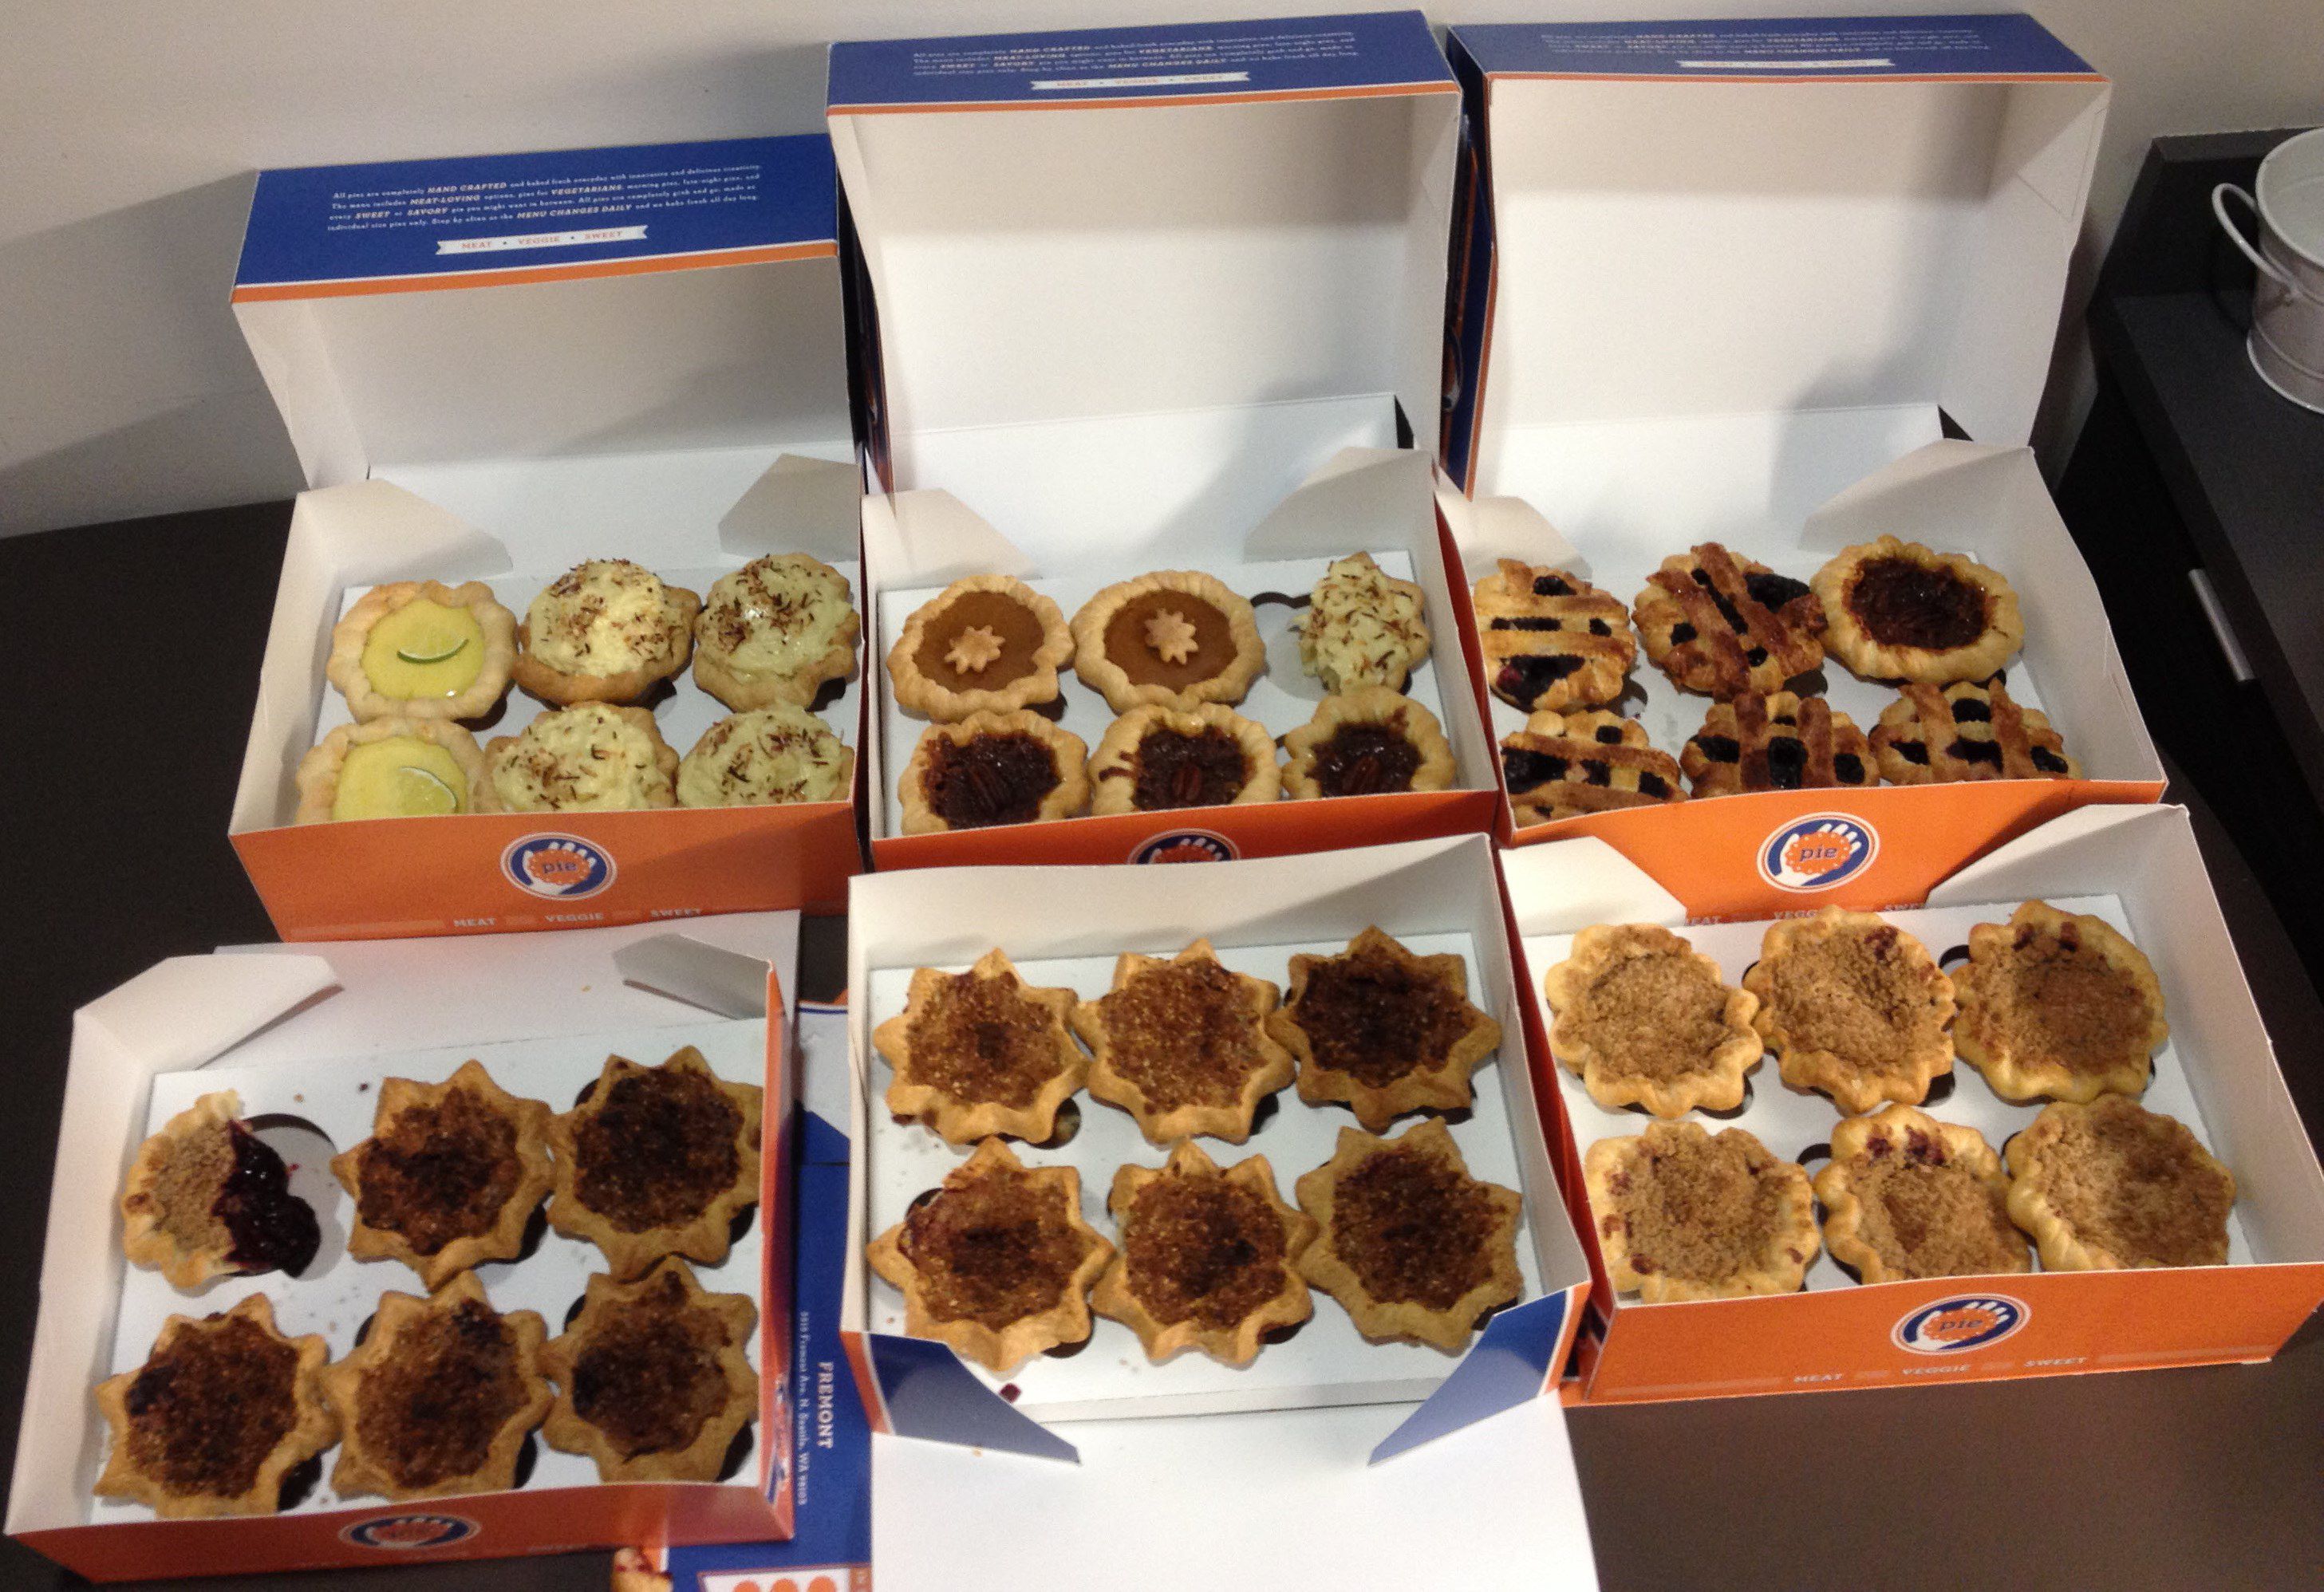
For inspiration, here's a 'small multiples pie chart' we made in the office. Happy Turkey Day!

Subscribe to our blog
Get the latest Tableau updates in your inbox.


